Installs and configures the following services to work together:
One line explanation of each service does:
- Grafana: Visualising your metrics in dashboards. Sources data from many datasources (eg. Prometheus, Loki, InfluxDB)
- Prometheus: Collecting metric data
- Loki: Collecting metric data related to logs
- Promtail: Log agent that sends logs to Loki in a format it can parse
- syslog-ng: Syslog forwarder (sends logs to Promtail)
- node_exporter: Exposes a system's metrics (cpu, ram, network, disc etc) to Prometheus
- snmp_exporter: Forwards SNMP traffic from SNMP devices to Promethues
- cAdvisor: Sends Docker container metrics to Prometheus
This repo is inspired by the excellent work done in grafana-loki-syslog-aio.
Start up the stack with:
docker-compose up -d --force-recreate
The default login is admin/admin. You can change the password to whatever you like after that.
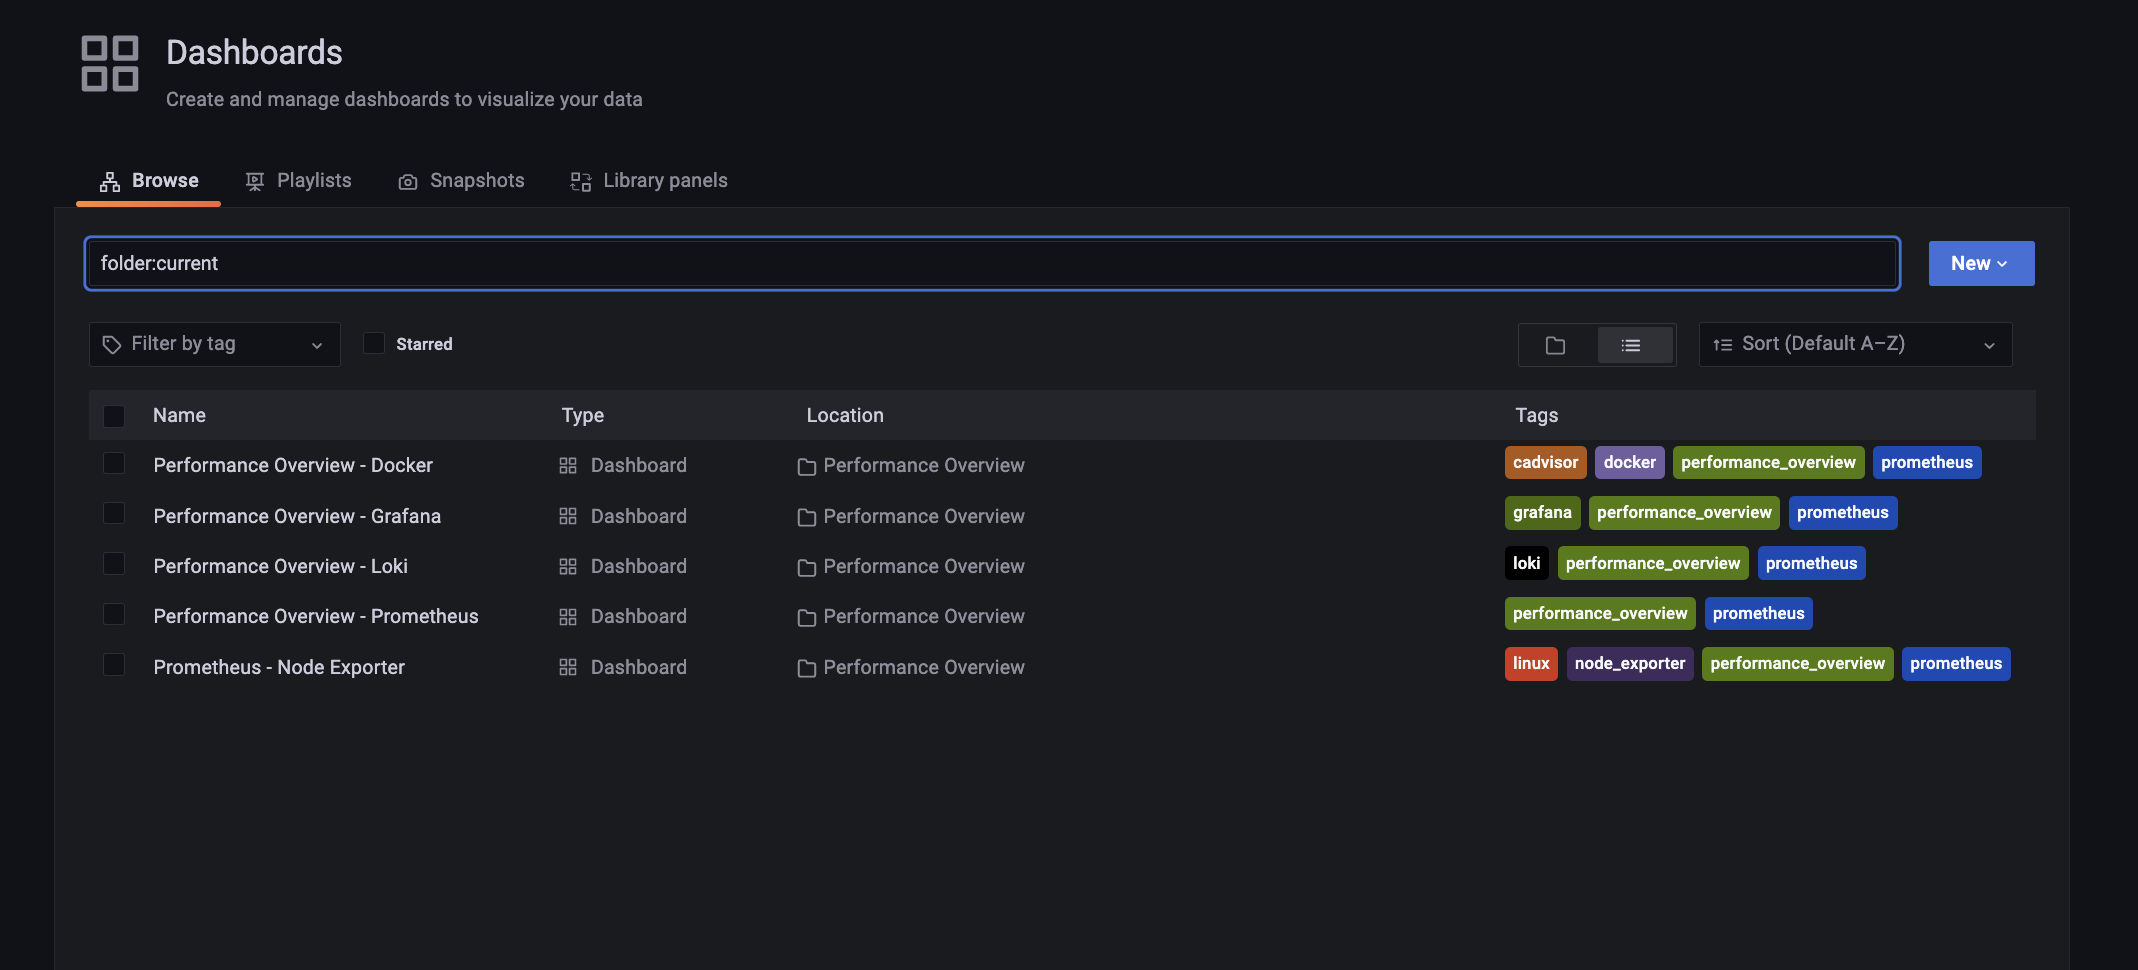
There are five preconfigure performance metrics Dashboards:
- Docker
- Grafana
- Loki
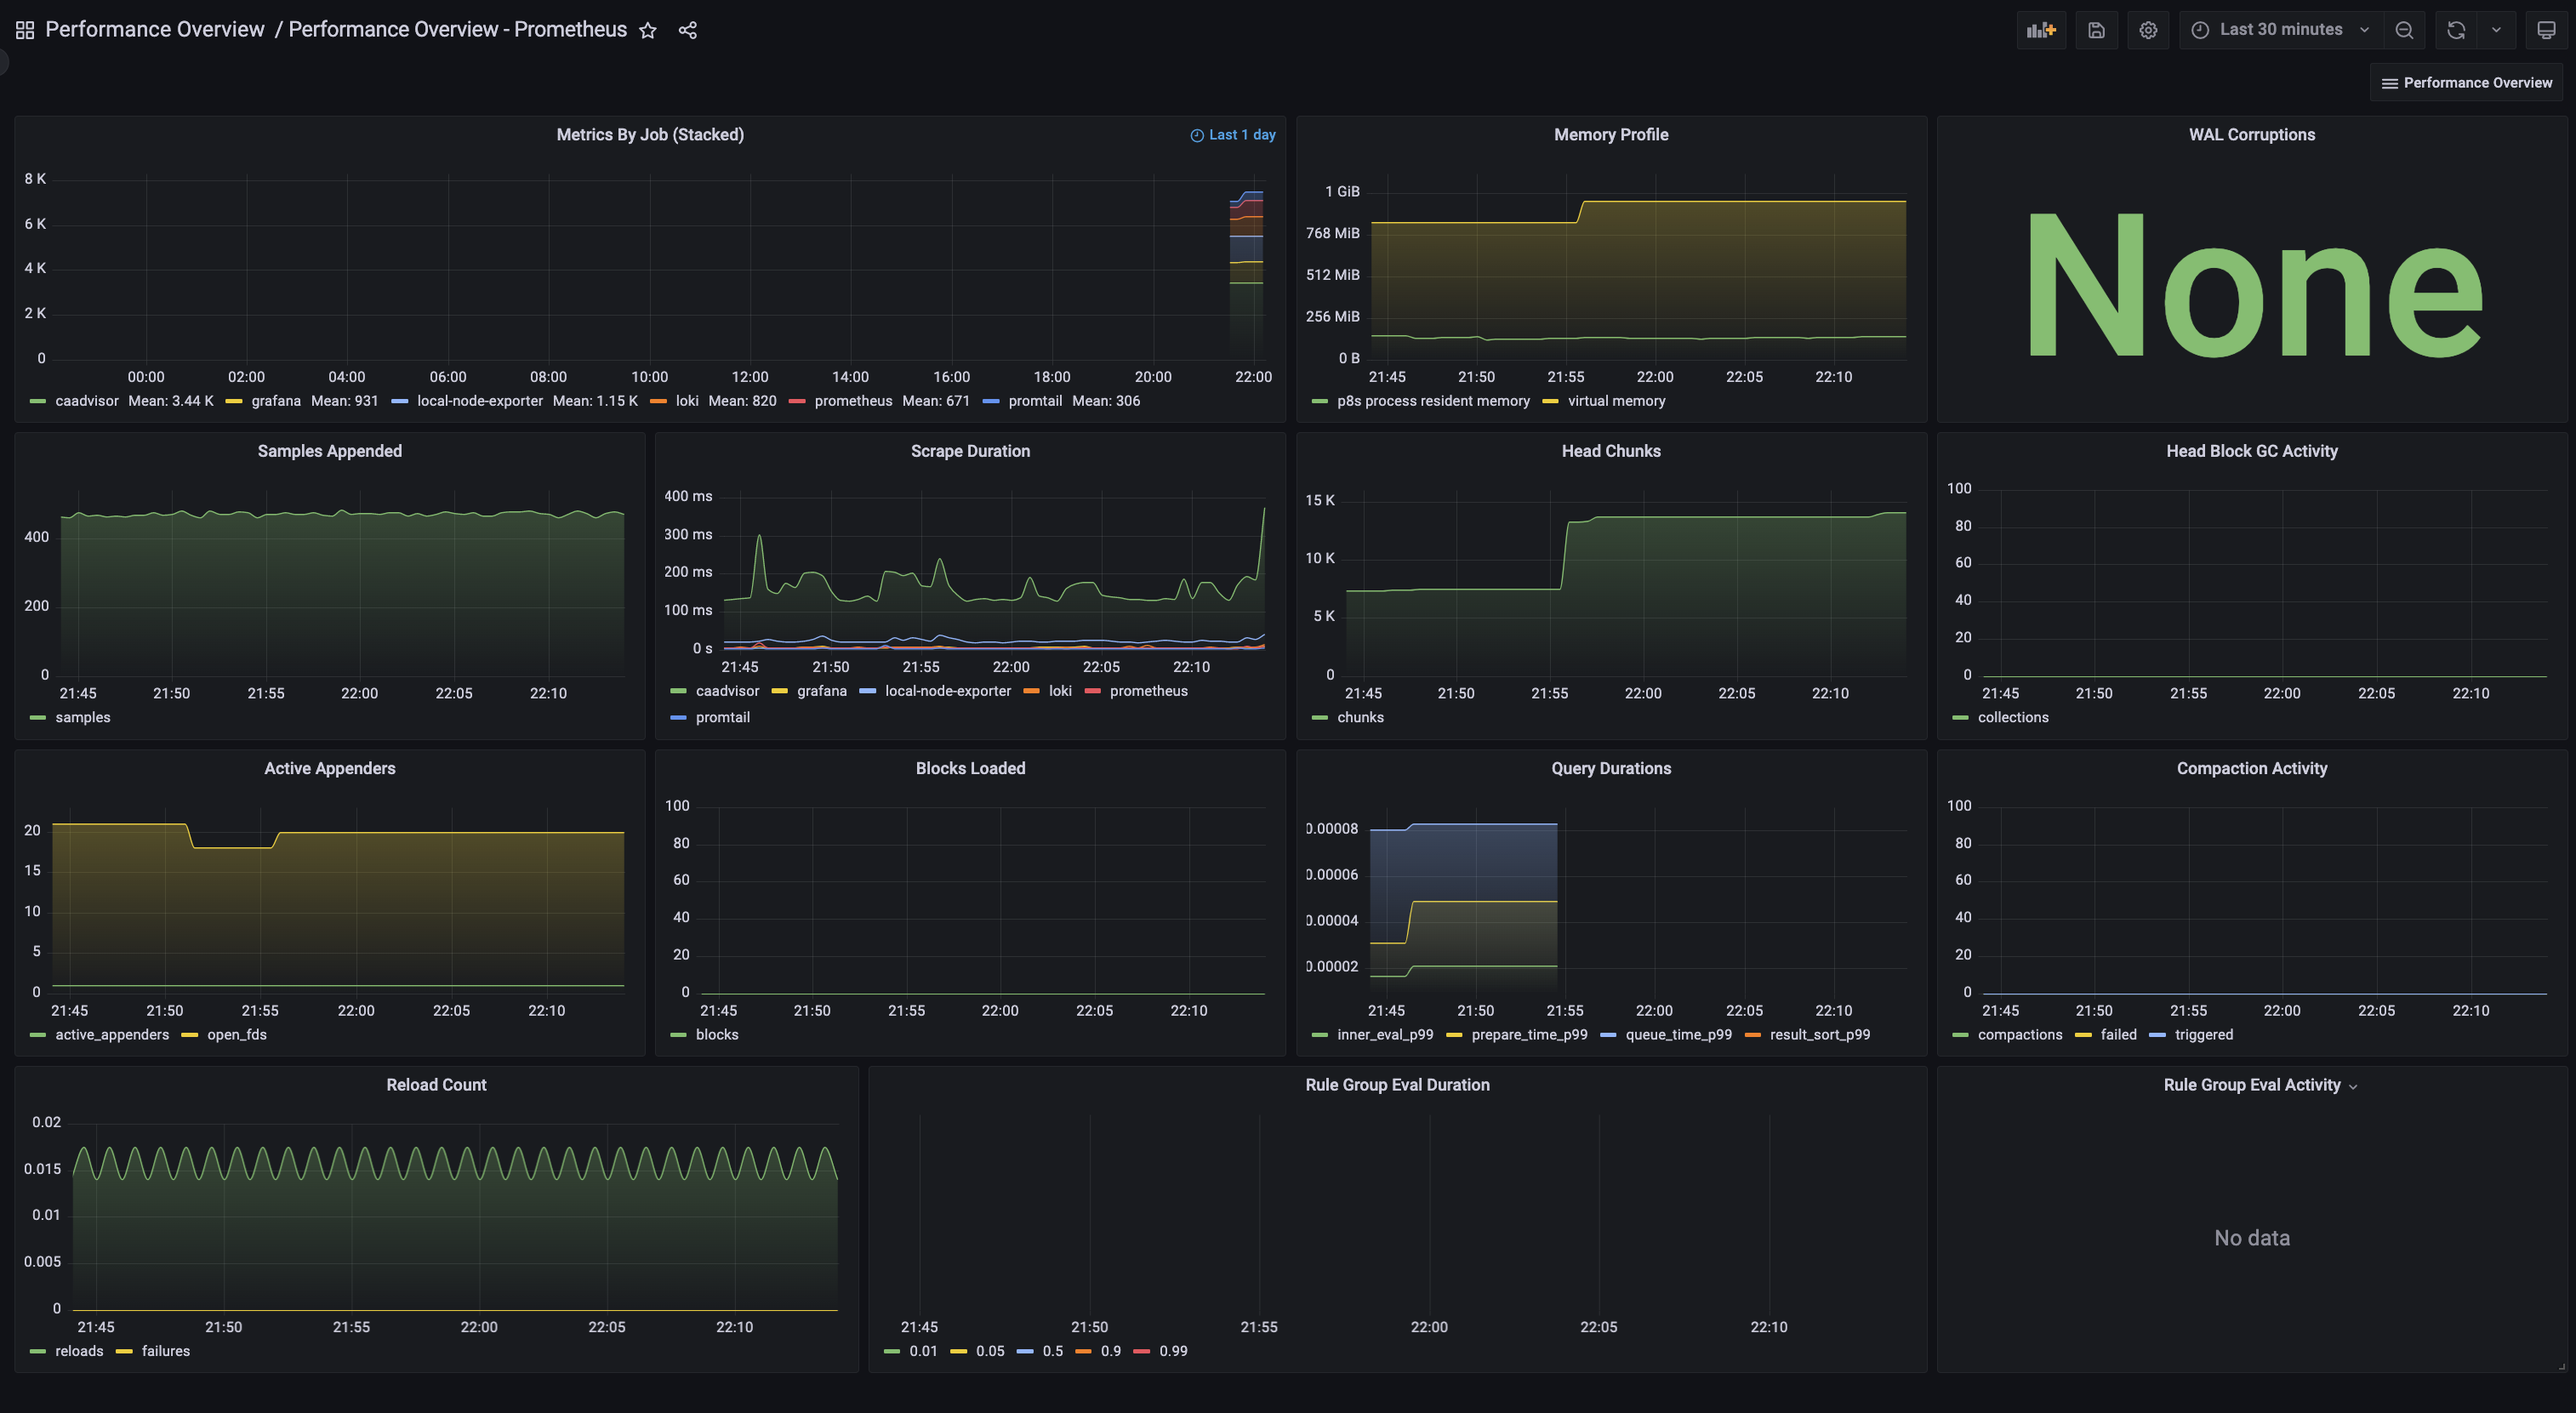
- Prometheus
- Node Exporter
The Prometheus dashboard as an example:
To add custom configuration you need to update the appropriate config files as outlined below.
Add your custom scrapers:
#prometheus/config/prometheus.yml
 - job_name: 'your_job_name'
   static_configs:
   - targets: ['target_id:port'] # endpoint running /metrics
For example, to get metrics from a node_exporter running on 192.168.1.50 add the following to prometheus/config/prometheus.yml:
- job_name: 'my-node-exporter'
  static_configs:
  - targets: ['192.168.1.50:9100']
See The Prometheus Configuration Documentation for more examples.
To register your SNMP stats:
- Enable SNMP functionality on your device
- Configure your community name for your SNMP community
- Add the community name to
snmp-exporter/config/snmp.yml:
#snmp-exporter/config/snmp.yml
  auth:
    community: <your community name>
Then add the following section to your prometheus/config/prometheus.yml:
 - job_name: 'snmp-exporter'
   static_configs:
   - targets: ['<target_ip_1>']
     labels:
       job: '<your_label_1>'
   - targets: ['<target_ip_2>']
     labels:
       job: 'your_label_2'
   metrics_path: /snmp
   params:
     module: [if_mib] # Name of snmp module. If you generated your own snmp.yml file then use the name of that module here.
   relabel_configs:
     - source_labels: [__address__]
       target_label: __param_target
     - source_labels: [__param_target]
       target_label: instance
     - target_label: __address__
       replacement: <host ip running snmp_exporter>:9116  # The SNMP exporter's real hostname:port.
- An Advanced Guide to Network Monitoring with Grafana and Prometheus
- Step-By-Step Guide to Connecting Prometheus to pfsense via Snmp
To forward syslogs to syslog-ng, set the following as the syslog server in the source device:
<host ip running syslog-ng>:514 or <host ip running syslog-ng>:601 depending on what your device supports.
To test any service exposing metrics to Promethues, you can query there /metrics endpoint.
For example to query your Grafana metrics hit: http://<host ip running grafan>:3000/metrics
| Service | HTTP Ports | Other Ports |
|---|---|---|
| Grafana | Web, Metrics | - |
| Prometheus | Web, Metrics | - |
| Loki | Web, Metrics | - |
| Promtail | Web, Metrics | tcp 1514 |
| node_exporter | Web, Metrics | - |
| cAdvisor | Web, Metrics | - |
| snmp_exporter | Web, Metrics | - |
| syslog-ng | - | udp 514, tcp 601 |
If you run this stack as a non-root user (for example on Linux), you can run into permission issues such as:
mkdir: can't create directory '/var/lib/grafana/plugins': Permission denied GF_PATHS_DATA='/var/lib/grafana' is not writable.
This will be evident when you run docker ps and see Grafana continuously restarting. You can have a look at its logs
via docker logs grafana
This is because Grafana expects specific users and groups to control the Grafana configuration directories:
uid=472(grafana) gid=0(root) groups=0(root)
You will have to do the following on your volume mounted to /var/lib/grafana:
chown -R 472:0 ./grafana/data
Another way to do this, as recommended in the Grafana documentation, is to jump onto the started container and change ownership of the relevant directories.
Jump onto the Grafana container with:
docker exec -it <CONTAINER ID> bash
Note: The <CONTAINER_ID> can be found by running docker ps --format="{{.ID}}\t{{.Names}}":
22c444431284 grafana
Then change the ownership of the relevant directories:
# in the container you just started:
chown -R root:root /etc/grafana && \
chmod -R a+r /etc/grafana && \
chown -R grafana:grafana /var/lib/grafana && \
chown -R grafana:grafana /usr/share/grafana
If you've already run docker-compose up on this repository, there will be some data files created that will persist your current state. If you want to start from a clean slate do the following:
docker-compose down- Delete the
grafana/data/grafana.dbfile (rm grafana/data/grafana.db)
Now you should be able to run up the stack again and start with the defaults:
docker-compose up -d --force-recreate

