iDisc: Internal Discretization for Monocular Depth Estimation,
Luigi Piccinelli, Christos Sakaridis, Fisher Yu, CVPR 2023 (to appear) Project Website (iDisc) Paper (arXiv 2304.06334)
For more, and not compressed, visual examples please visit vis.xyz.
If you find our work useful in your research please consider citing our publication:
    @inproceedings{piccinelli2023idisc,
      title={iDisc: Internal Discretization for Monocular Depth Estimation},
      author={Piccinelli, Luigi and Sakaridis, Christos and Yu, Fisher},
      booktitle = {IEEE Conference on Computer Vision and Pattern Recognition (CVPR)},
      year={2023}
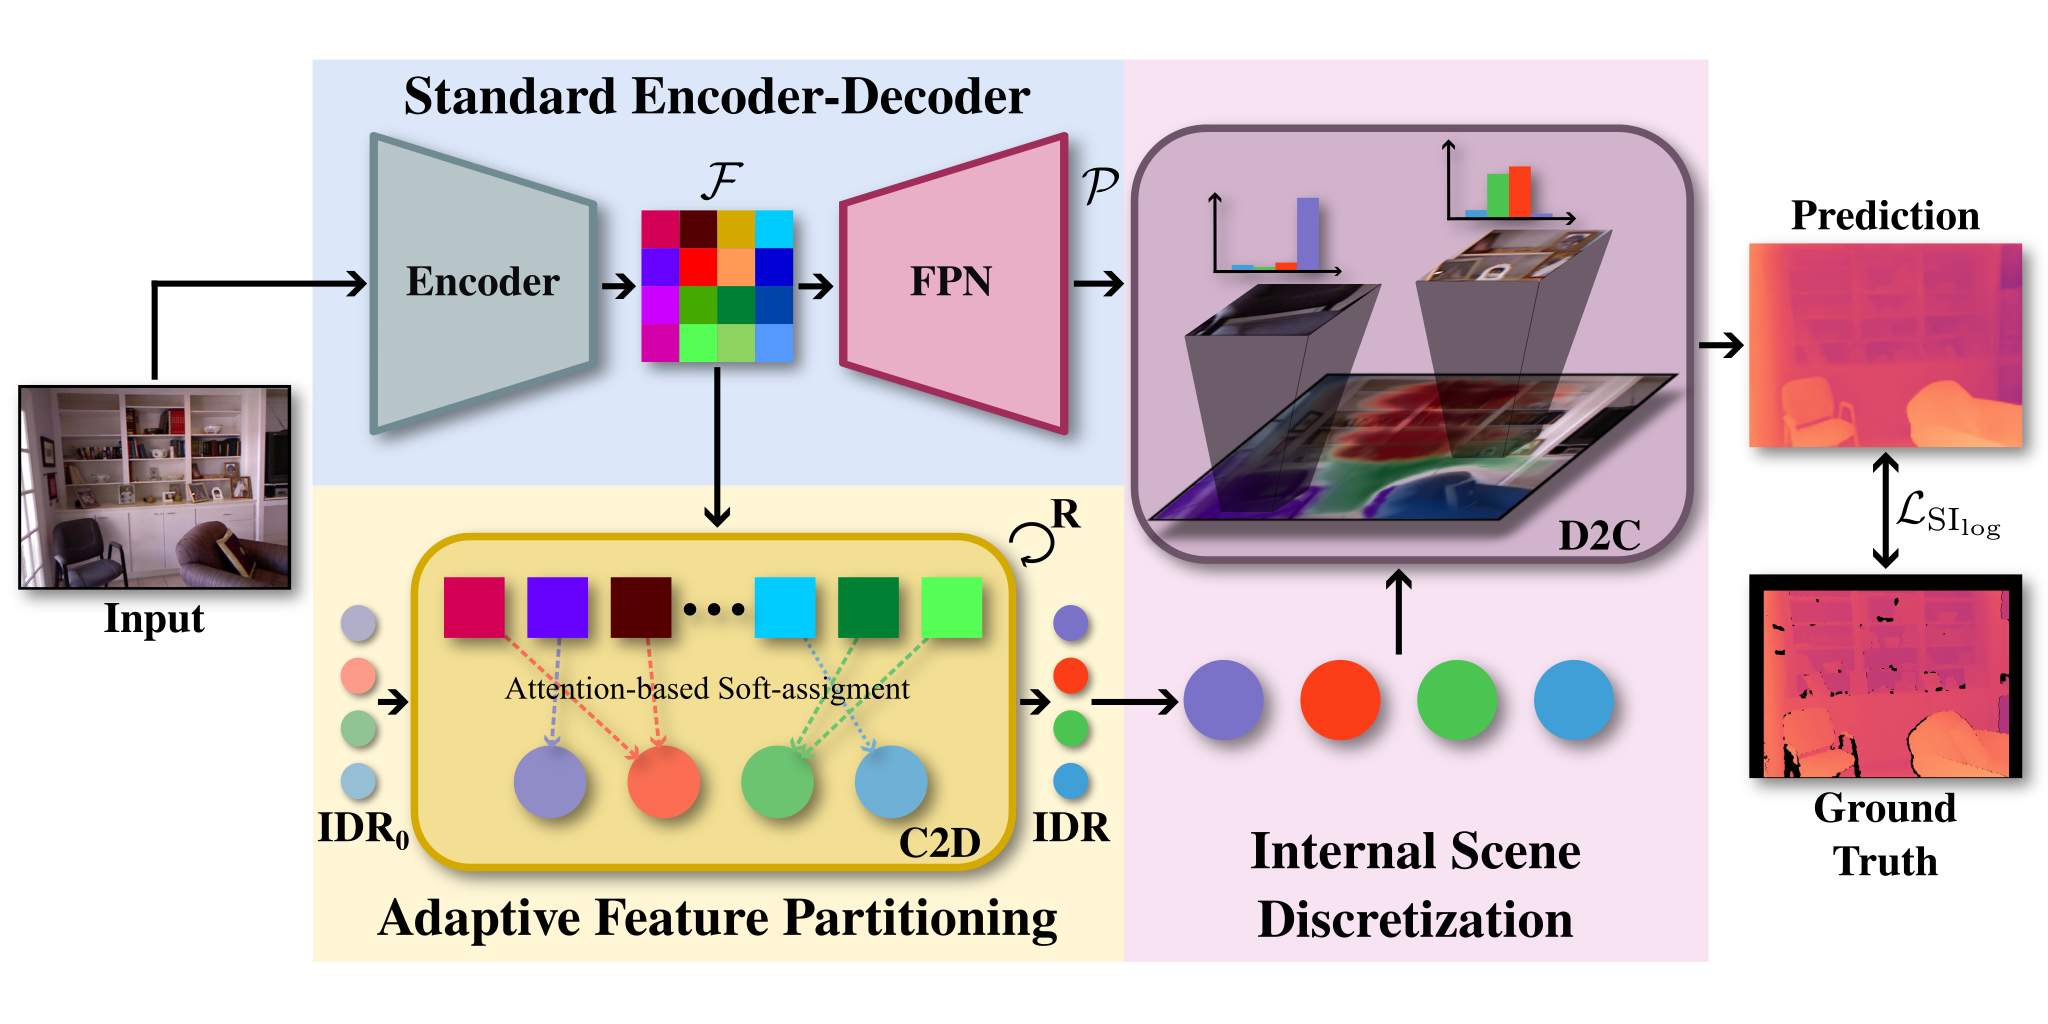
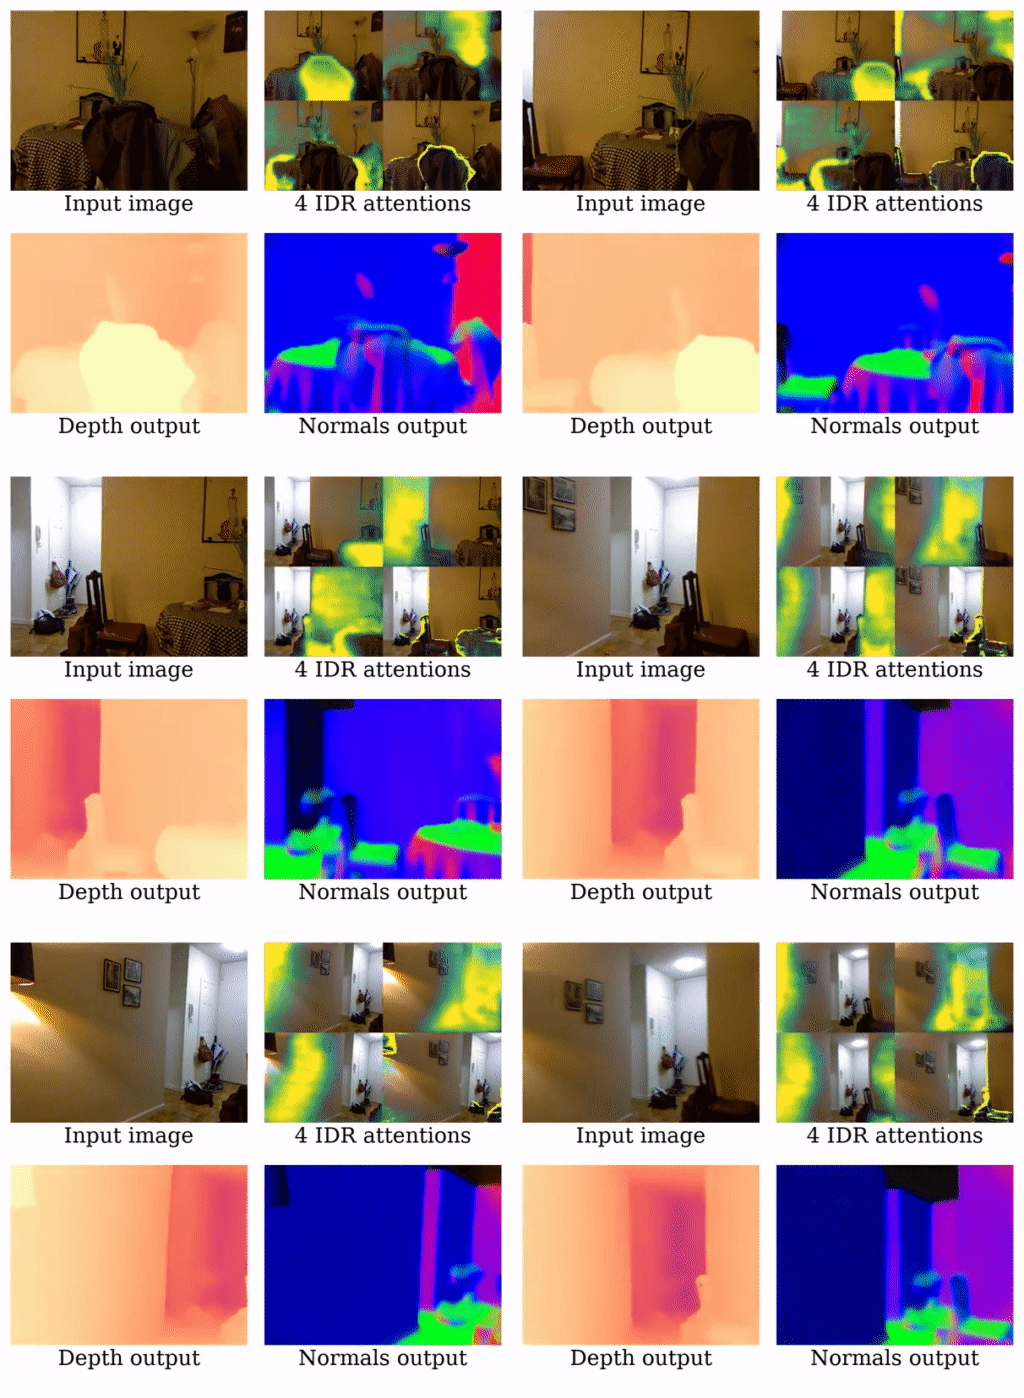
}Monocular depth estimation is fundamental for 3D scene understanding and downstream applications. However, even under the supervised setup, it is still challenging and ill posed due to the lack of geometric constraints. We observe that although a scene can consist of millions of pixels, there are much fewer high-level patterns. We propose iDisc to learn those patterns with internal discretized representations. The method implicitly partitions the scene into a set of high-level concepts. In particular, our new module, Internal Discretization (ID), implements a continuous-discrete-continuous bottleneck to learn those concepts without supervision. In contrast to state-of-the-art methods, the proposed model does not enforce any explicit constraints or priors on the depth output. The whole network with the ID module can be trained in an end-to-end fashion thanks to the bottleneck module based on attention. Our method sets the new state of the art with significant improvements on NYU-Depth v2 and KITTI, outperforming all published methods on the official KITTI benchmark. iDisc can also achieve state-of-the-art results on surface normal estimation. Further, we explore the model generalization capability via zero-shot testing. From there, we observe the compelling need to promote diversification in the outdoor scenario and we introduce splits of two autonomous driving datasets, DDAD and Argoverse
We release here model output predictions for reproducibility. Code and model weights will be released before CVPR conference (18th June 2023).
We store the output predictions in the same relative path as the depth path from the corresponding dataset. For evaluation we used micro averaging, while some other depth repos use macro averaging; the difference is in the order of decimals of percentage points, but we found it more appropriate for datasets with uneven density distributions, e.g. due to point cloud accumulation.
Please note that the depth map is rescaled as in the original dataset to be stored as .png file. In particular, to obtain metric depth, you need to divide NYUv2 results by 1000, and results for all other datasets by 256. Normals need to be rescaled from [0, 255] to [-1, 1].
Predictions are not interpolated, that is, the output dimensions are one quarter of the input dimensions. For evaluation we used bilinear interpolation with aligned corners.
| Backbone | d0.5 | d1 | d2 | RMSE | RMSE log | A.Rel | Sq.Rel | Predictions |
|---|---|---|---|---|---|---|---|---|
| Resnet101 | 0.860 | 0.965 | 0.996 | 2.362 | 0.090 | 0.059 | 0.197 | predictions |
| EfficientB5 | 0.852 | 0.963 | 0.994 | 2.510 | 0.094 | 0.063 | 0.223 | predictions |
| Swin-Tiny | 0.870 | 0.968 | 0.996 | 2.291 | 0.087 | 0.058 | 0.184 | predictions |
| Swin-Base | 0.885 | 0.974 | 0.997 | 2.149 | 0.081 | 0.054 | 0.159 | predictions |
| Swin-Large | 0.896 | 0.977 | 0.997 | 2.067 | 0.077 | 0.050 | 0.145 | predictions |
| Backbone | d1 | d2 | d3 | RMSE | A.Rel | Log10 | Predictions |
|---|---|---|---|---|---|---|---|
| Resnet101 | 0.892 | 0.983 | 0.995 | 0.380 | 0.109 | 0.046 | predictions |
| EfficientB5 | 0.903 | 0.986 | 0.997 | 0.369 | 0.104 | 0.044 | predictions |
| Swin-Tiny | 0.894 | 0.983 | 0.996 | 0.377 | 0.109 | 0.045 | predictions |
| Swin-Base | 0.926 | 0.989 | 0.997 | 0.327 | 0.091 | 0.039 | predictions |
| Swin-Large | 0.940 | 0.993 | 0.999 | 0.313 | 0.086 | 0.037 | predictions |
Results may differ (~0.1%) due to micro vs. macro averaging and bilinear vs. bicubic interpolation.
| Backbone | 11.5 | 22.5 | 30 | RMSE | Mean | Median | Predictions |
|---|---|---|---|---|---|---|---|
| Swin-Large | 0.637 | 0.796 | 0.855 | 22.9 | 14.6 | 7.3 | predictions |
| Backbone | d1 | d2 | d3 | RMSE | RMSE log | A.Rel | Sq.Rel | Predictions |
|---|---|---|---|---|---|---|---|---|
| Swin-Large | 0.809 | 0.934 | 0.971 | 8.989 | 0.221 | 0.163 | 1.85 | predictions |
| Backbone | d1 | d2 | d3 | RMSE | RMSE log | A.Rel | Sq.Rel | Predictions |
|---|---|---|---|---|---|---|---|---|
| Swin-Large | 0.821 | 0.923 | 0.960 | 7.567 | 0.243 | 0.163 | 2.22 | predictions |
| Train Dataset | Test Dataset | d1 | RMSE | A.Rel |
|---|---|---|---|---|
| NYUv2 | SUN-RGBD | 0.838 | 0.387 | 0.128 |
| NYUv2 | Diode | 0.810 | 0.721 | 0.156 |
| KITTI | Argoverse | 0.560 | 12.18 | 0.269 |
| KITTI | DDAD | 0.350 | 14.26 | 0.367 |
This work is funded by Toyota Motor Europe via the research project TRACE-Zurich (Toyota Research on Automated Cars Europe).


