WHO Immunization Report
Visualization prototypes for the 2016 immunization report, released in 2017. These prototypes were created for WHO by Stamen Design.
Dorling Cartogram

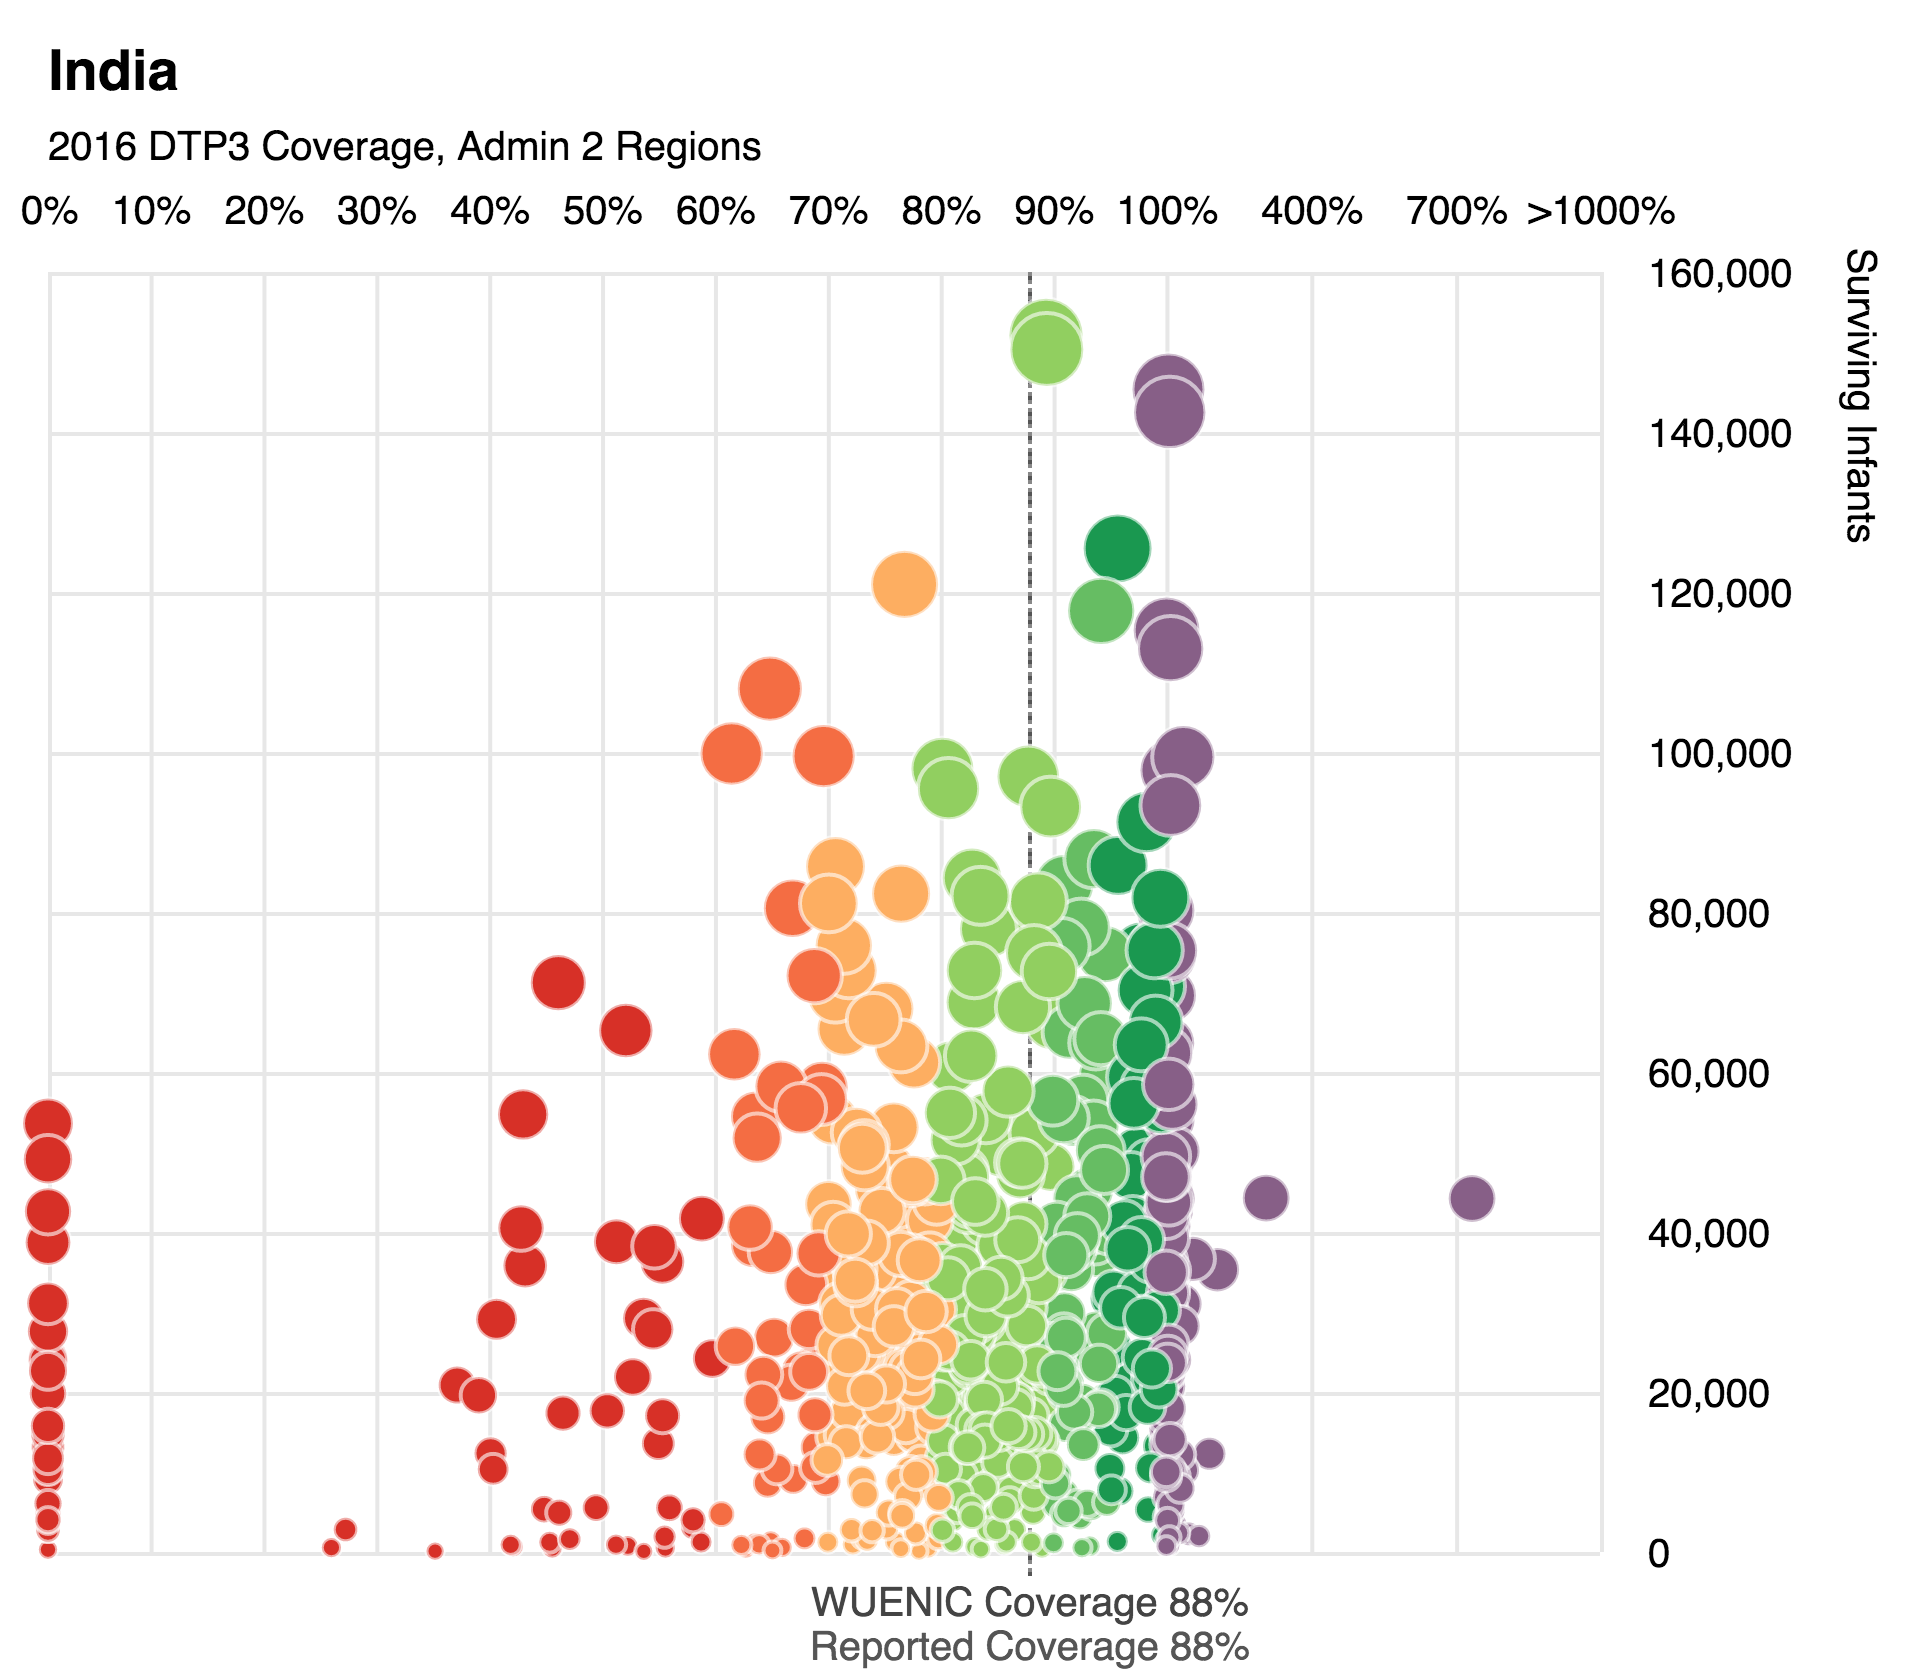
Subnational Bubbleplot
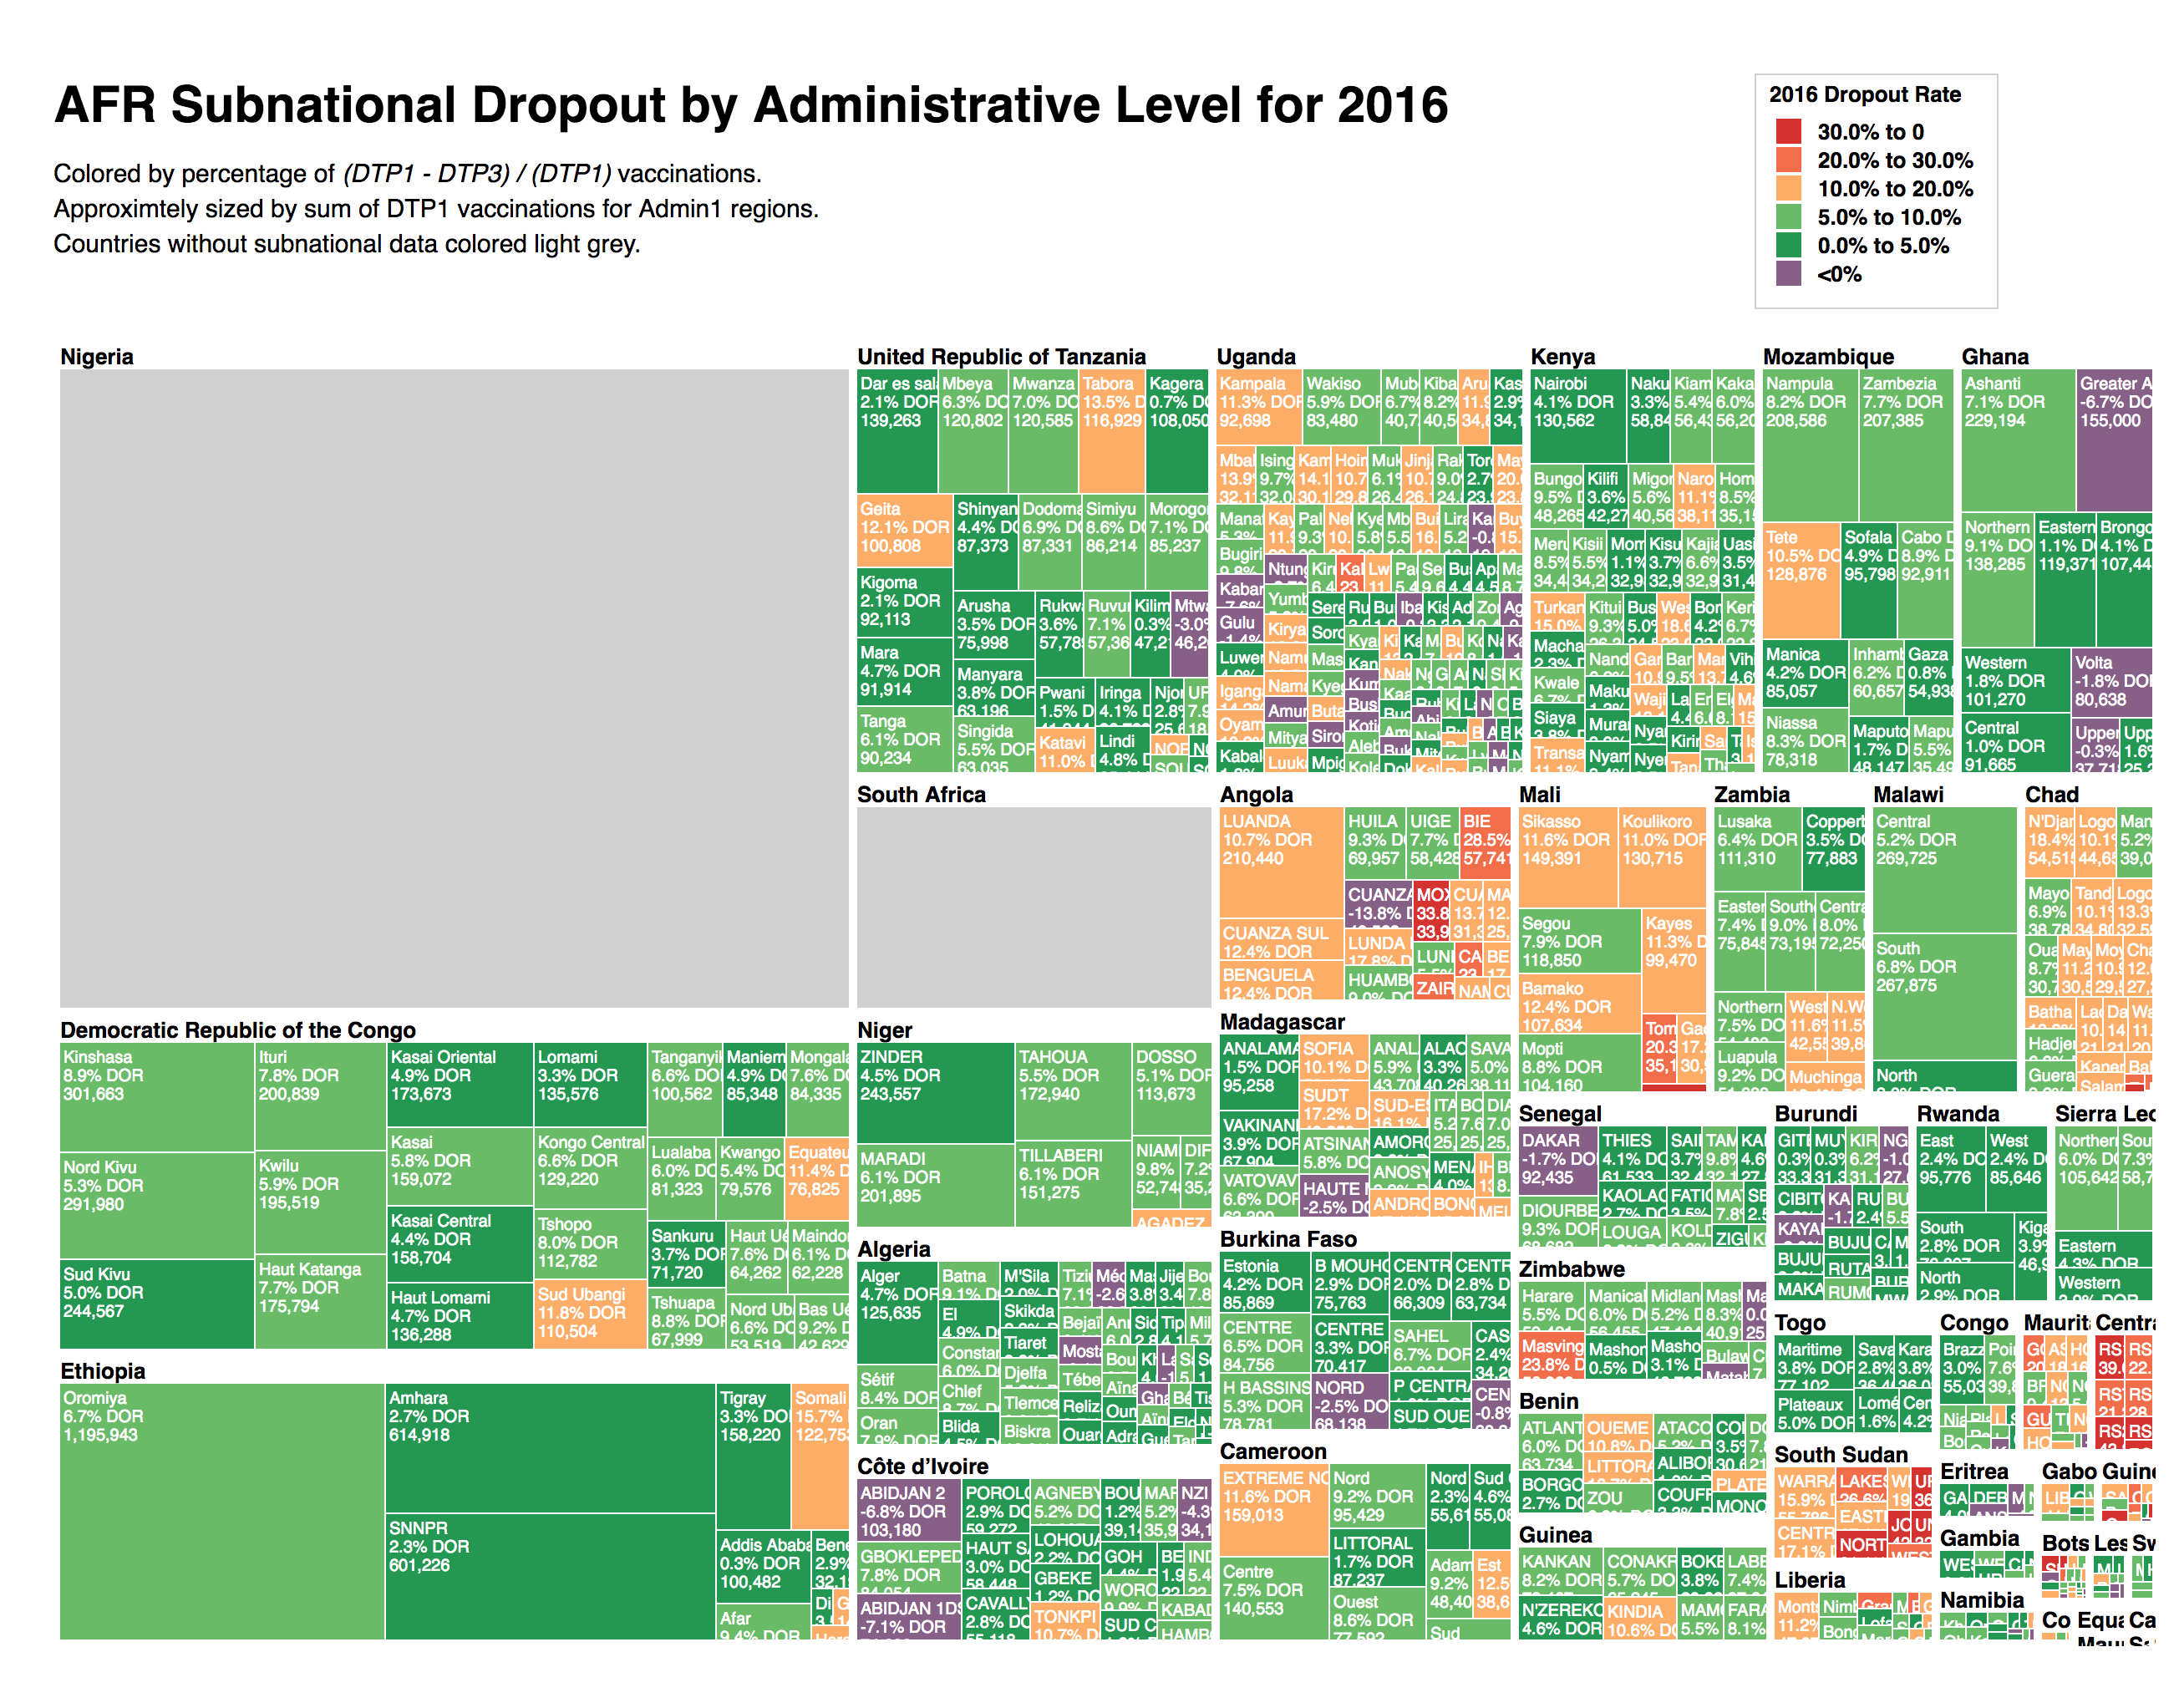
Dropout Rate Treemap
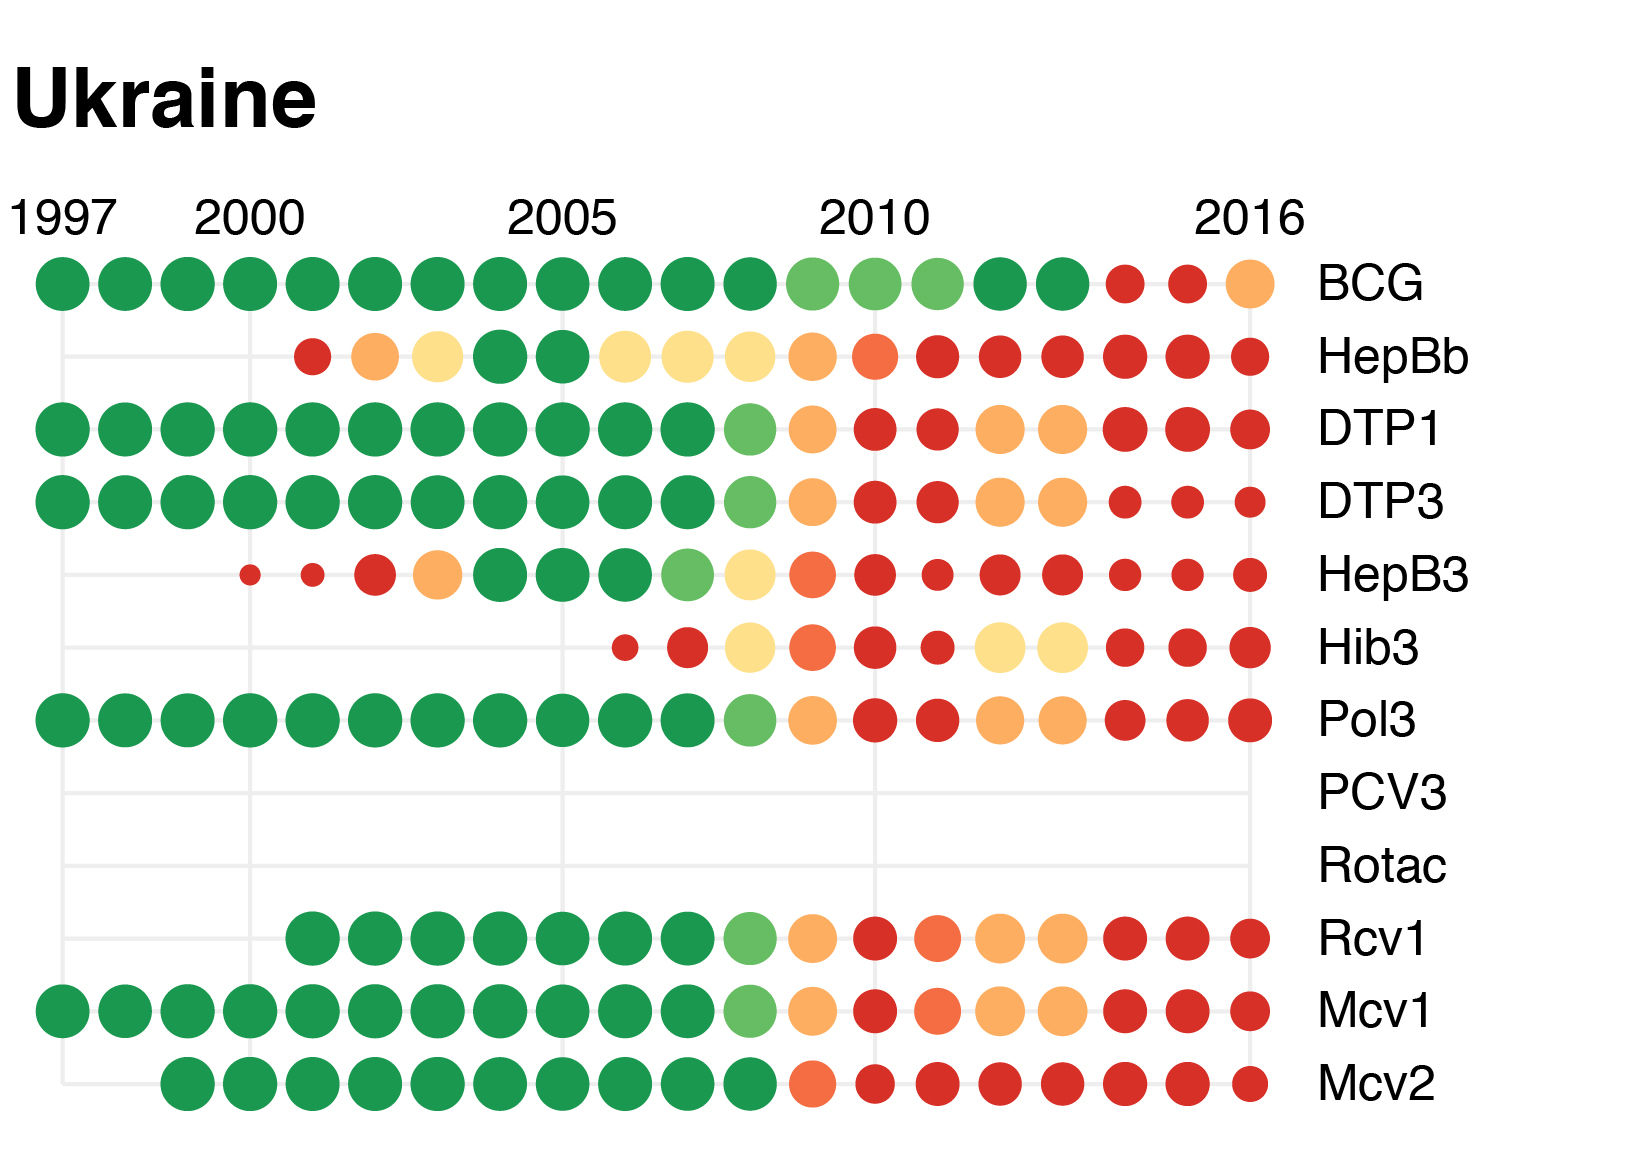
Immunization Punchcard
Running the Examples
Download this repository and put the entire directory onto a webserver to run the examples. This is required to load external data files.
For example, On a MacOS computer, navigate to the directory with Terminal and run this command:
python -m SimpleHTTPServer 8010
The examples can now be viewed in a web browser on the same machine at http://localhost:8010/
Swapping out data files
Sample data files are contained in the data/ directory. Immunization data is imported as files.
Geographic data is imported as TopoJSON. To convert shapefiles to TopoJSON format, tools like mapshaper can be used.
To swap out data files for an example, look for calls to d3.csv or d3.json in the example and update the filename. For instance, the national WEUNIC data is loaded in one bubbleplot example here:
d3.csv('../data/wuenic_master_07_06_2017.csv', function(error, wuenic_raw) {
Downloading PNG exports
For the punchcard and subnational bubbleplots at the country level, PNG images of each country can be downloaded. Run the following command in a JavaScript console while viewing the web page after the graphs have finished rendering:
     .each(function(d,i) {
       var self = this;
       var f = function() {
         self.click()
       }
       setTimeout(f, 120*i);
     })
Your browser will attempt to download several hundred images over the next 15-45 seconds. A prompt may appear to let the web page download many images. If this happens, it may interrupt the download of some countries. Run the command again after dismissing the prompt to download all the country PNGs.
If you're running the examples with the command at the top of the README, you can test this download script with this bubbleplot example.