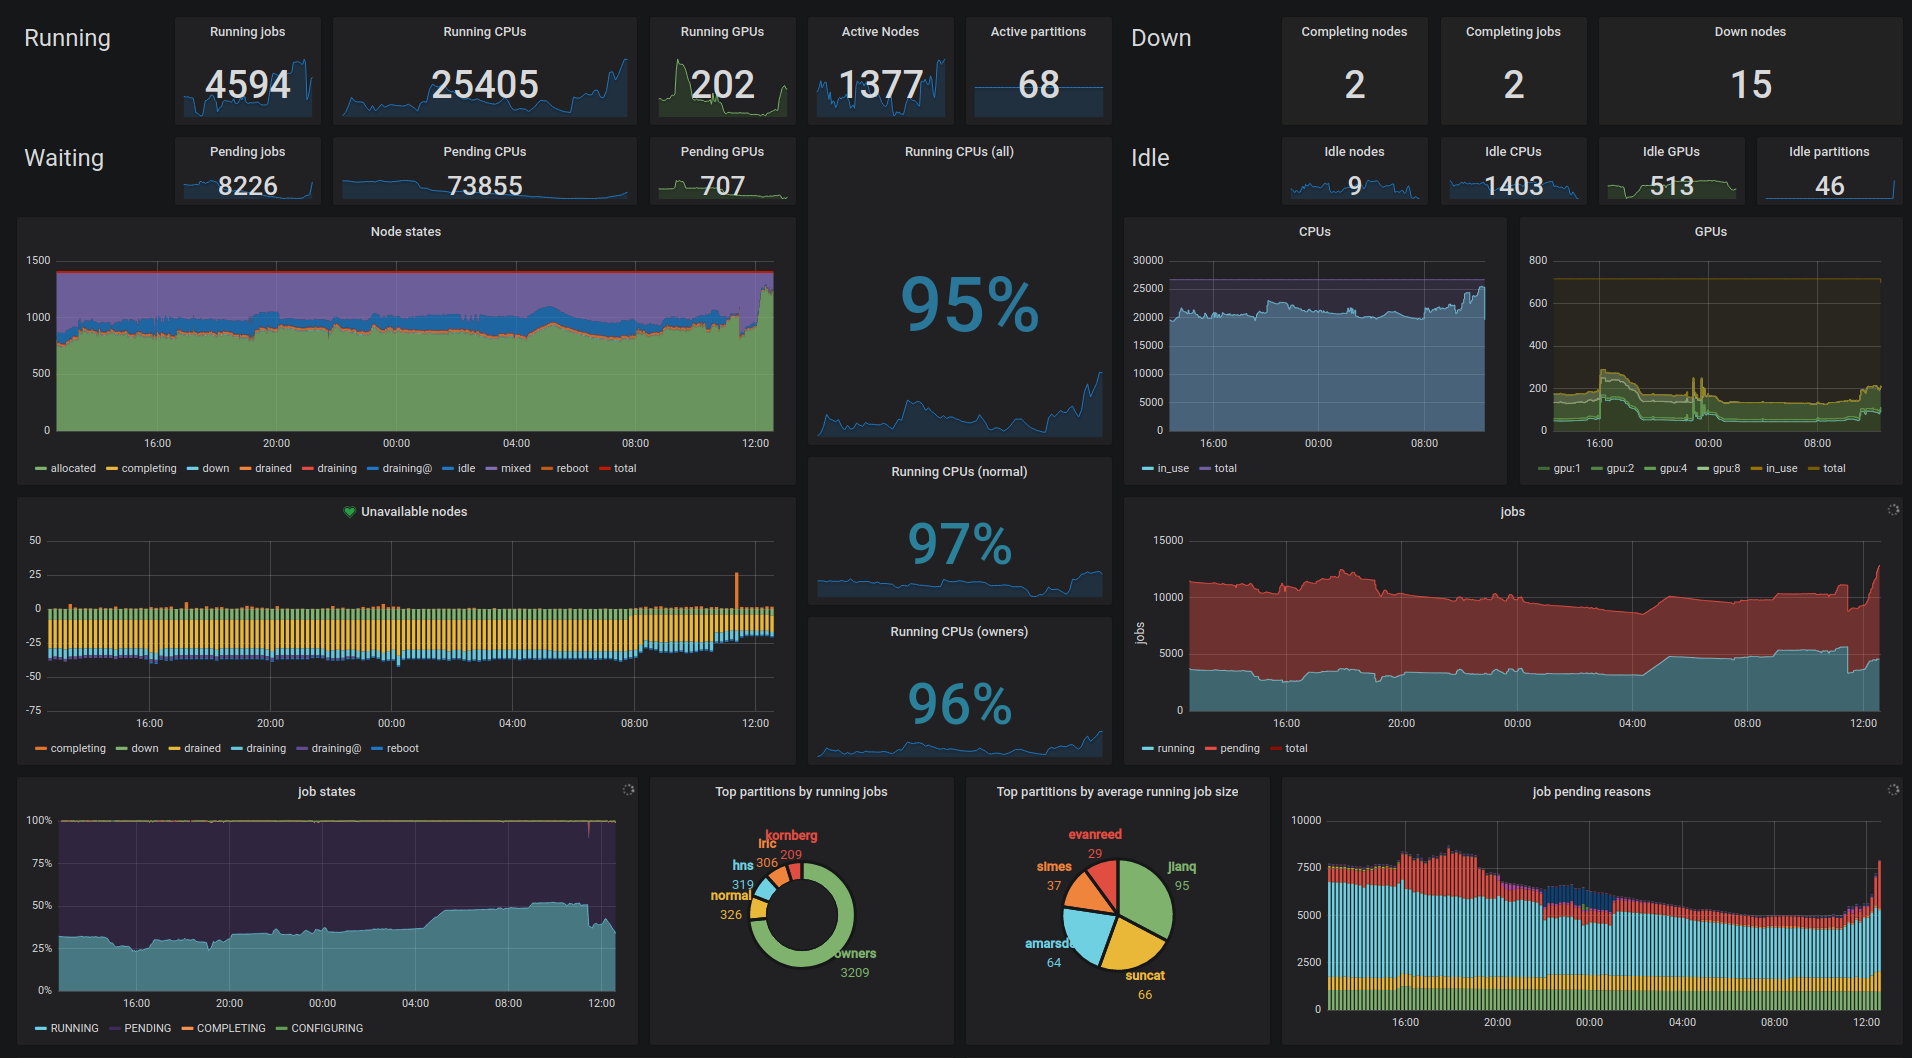
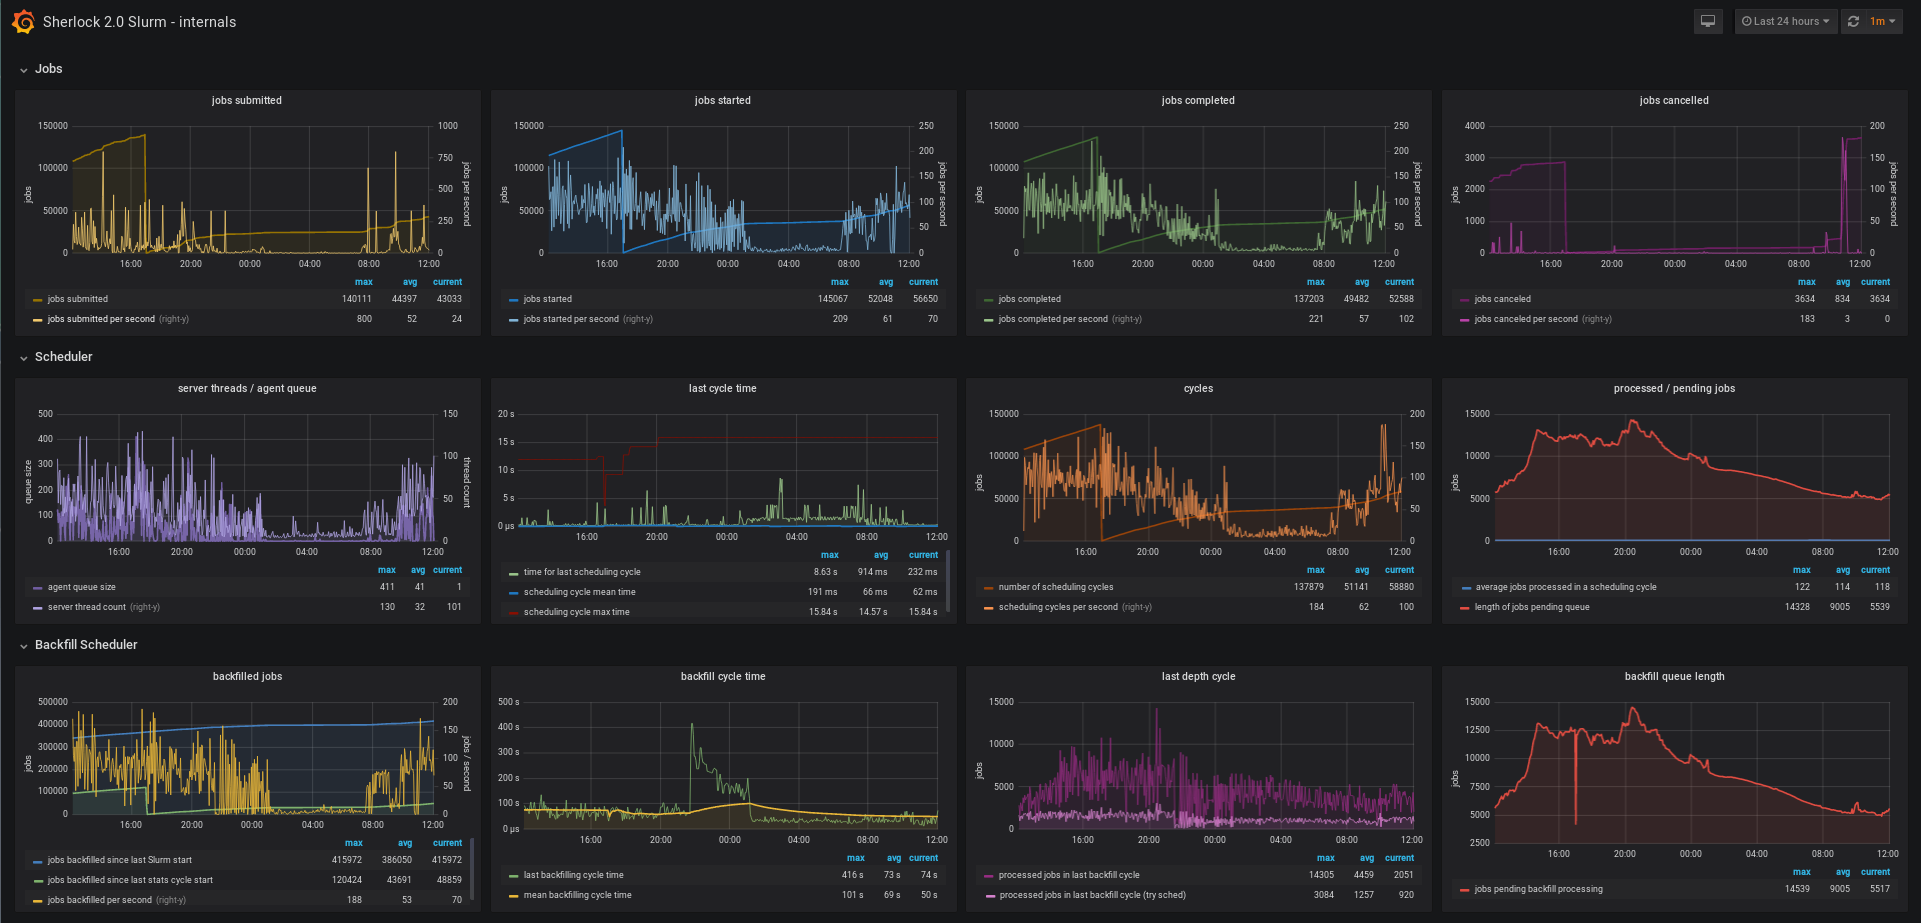
This repository contains a few examples of the HPC monitoring dashboards developed at SRCC.
IMPORTANT: those are just raw scripts and examples that cannot be used as-is. They're meant as a way to provide some inspiration and examples, but are absolutely not a ready-to-use solution.
The data collection scripts and dashboards in this repository have been developed in the following context:
-
data collection scripts run on a regular schedule (through
cron, for instance). -
they collect metrics from a given subsystem and format them in Graphite's plaintext data protocol:
<metric path> <metric value> <metric timestamp> -
the data is then sent to Graphite with something as sophisticated as:
./script | nc http://$GRAPHITE_HOST $GRAPHITE_PORT -
a Grafana instance gets data from the Graphite server, and displays the dashboards.
Data collection scripts can be written in any language (we love Bash and Python), but there's really no constraint on what language can be used, as long as it can output strings on the console.
Dashboards are provided here in JSON format and can be imported into Grafana
The sched/slurm directory contains:
- the data collection script (
slurm.py) that will callsqueue,sinfo,sdiag...) to gather the scheduler information, - the
slurm_overview.jsonandslurm_internals.jsondashboards that can be directly imported into Grafana.

