A repo for a function I posted as part of my answer to a quesiton about peak detection on StackExchange.
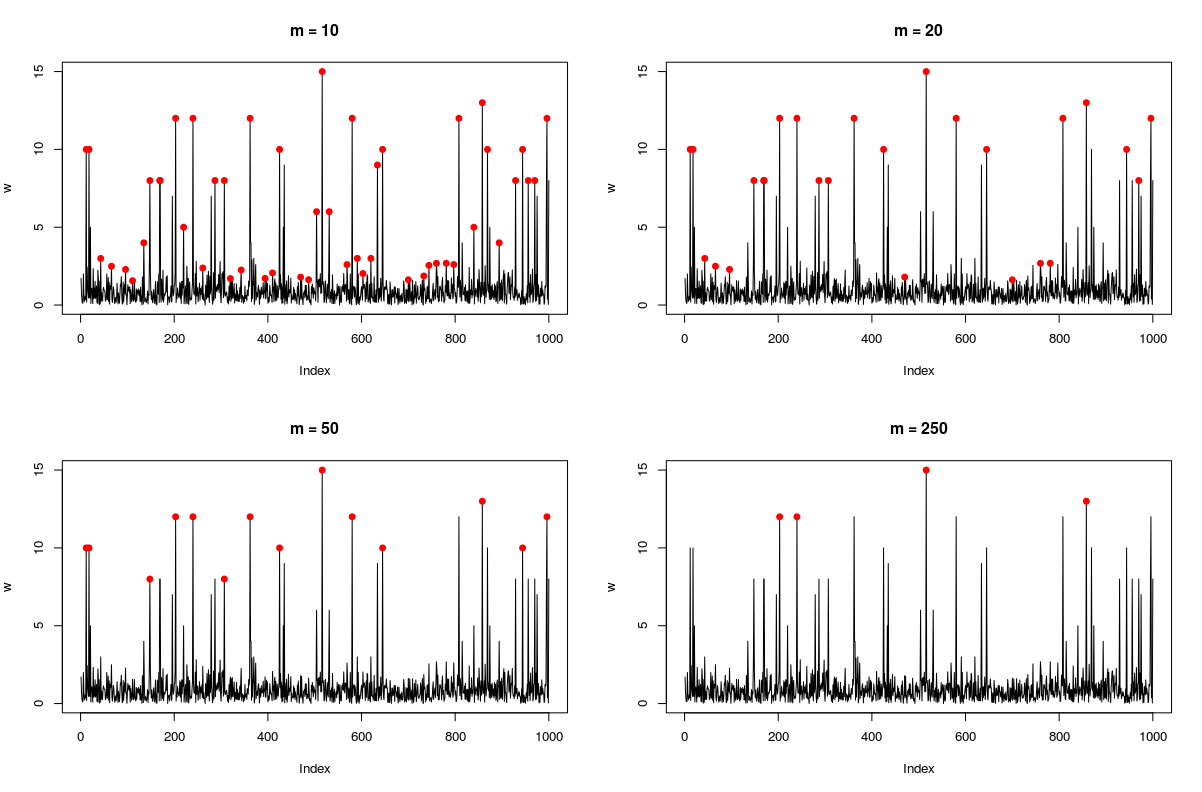
The function takes an ordered sequence (vector) of values x and a number m and returns a vector of indices of local peaks in x. A (local) peak is defined as a point such that m points either side of it has a lower or equal value to it. Thus, m can be used adjust the sensitivity of the peak detection procedure: larger m will result in fewer peaks, whilst smaller values of m will result in more peaks found.
set.seed(321)
w <- abs(rnorm(1000))
w[sample(1 : 1000, 25)] <- rpois(25, 5) #adding small random peaks
w[sample(1 : 1000, 25)] <- rpois(25, 10) #adding big random peaks

par(mfrow = c(2, 2))
for(k in c(10, 20, 50, 250)){
	p <- find_peaks(w, m = k)
	plot(w, type = 'l', main = paste0('m = ', k))
	points(p, w[p], col = 'red', pch = 19)
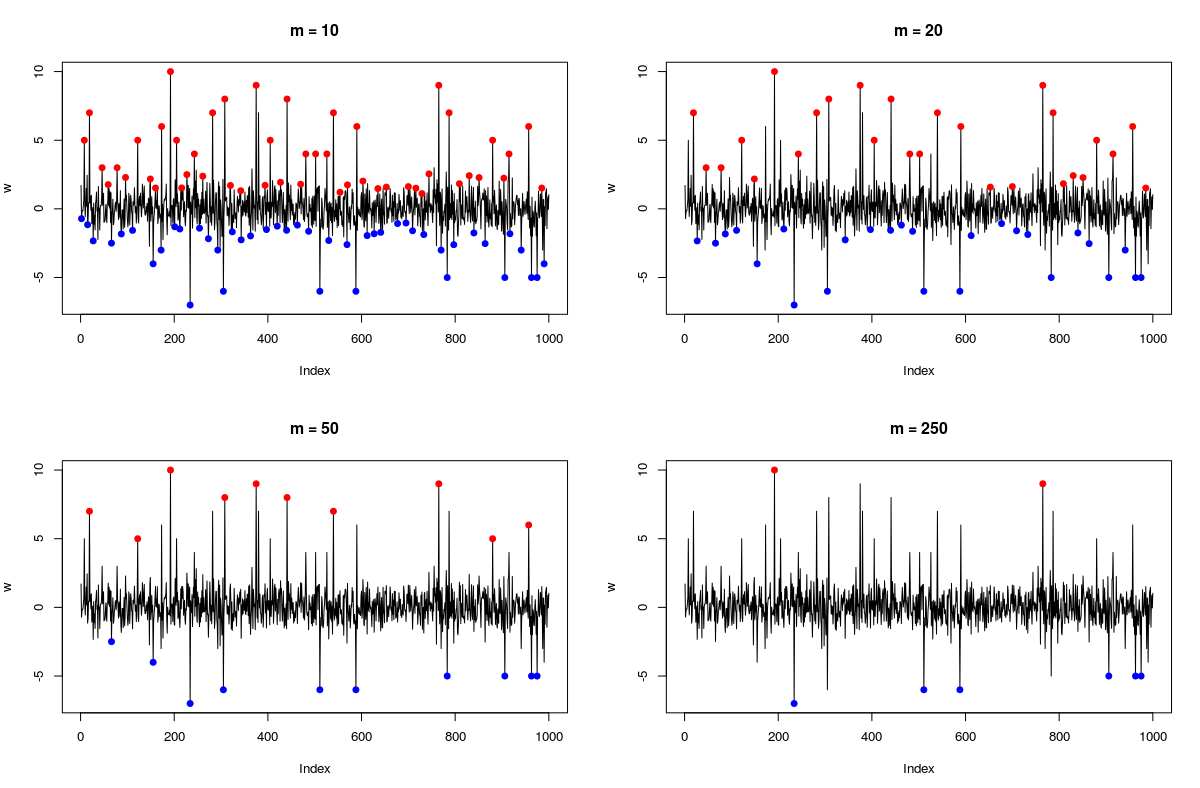
}To fnd local minima of a sequence x apply the functions to -x (as the peaks of the negative of the sequence are precisely valleys of the original sequence).
set.seed(321)
w <- rnorm(1000)
w[sample(1 : 1000, 25)] <- ifelse(runif(25) > 0.5, 1, -1) * rpois(25, 5) #adding small random peaks/valleys (roughly 50/50)
w[sample(1 : 1000, 25)] <- ifelse(runif(25) > 0.5, 1, -1) * rpois(25, 5) #adding big random peaks/valleys (roughly 50/50)

par(mfrow = c(2, 2))
for(k in c(10, 20, 50, 250)){
	p1 <- find_peaks(w, m = k) #finding peaks
	p2 <- find_peaks(-w, m = k) #finding valleys
	p <- c(p1, p2) #combining the two
	plot(w, type = 'l', main = paste0('m = ', k))
	points(p, w[p], col = c(rep('red', length(p1)), rep('blue', length(p2))), pch = 19)
}
