With speakr, you can run Praat scripts in R and capture their infoLine
output.
You can install the released version of speakr from CRAN with:
install.packages("speakr")If you want to install a stable(ish) development version, use:
remotes::install_github("stefanocoretta/speakr@devel", build_vignettes = TRUE)For a quick start, check out the vignette with:
vignette("run-praat", "speakr")On macOS, Linux and Windows, the path to praat is set automatically to
the default installation path. If you have installed Praat in a
different location, or if your operating system is not supported, you
can set the path to Praat with options(speakr.praat.path).
For example:
options(speakr.praat.path = "./custom/praat.exe")You can either run this command every time you start a new R session, or
you can add the command to your .Rprofile (recommended).
Use prat_run() to run a Praat script, and capture = TRUE to capture
the output of the write/appendInfoLine commands in the script.
Everything is set in the Praat script as usual, so you don’t have to
learn a new language to perform tasks you already know how to perform.
script <- system.file("extdata", "get-formants-args.praat", package = "speakr")

formants <- praat_run(script, "Hertz", 0.03, capture = TRUE) %>%
  read_csv()
#> Rows: 5 Columns: 4
#> ── Column specification ────────────────────────────────────────────────────────
#> Delimiter: ","
#> chr (1): vowel
#> dbl (3): F1, F2, F3
#>
#> ℹ Use `spec()` to retrieve the full column specification for this data.
#> ℹ Specify the column types or set `show_col_types = FALSE` to quiet this message.
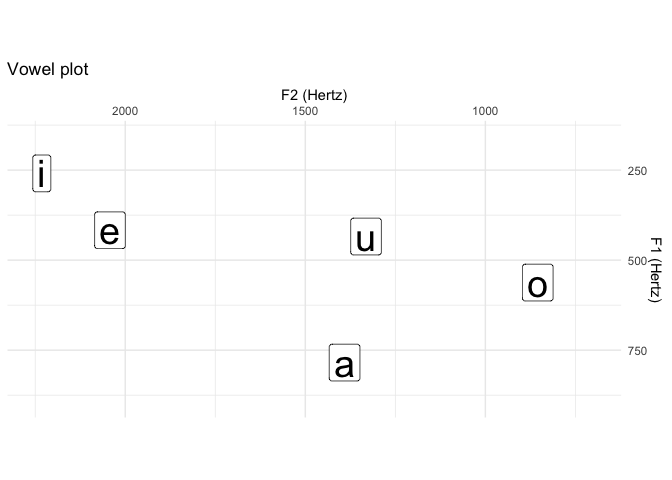
Let’s check the tibble formants.
formants
#> # A tibble: 5 × 4
#>   vowel    F1    F2    F3
#>   <chr> <dbl> <dbl> <dbl>
#> 1 a      784. 1391. 2433.
#> 2 e      417. 2042. 2424.
#> 3 i      259. 2232. 2819.
#> 4 o      562.  855. 2463.
#> 5 u      434. 1331. 2816.
And let’s make a vowel plot.
formants %>%
  ggplot(aes(F2, F1, label = vowel)) +
  geom_label(size = 10) +
  labs(
    title = "Vowel plot",
    x = "F2 (Hertz)",
    y = "F1 (Hertz)"
  ) +
  scale_x_reverse(position = "top", limits = c(2250, 700)) +
  scale_y_reverse(position = "right", limits = c(900, 150)) +
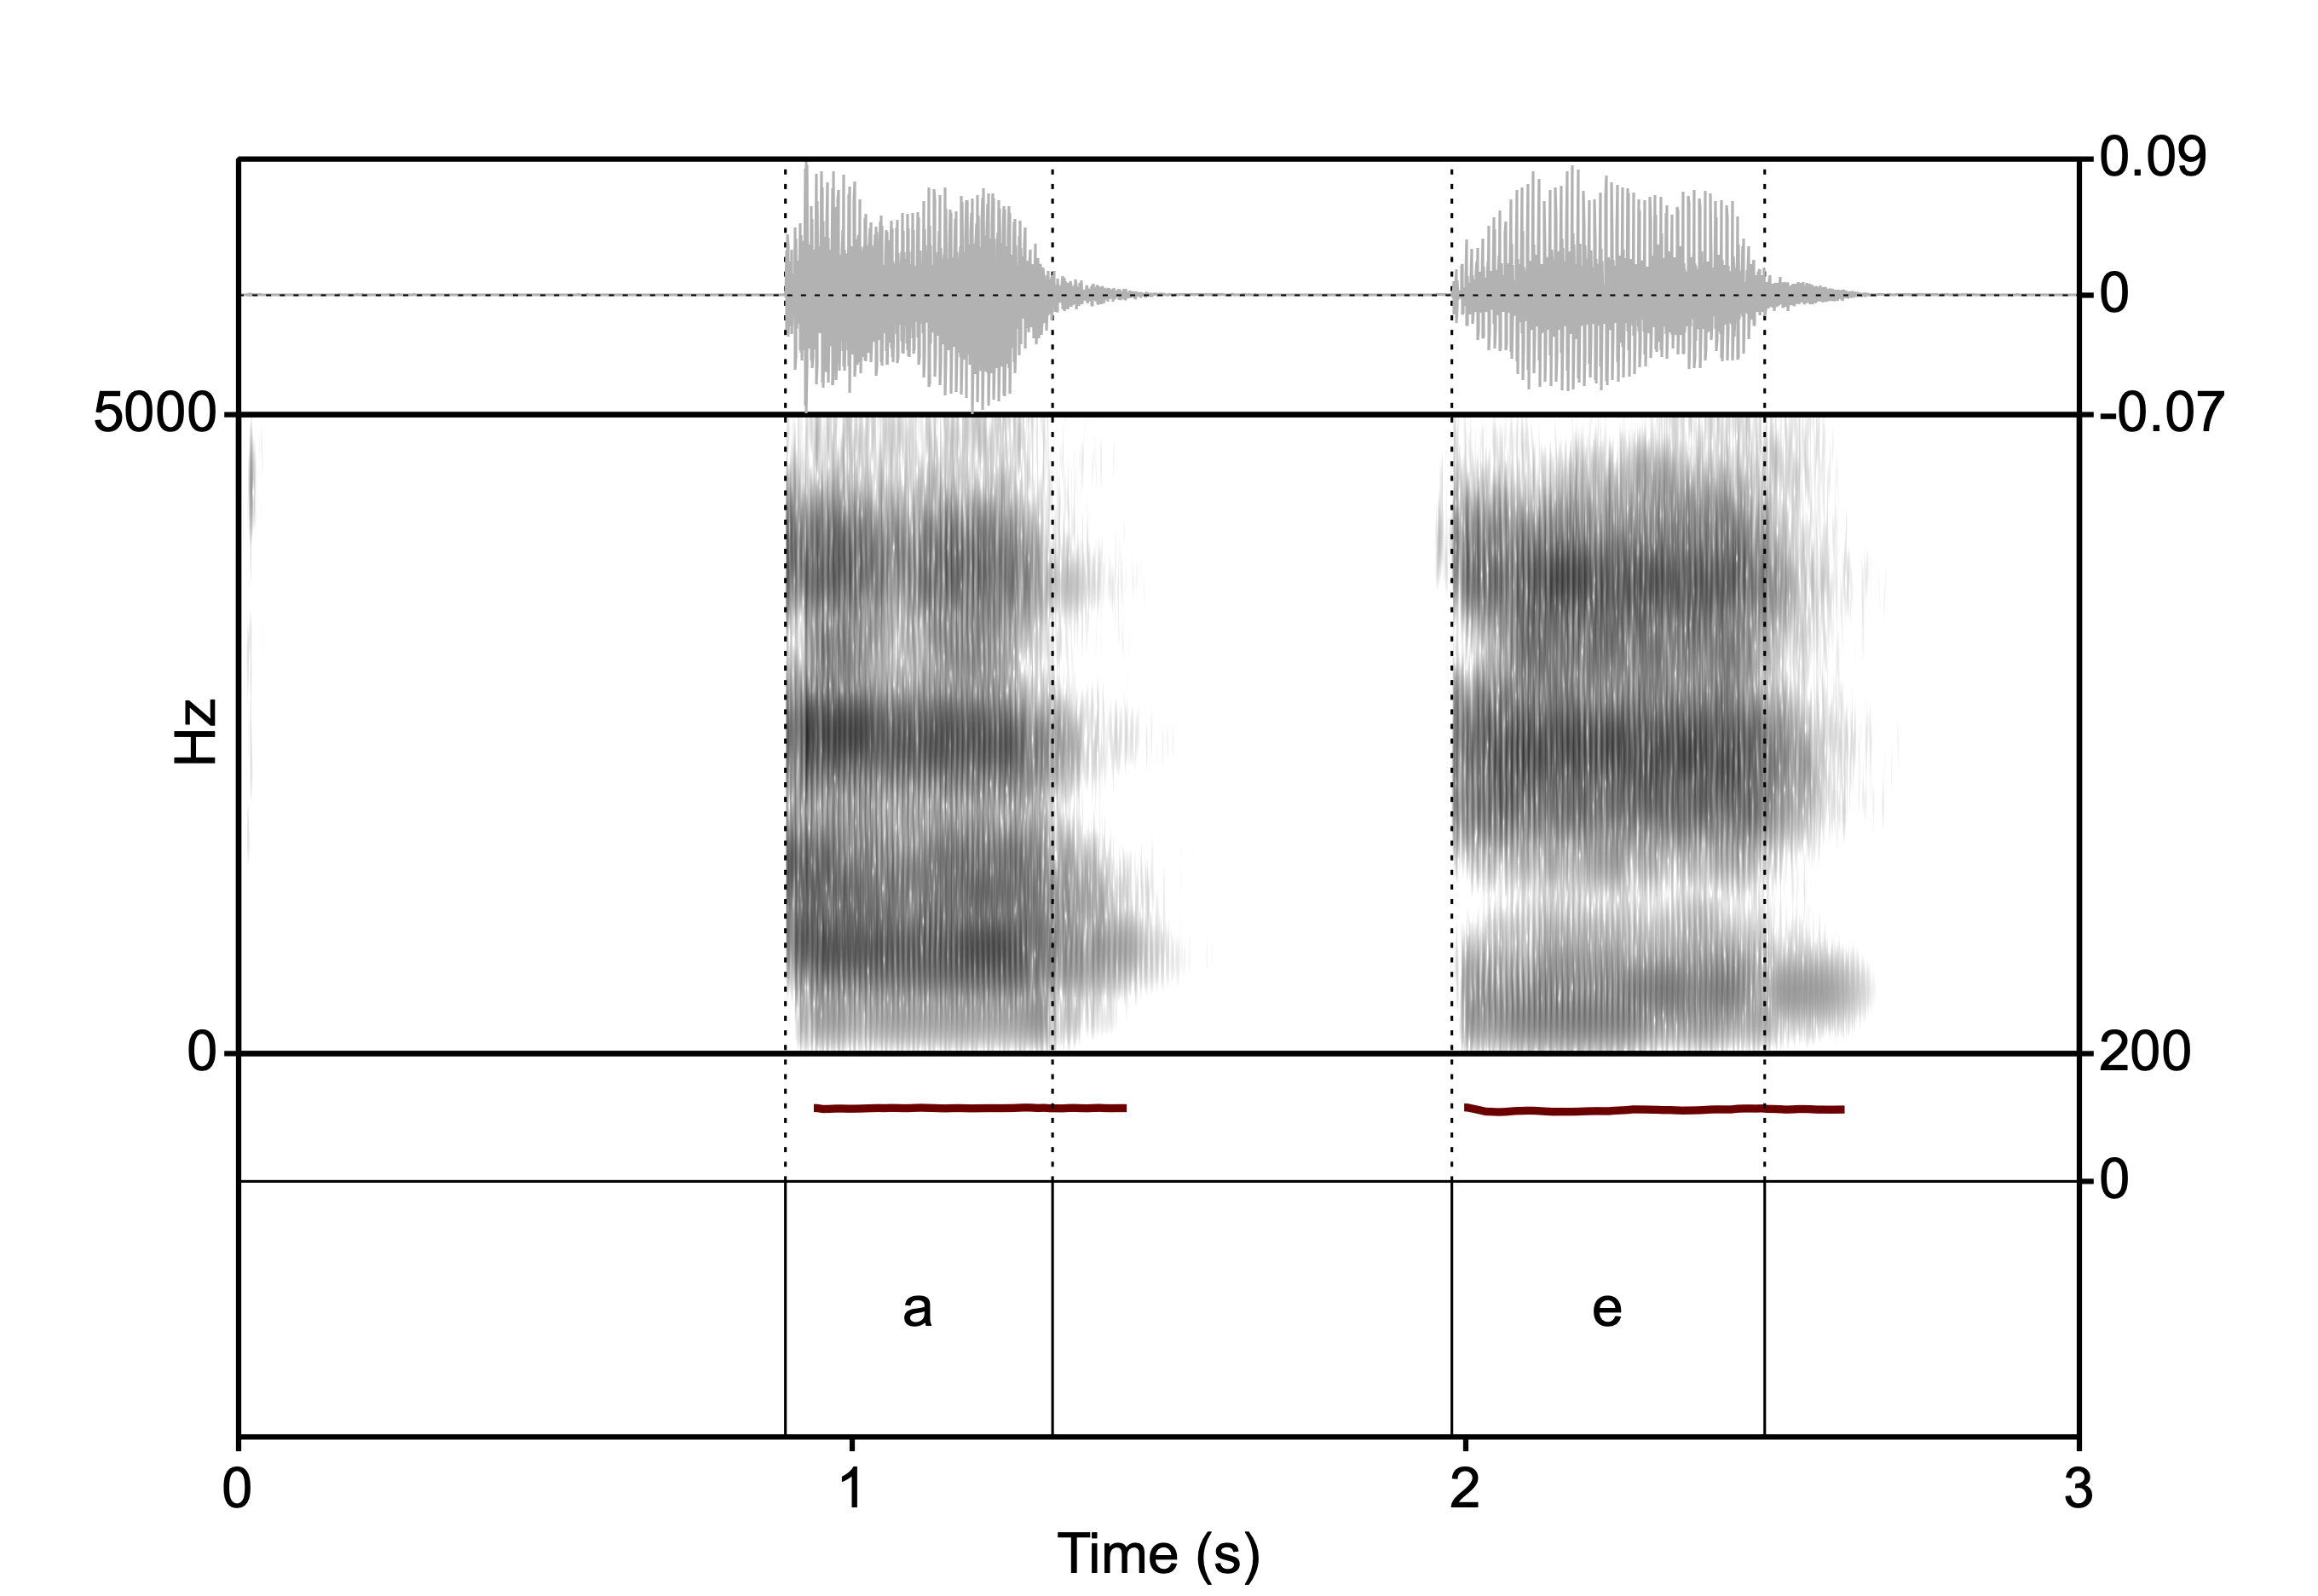
coord_fixed()You can plot a sound file and TextGrid using Praat’s plotting facilities.
wav <- system.file("extdata", "vowels.wav", package = "speakr")

praat_plot("vowels.png", wav, f0 = T, f0_max = 200, end = 3)
You can include the plot in an Rmarkdown file with knitr.
knitr::include_graphics("man/figures/vowels.png")


