IMPORTANT - June, 2021: This tool is still under development and not yet intended for use!!
FireDanger is a Python package intended to simpify the process of analysing forest fire (and drought) in time series and gridded weather and climate datasets. It is built on top of xarray. It contains implementations of several popular fire danger and drought indices calculated from meteorological parameters:
- Canadian Fire Weather Index System (FWI) including all its 6 components
Coming up next:
- Angström Index
- Baumgartner Index
- Nesterov index
- Munger Drought index
- Fuel Moisture Index
- Fosberg Fire Weather Index
- Keetch-Byram Drought Index
- McArthur Mark 5 Forest Fire Danger Index
The package is developed as part of the project "Waldbrandmanagement auf der Alpennordseite" by the University of Bern. A big "thank you" to the Swiss federal institute of forest, snow and landscape research WSL for providing a public WIKI with reference information on the mostly used fire weather indices.
Be aware that this is a free scientific tool in continous development, then it may not be free of bugs. Please report any issue on the GitHub portal.
Make sure you have the required dependencies (for details see docs/environment.yml):
- xarray
- pandas
- numpy
- netCDF4
- numba
- (for plotting on geographical maps: matplotlib and cartopy)
- (for parallel computing: dask)
To install the development version (master), do:
pip install git+https://github.com/steidani/firedanger.gitCopy/clone locally the latest version from FireDanger:
git clone git@github.com:steidani/firedanger.git /path/to/local/firedanger
cd path/to/local/firedanger
Prepare the conda environment:
conda create -y -q -n firedanger_dev python=3.8.5 pytest
conda env update -q -f environment.yml -n firedanger_dev
Install firedanger in development mode in firedanger_dev:
conda activate firedanger_dev
pip install -e .
Run the tests:
python -m pytestExample for time series (csv):
# import firedanger module
from firedanger import firedanger

# initiate instance and
# read time series (measurement) from weather station
# measurements are taken daily at 12 noon from 19910501 to 19911130.
# name of time dimension/column is 'time' with format 'YYYYMMDD'
fire = firedanger('data/measurement.csv', time_name = "time", time_format='%Y%m%d')
print(fire)
# Out[]:     Xarray dataset with 214 time steps.
#            Available fields: index, stn, T12, P12, H12, U12

# no preprocessing needed: data is already measured at 12 noon

# calculate Canadian Forest Fire Weather Indices
fire.calc_canadian_fwi(temp="T12", precip="P12", hum="H12", wind="U12")
print(fire)
# Out[]:     Xarray dataset with 214 time steps.
#            Available fields: index, stn, T12, P12, H12, U12, ffmc, dmc, dc, isi, bui, fwi

# save to disk as csv
fire.to_dataframe().to_csv("data/measurement_fire.csv", date_format='%Y%m%d')

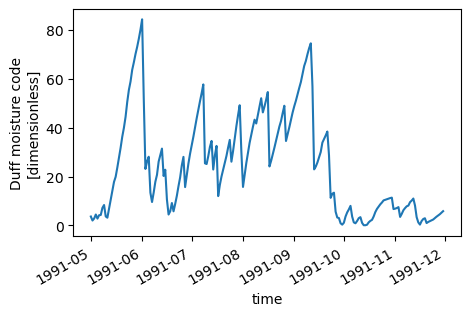
# plot temporal evolution of Duff Moisutre Code
import matplotlib.pyplot as plt
fire.dmc.plot()
plt.show()
Example for gridded weather data (netcdf):
# import firedanger module
from firedanger import firedanger

# initiate instance and
# read gridded COSMO-1 analysis hourly data from 20180801_00 to 20180814_03 with 0.01° (~1 km) spatial resolution)
fire = firedanger('data/cosmo-1_ana.nc')
print(fire)
# Out[]:     Xarray dataset with 316 time steps.
#            Available fields: TOT_PREC, T_2M, U_10M, V_10M, RELHUM_2M

# preprocessing: select only time at 12 noon
fire.ds = fire.ds.sel(time=datetime.time(12))
# xarray.Dataset (and all its functions) can be accessed with fire.ds

# preprocessing: calculate wind speed
fire.calc_windspeed(u="U_10M", v="V_10M")
# creates new variable "wind"

# Hint: Use fire.set_up(...) to do consistency check and set (automatically or manually) names of dimension ('time', 'latitude', 'longitude')

# calculate Canadian Forest Fire Weather Indices
fire.calc_canadian_fwi(temp="T_2M", precip="TOT_PREC", hum="RELHUM_2M", wind="wind")
print(fire)
# Out[]:     Xarray dataset with 13 time steps.
#            Available fields: TOT_PREC, T_2M, U_10M, V_10M, RELHUM_2M, wind, ffmc, dmc, dc, isi, bui, fwi

# save to disk as netcdf
fire.to_netcdf('data/cosmo-1_daily_fire.nc')

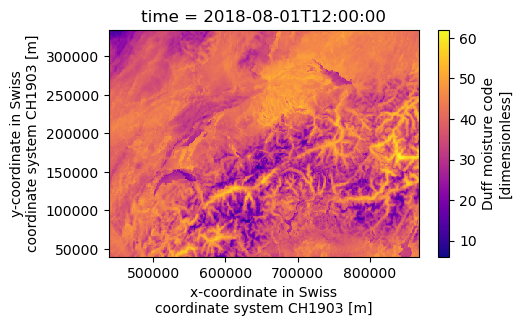
# plot Duff Moisture Code at one timestep
import matplotlib.pyplot as plt
fire.dmc[0].plot(cmap="plasma")
plt.show()
