Train of Thought, or Data Collective Ideation, or Ideation Graph, or RELATE

Maak video opname waarin je met stem&cursor browsertabs uitlegt:

INSPIRATIE:
- vrijheid fysiek whiteboard,
    later uitwerken foto blijkt lastig,
    men blijkt iets anders te bedoelen.
    Vaak nodes&edges & text snippets.
- mindmap software slows down your train of thought
    and results in a bag of pixels,
    not a queryable network of data
- metadateren is als administratief huiswerk
    dat je eeuwig uitstelt
    en te laat/weinig voordeel uithaalt.
    Maak het bizar snel&makkelijk
    en laat het direct waarde opleveren.
    Wat is eerder dan brainstormfase?
- We often keep switching
    between a search context and a creation context.
    Can we combine them?
- Lots of FAIR data things are
    implemented with Linked data technology.
    Linked data is very powerful,
    if you're into long arcane syntaxes,
    mostly applied to big data sources,
    while many small ones can be valuable too.

So I came up with something else:

show the GUI ()
Reasoning behind the idea
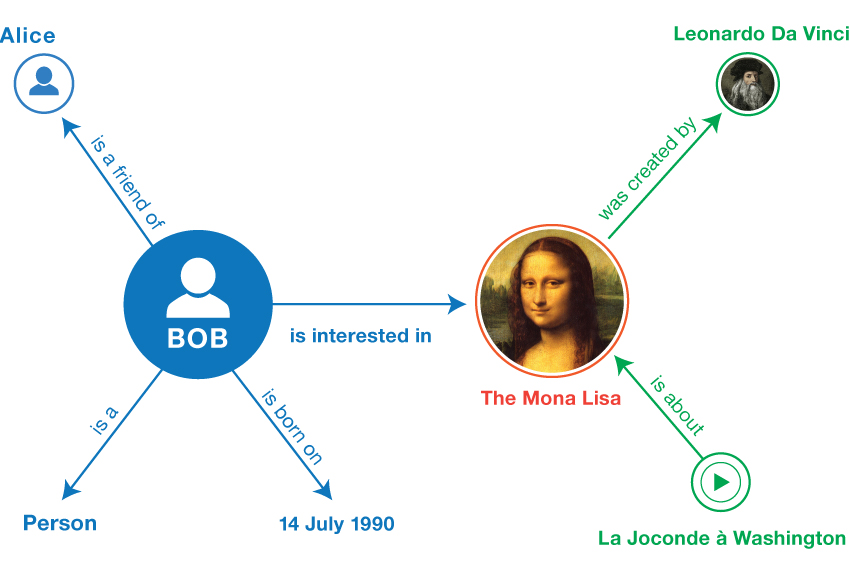
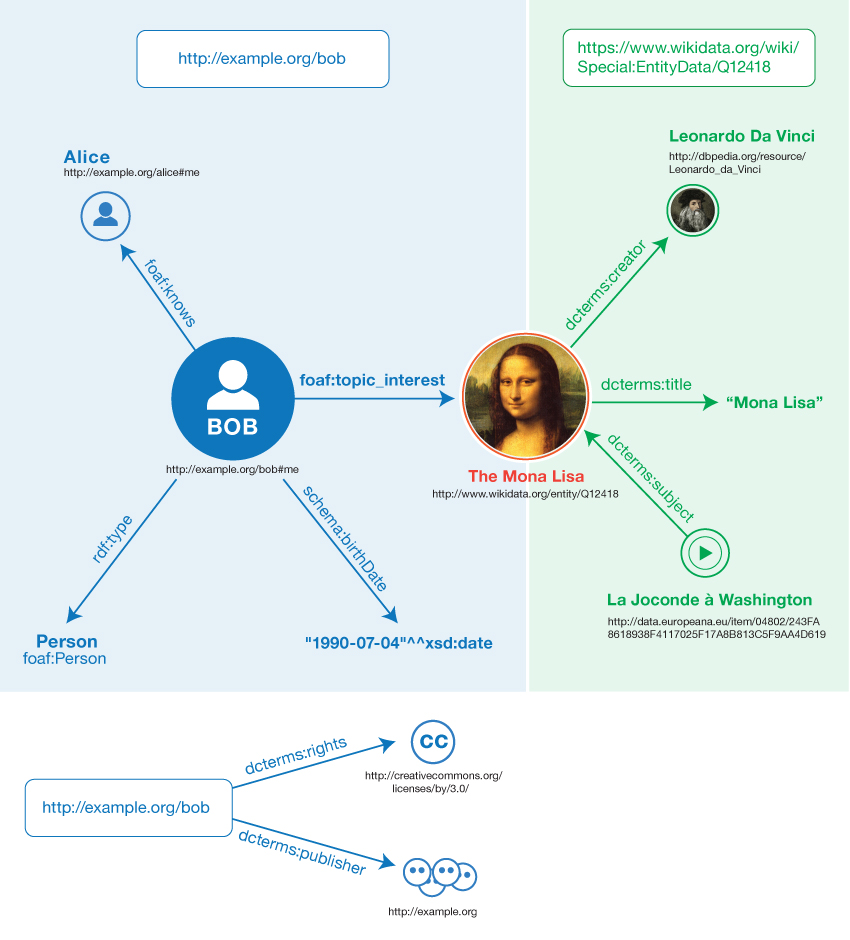
In our associative brains information is linked, forming a network. Many people communicate subsets visually through free-form mindmaps, or more structured diagrams, often on paper or whiteboards. Specialized mindmap software nowadays often is an (extra) manual step for nicer looking pictures, or uses a data format that lacks the standardized semantics to meaningfully connect datasets from different sources and have our digital assistants reason over combinations of them. The first advantage of allowing our digital assistants to help is lowering the chance that people think they mean the same thing, while in fact they mean something slightly or even completely DIFFERENT.
Similar to our associative brains, in machines through standardized notation and vocabularies a similar associating is named Linked Data, simplified:
- A statement called a triple: Something A has some kind of relation R with something B.
- A graph: a collection of connected triples.
- Triples pointing from one graph to another graph somewhere else, allow for querying a combination of graphs, for which answers can be immediately visualized.
| Conceptually | In Linked Data |
 |
 |
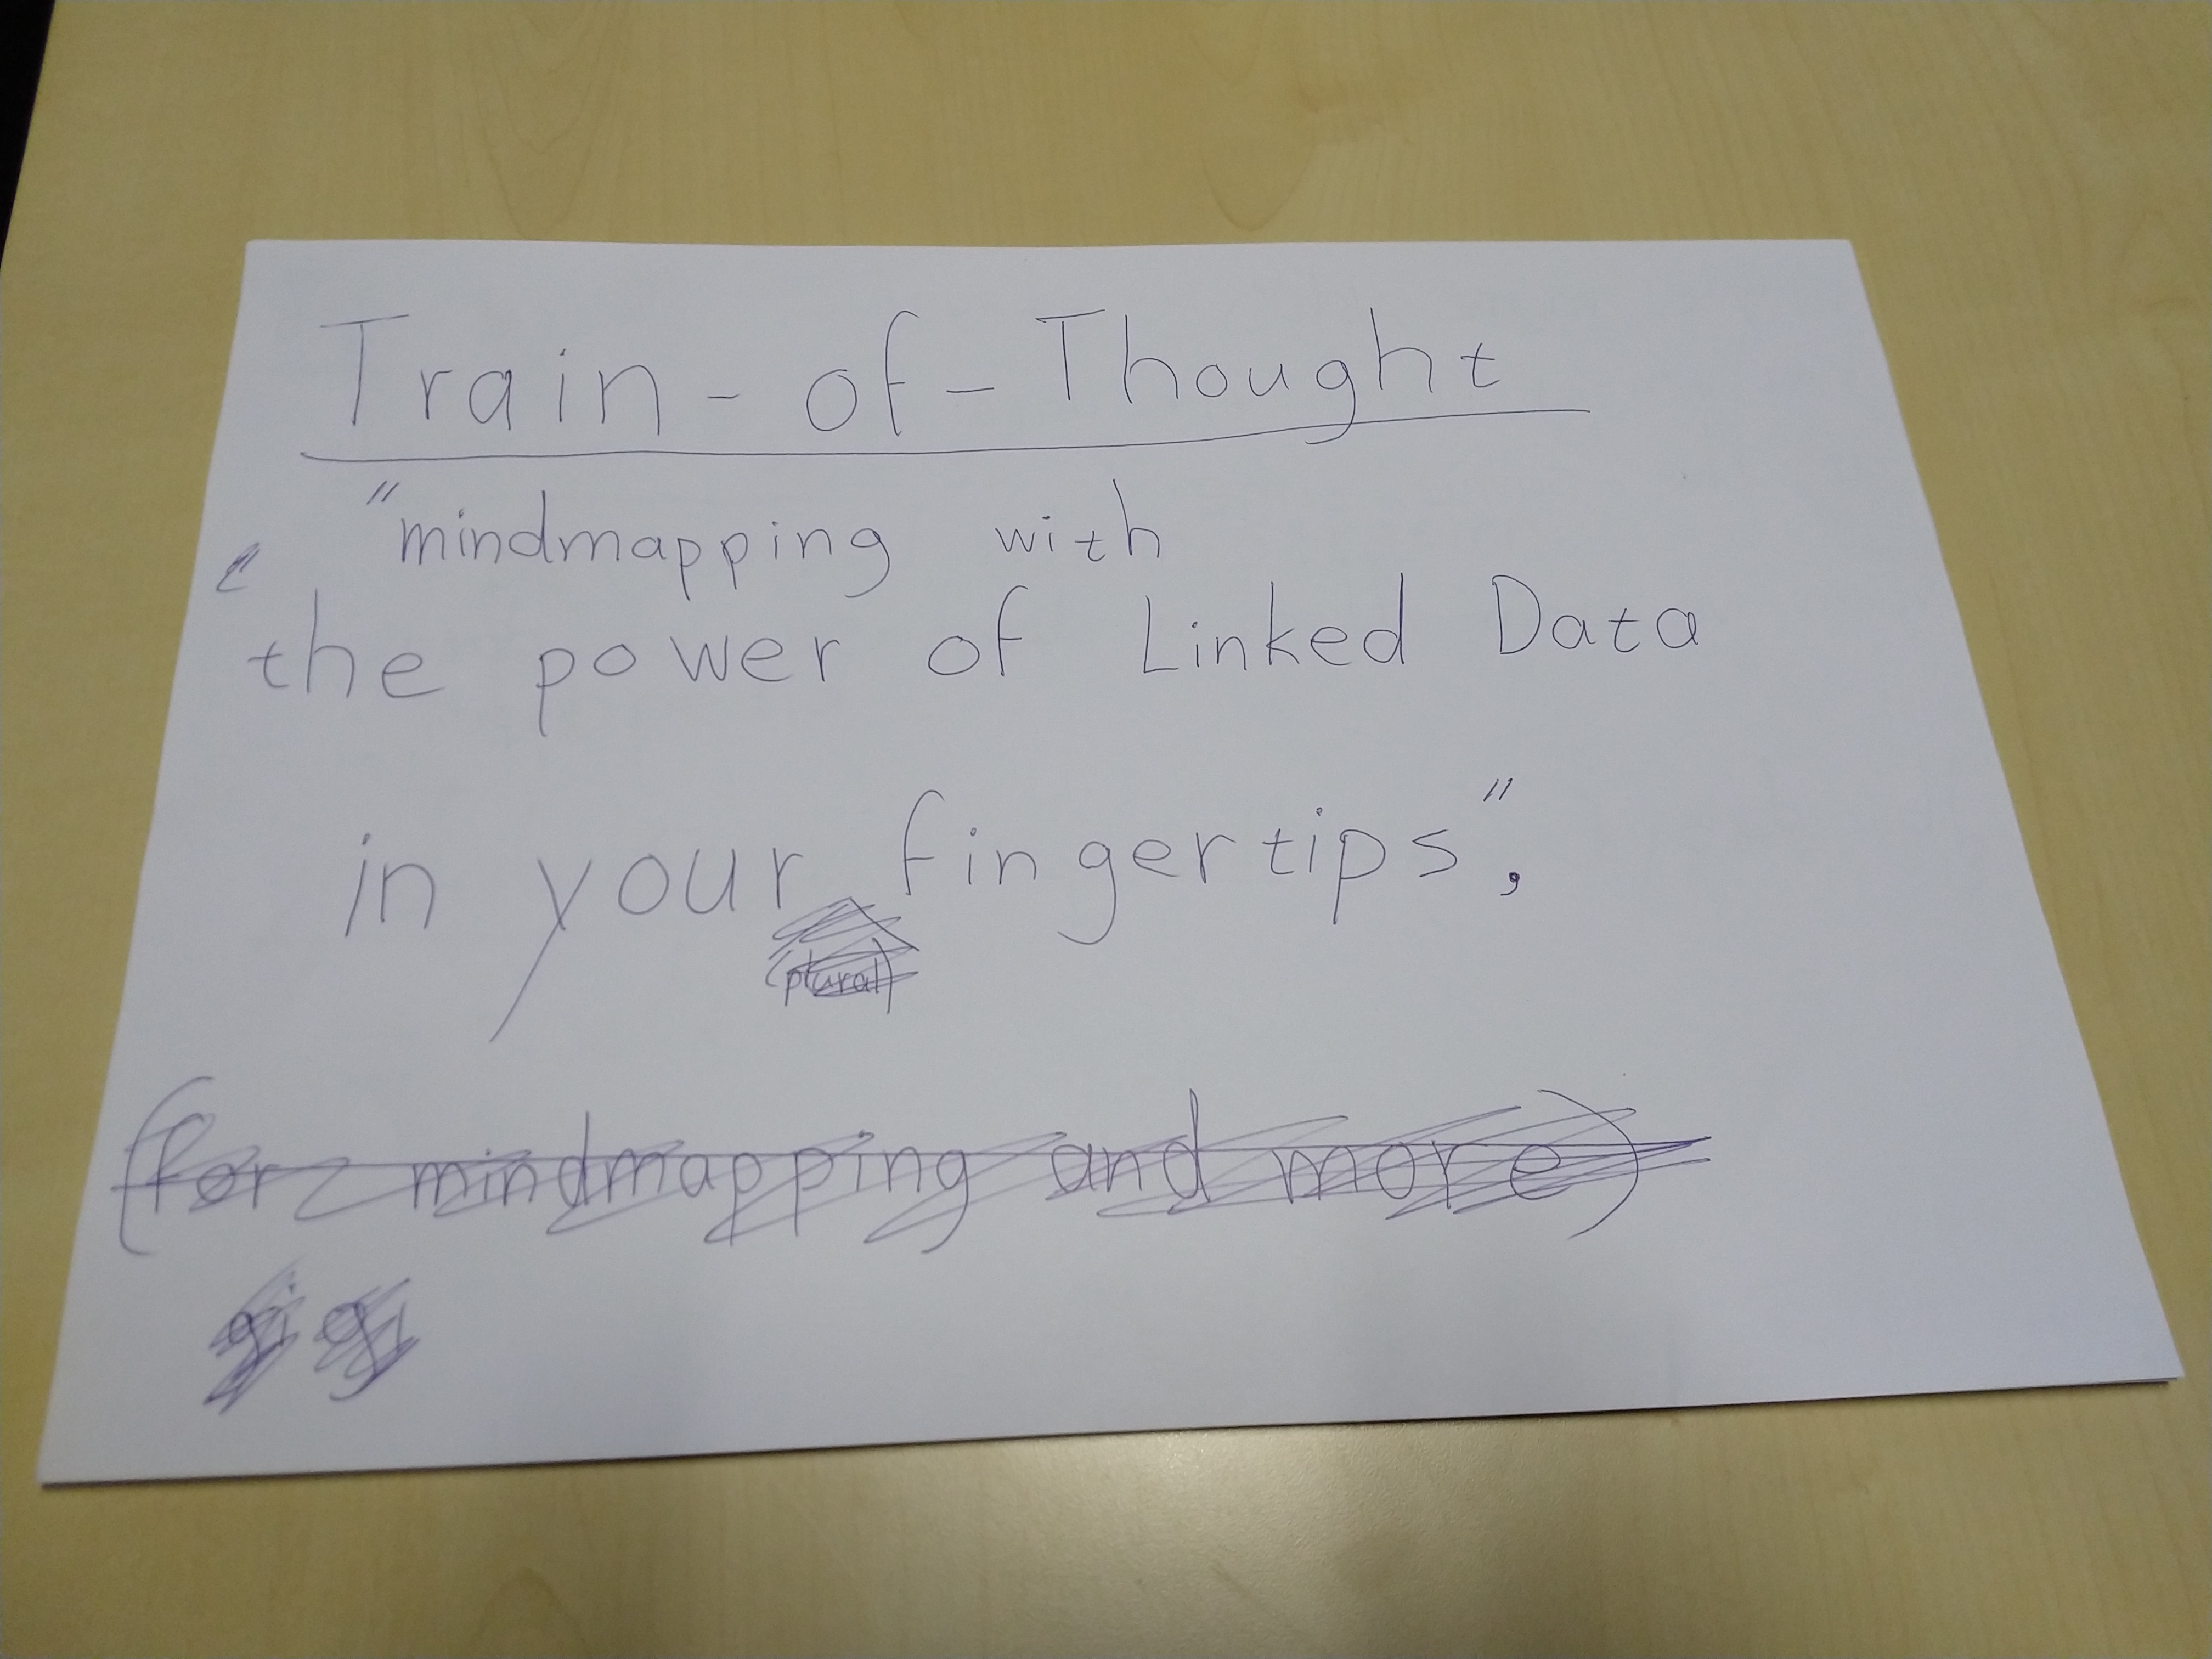
Train of Thought is about combining the usability of a whiteboard with the power of Linked Data.
PURPOSE: to make a 'mindgraph' (a 2D selection in a editable higher-dimension graph)
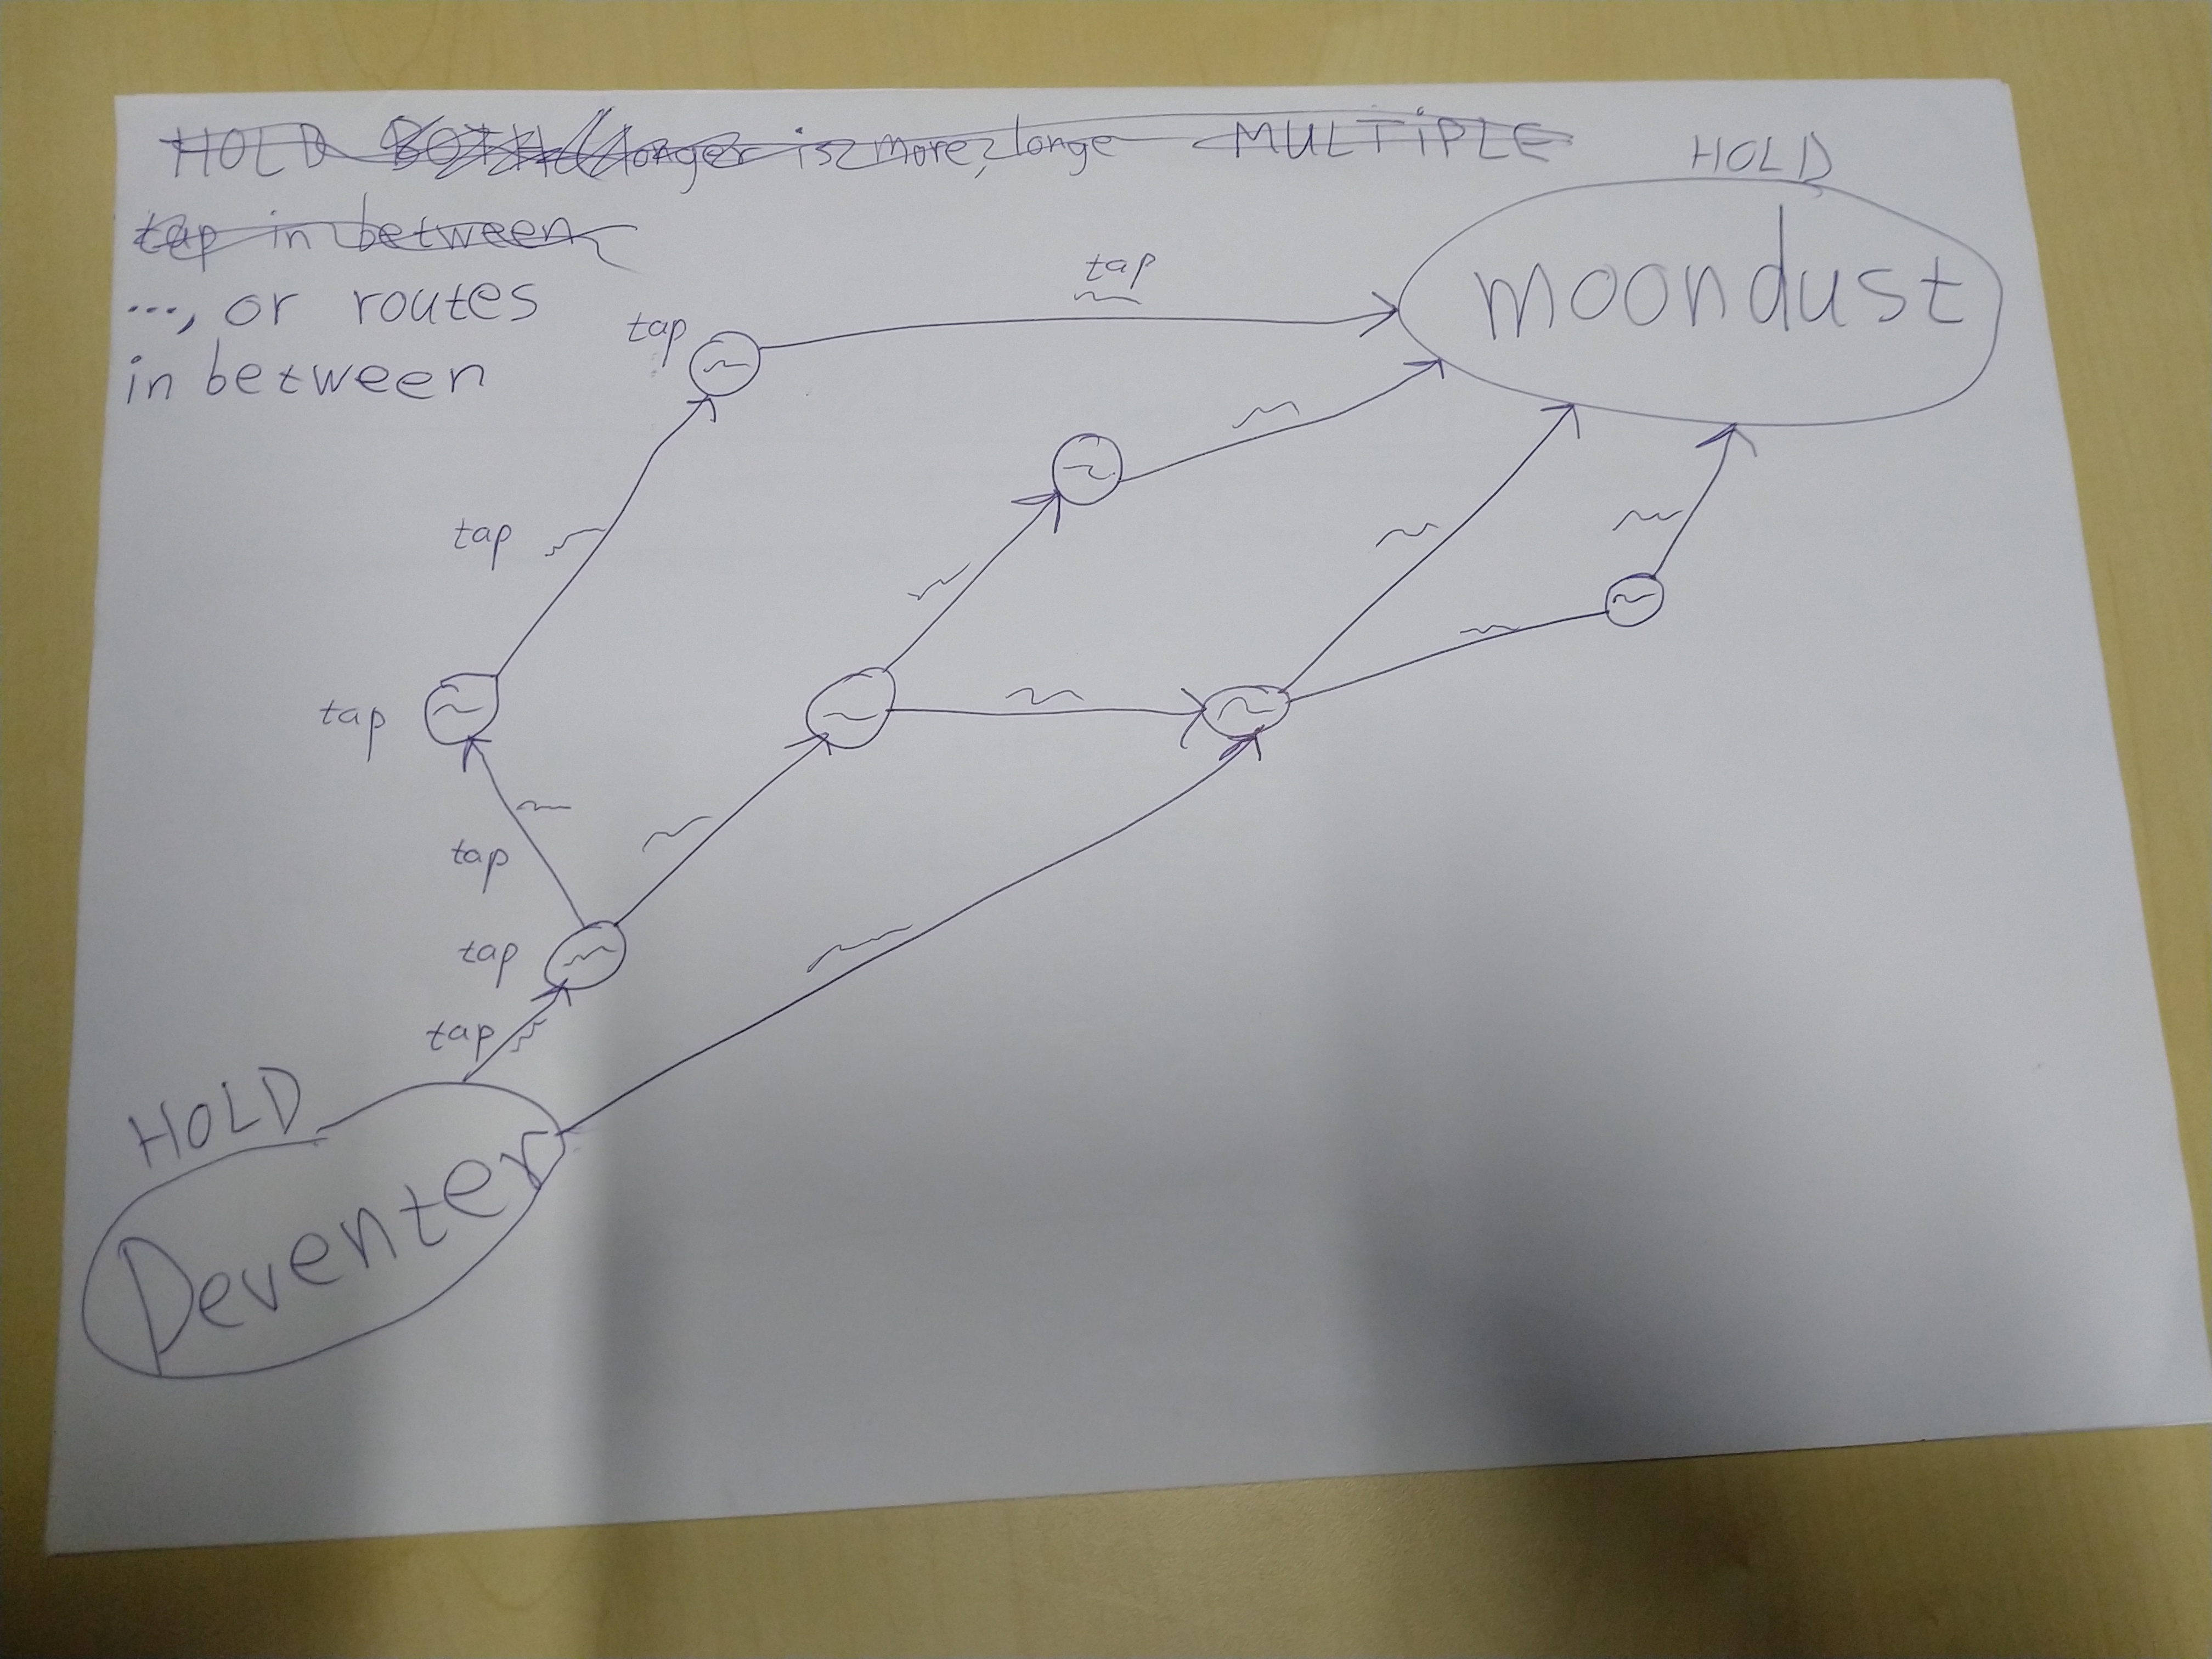
Very quickly hand draw a query-able graph combining new nodes and edges and those already available somewhere outside on the web, suggested in context (while also recording the process including audio).
A possible application: brainstorming about possible new research projects to take on and getting suggestions from the many research (meta)data out there and things related to it. Also it is a way to capture new (meta)data as early as possible, which is rewarded as early as possible with the generated suggestions in this tool.
For data-quality reasons you don't want people to postpone making the metadata or not being helped doing it.
A MENTAL MODEL FOR THE BROADER DATA MODEL OF THIS ENVISIONED WEB APP
Imagine a horizontal transparent layer to hold the mindgraph:
- On top of it new nodes and edges are drawn
- Pinned against the bottom of it are some outside nodes and edges.
Outside nodes that are not part of the mindgraph layer hang by their edges downward into 3D space. How deep is linear to the number of hops from the mindgraph layer, but not only straight down as to prevent overlap in the top-down 2D view on the system; nodes seem to slightly repel each other.
It's as if the mindgraph is a glass lid on a box full of nodes and edges. IMAGE TO ADD
Drawing process
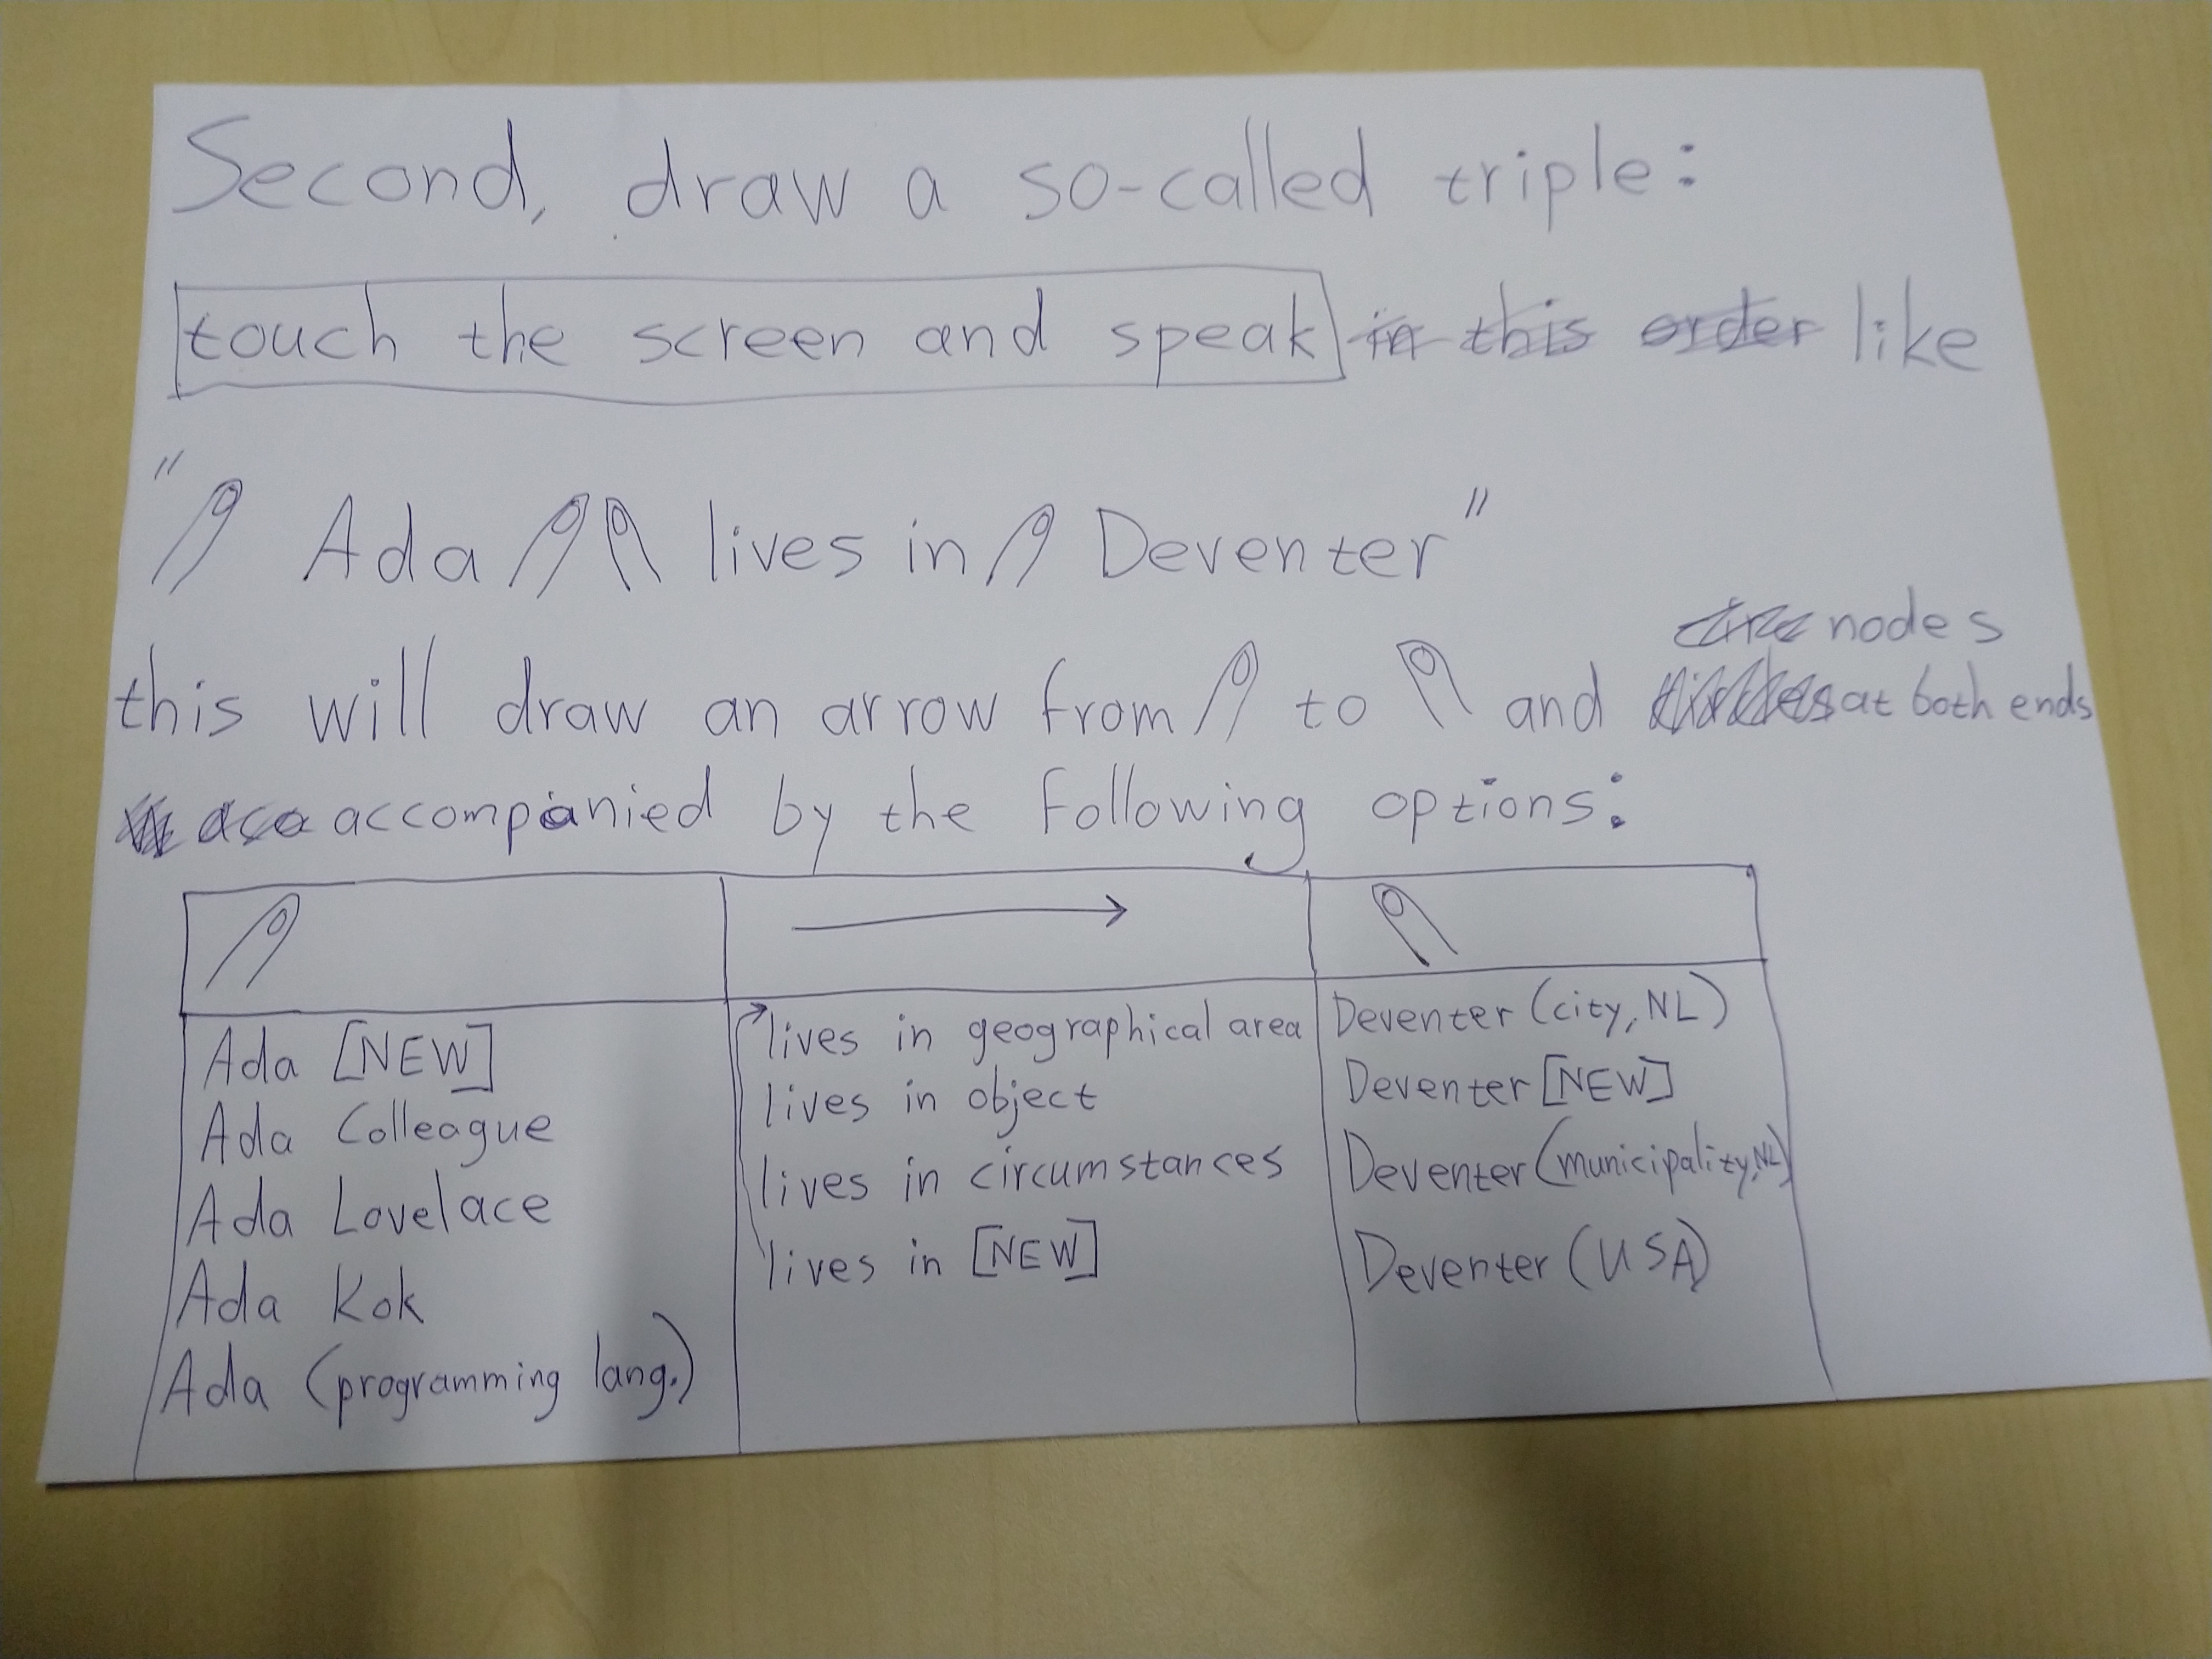
- Creating new nodes and edges with the flick of a finger: an arrow with 3 locations for optional text (spoken or typed): before+along+after (where the first and/or last could already exist there)
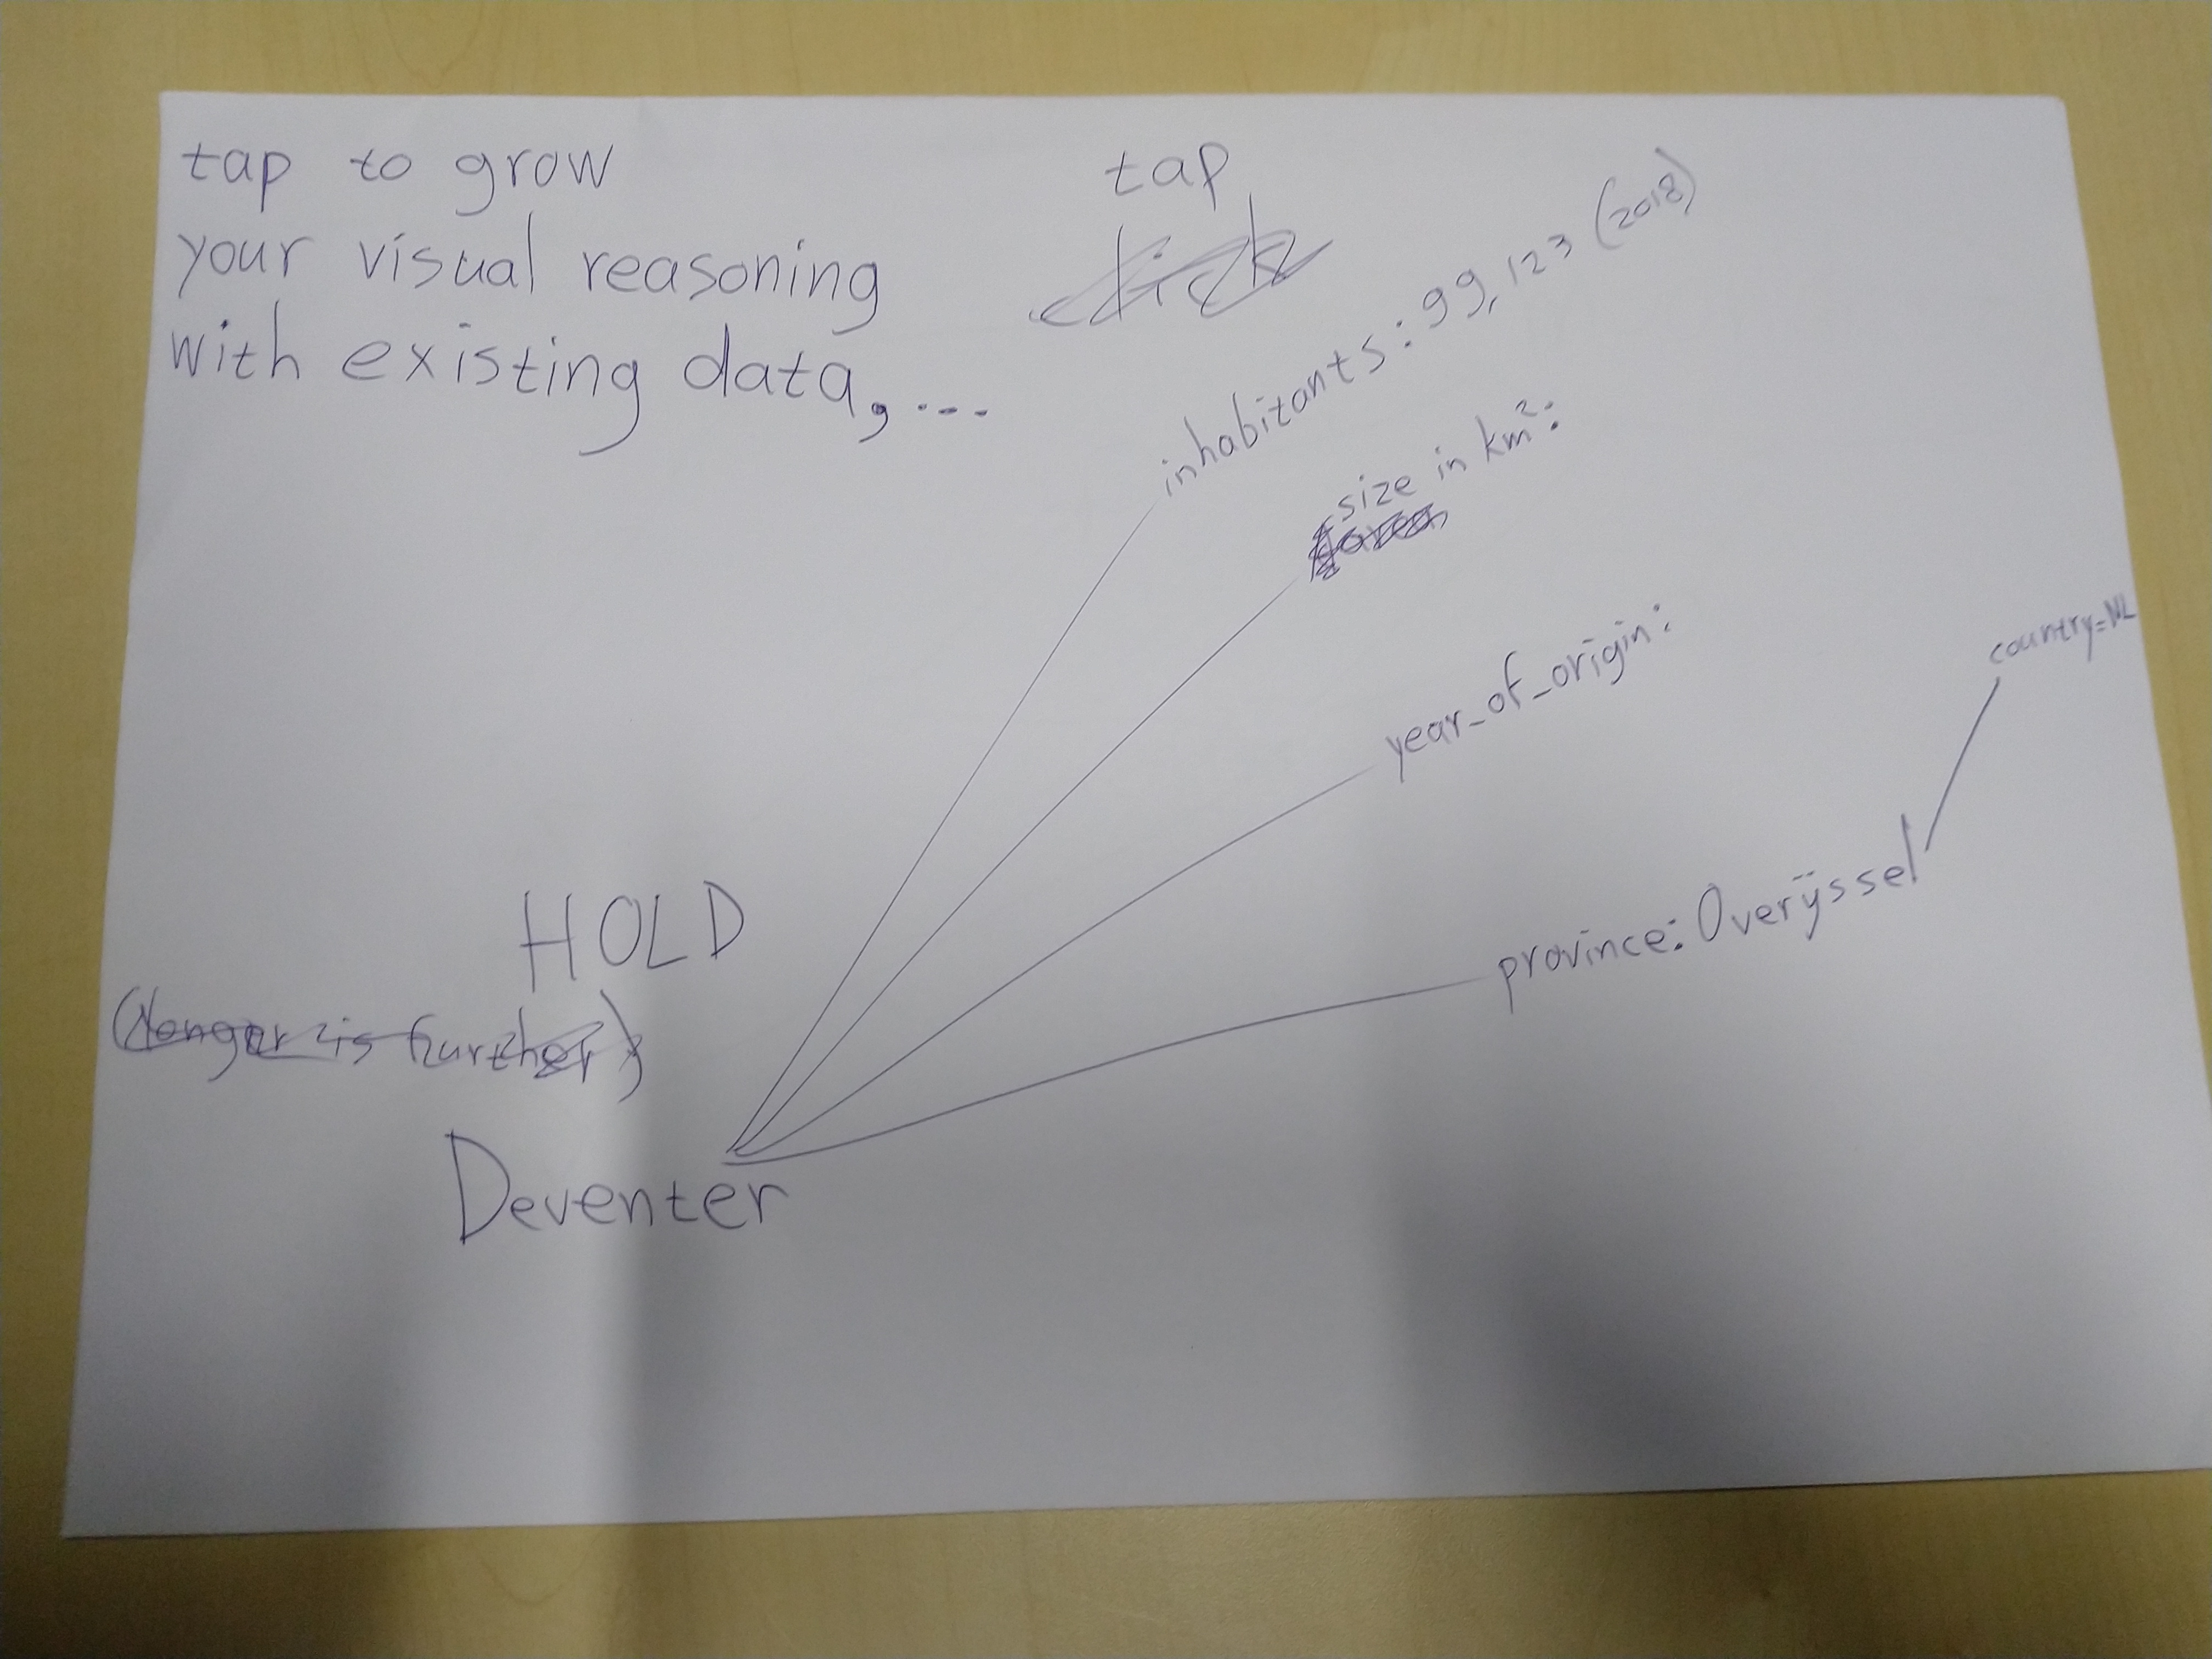
- Elements not in the mindgraph yet, can be tapped to pin them into it.
- Tap again for unpin (this can also mean you unpin what you drew, adding up to 4 combinations: drawn/outside and in/below mindgraph)
- Of course you can only pin what is visible, which usually is only a tiny tiny fraction of data available below the mindgraph. A possibly complex algorithm and a few user controls (zoom, depth, SPARQLfilter, RelFinder, etc.) to steer it, decide what is visible and how big, detailed or custom, elements are depicted.
- A search algorithm can hang 'Did you Mean?'-type edges from nodes in the mindgraph. If you connect those with a "replaces" pseudo-edge, they'll be combined into one node, meaning your quick vague mention suddenly became a concept already strictly defined elsewhere. A sort of opposite is also possible, if you connect with a "ignore suggestions" pseudo-edge, the multiple 'Did you Mean?'-edges will be deleted and the connected nodes will probably drop into the depths.
- Manual added relations get suggestions for relation type available in the current vocabulary search space, which you created by (un)selecting vocabularies. Pick a selection for the relation type, or confirm a new one.
What more, possibly
- There's so much HTML out there to be used; look into the vocab mentioned in the "miljoenennota" video on PLDN.
- Created data will be shareable to other Linked Data users and projects, including from SoLiD pods.
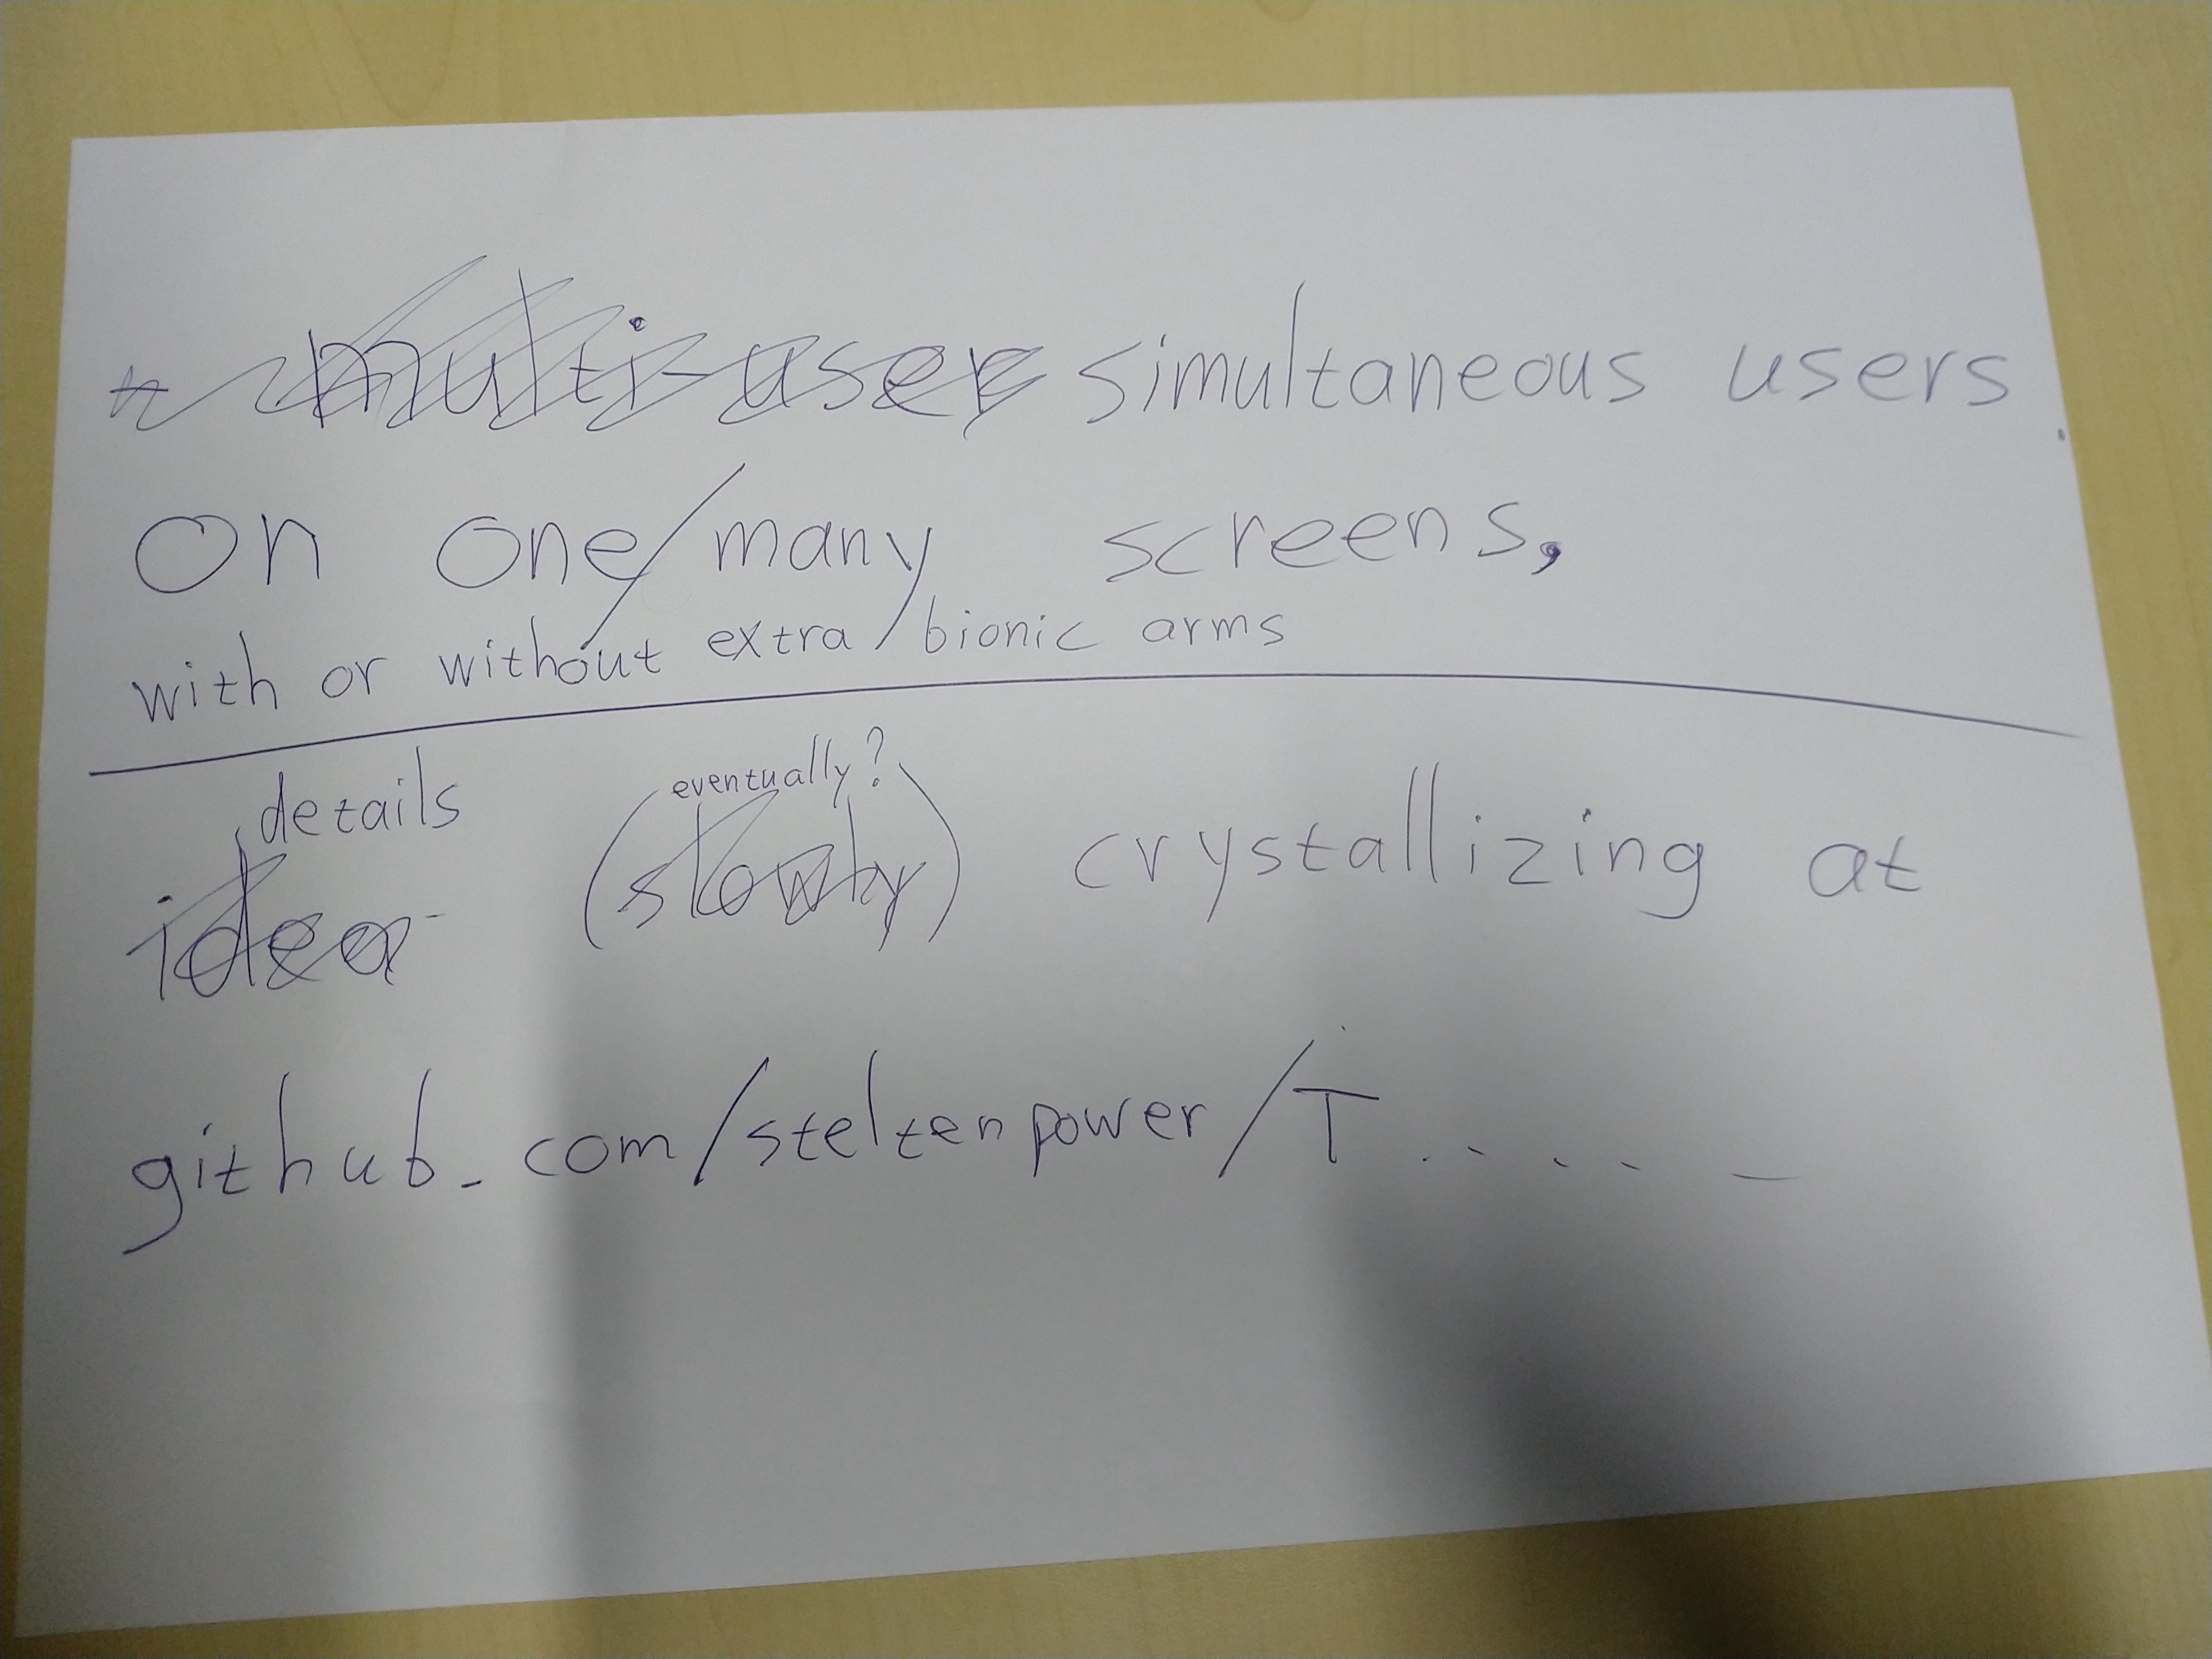
- Live sharing a.k.a. multi-user mode, might result in several cooperation styles: cleaning/specifying/growing/discussing
- The tool should ideally be almost as fast to operate as your train of thought. Hence, the name. Because of that and needing to fit not only small graphs on screen, interaction should not everywhere need visual indicators taking up space all the time. Content is king, right?
- Offered suggestions will not force you to interact right-there-and-then for several reasons: You should be able to keep the flow in your train of thought. Generating suggestions can take a while and go gradually. Some suggestions could automatically disappear again, because of changes elsewhere (e.g. if I note that someone sucks at sports, to suggest the Wimbledon winner by the same name is no longer logical).
- Maybe it can be nicely combined with Knowledge Dock. One allows the user sloppyness in manually drawing a graph, the other allows the user to type a text. In both cases the computer suggests more specific meaning. Maybe they can be synchronized for the current result or maybe even through time by scrolling the story.
- of course all sorts of custom views can be added
- Build it in SVG, possibly with RDFa for search engines.
- A query-builder and result visualizer as known from WikiData gives reasoning power, with almost no coding needed by the user still.
- To not copy nodes or edges, RDF* will be used
FROM HERE ON: OLD, SOMETIMES OUTDATED, SKETCHES AND STUFF
(An idea for) a linked mindmapping tool (multi-touch + speech recognition + Linked(Open)Data + keeping-your-flow-UI = quick semantic graph design)
The idea from a user point of view is at the moment best shown in these photographed drafts:

Only for more technical (and slightly outdated compared to these photographs) details, keep reading ...
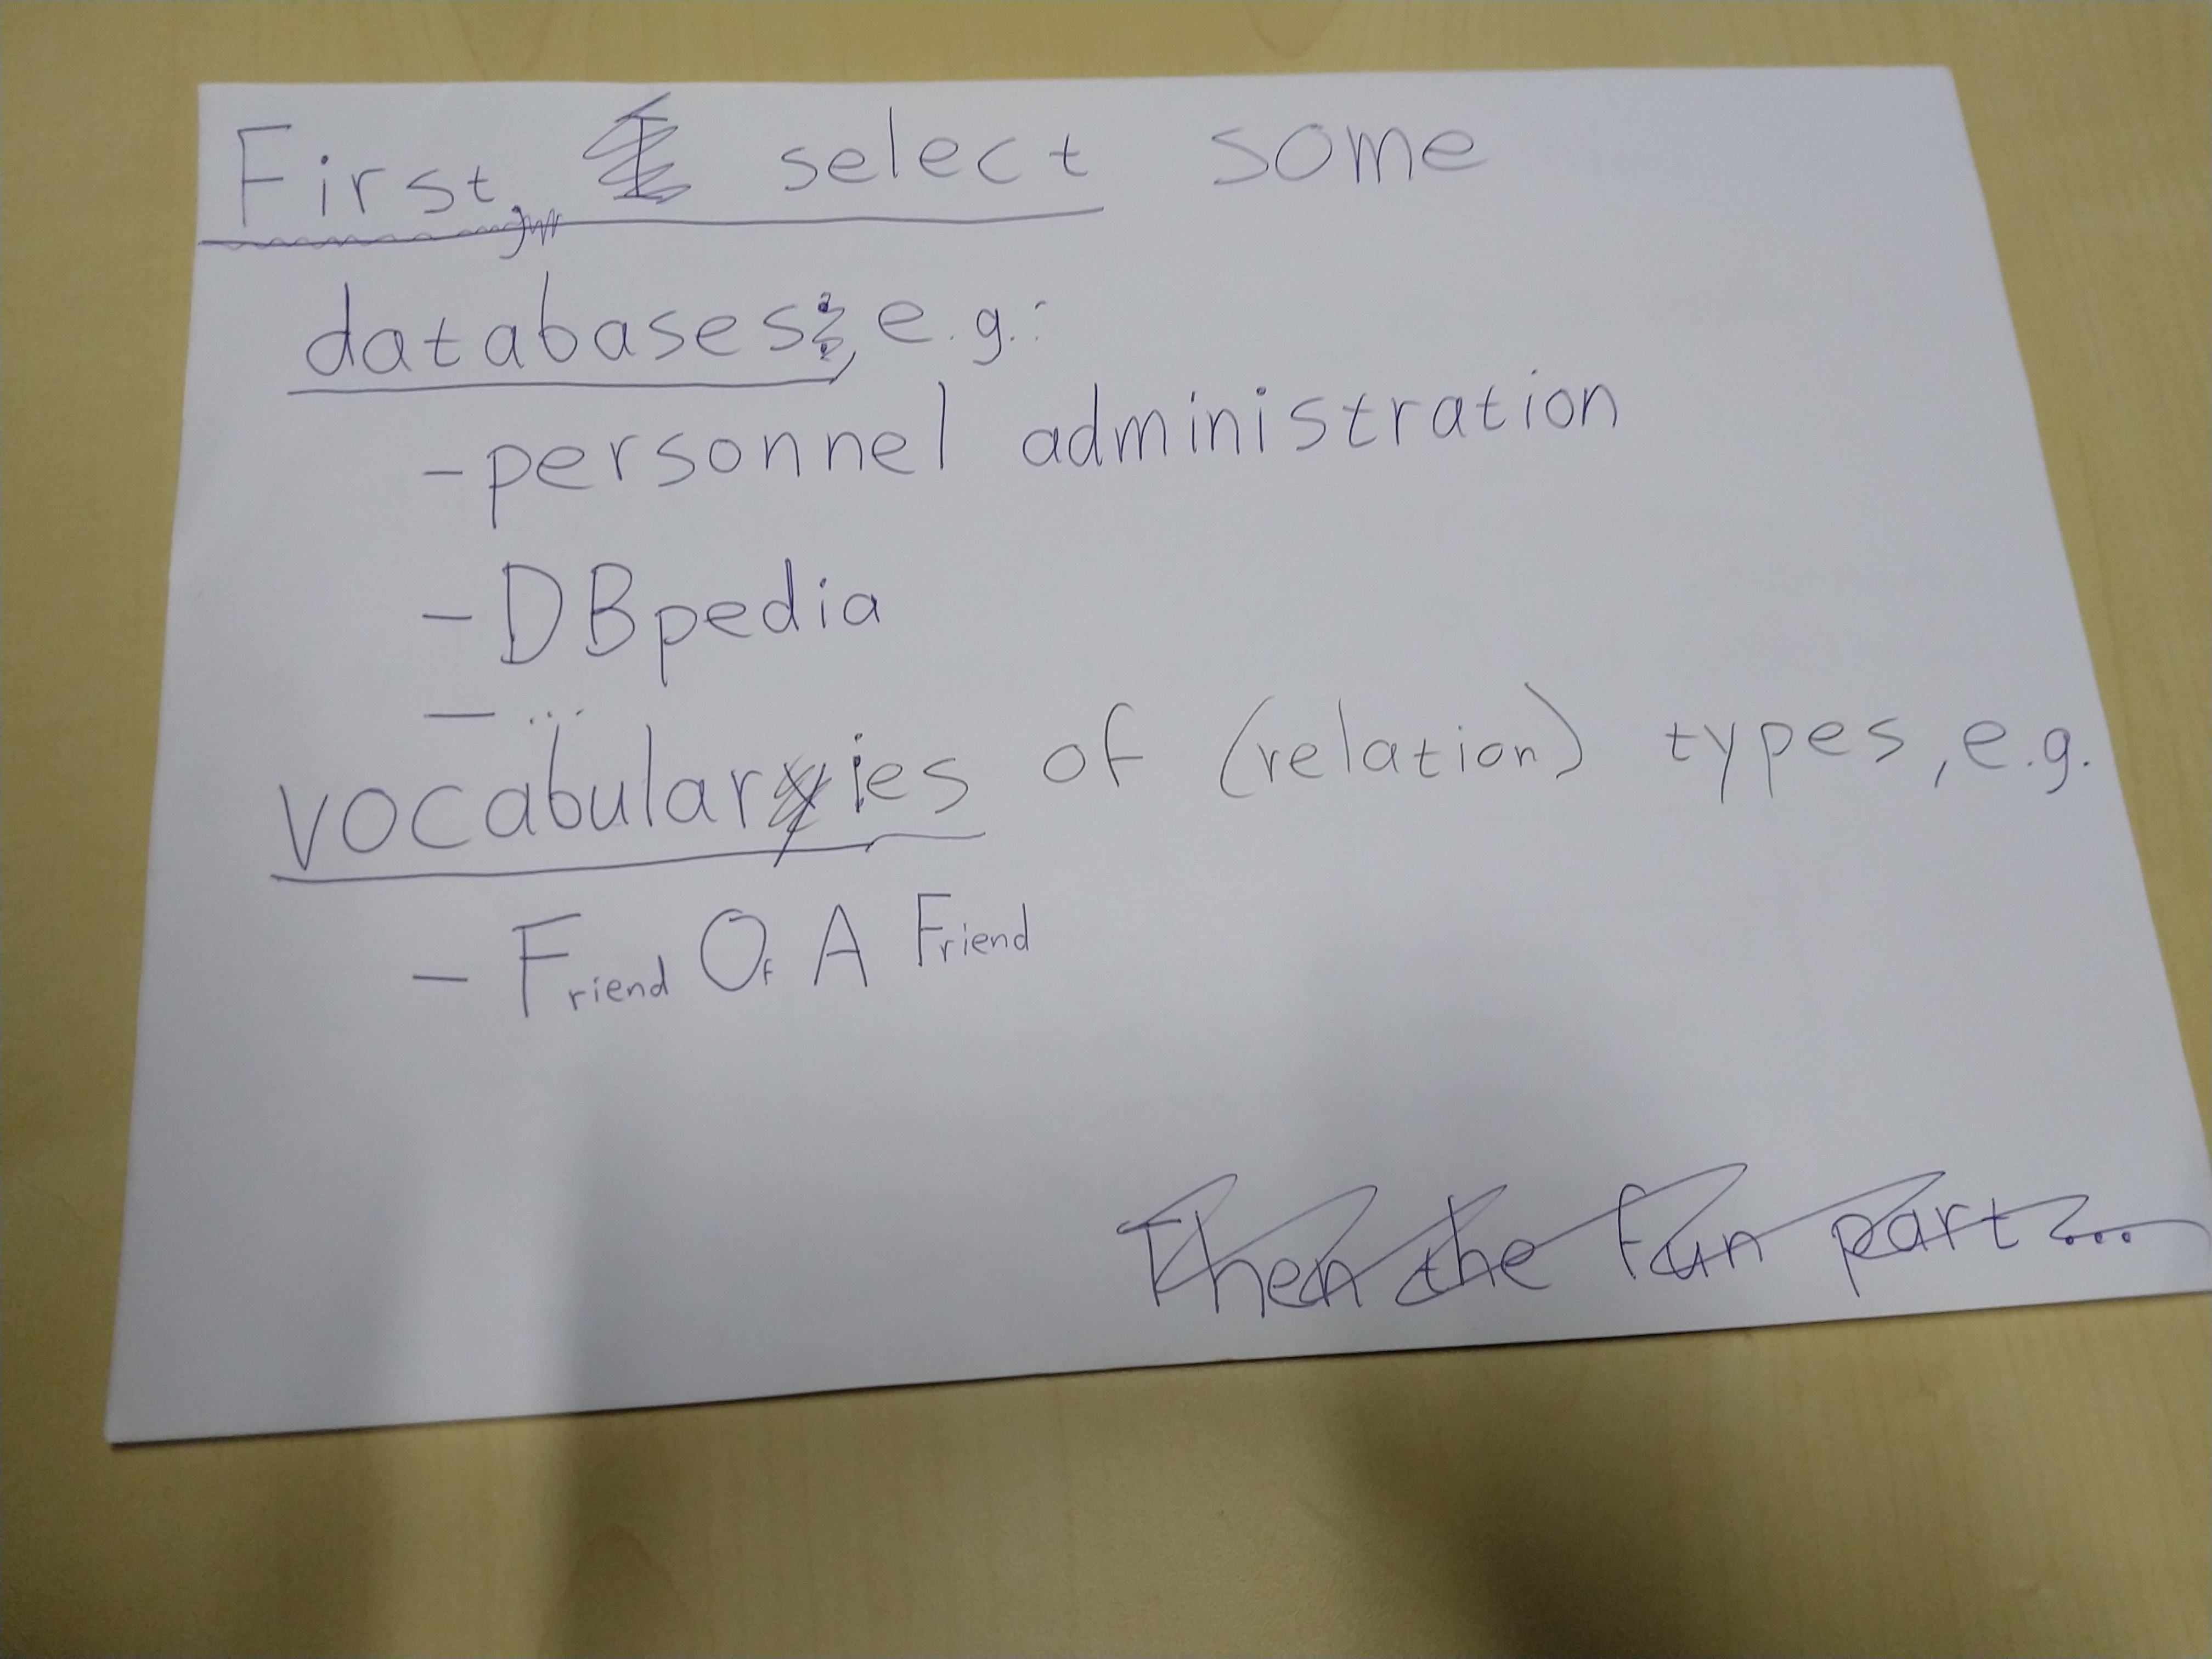
PROJECT SETUP:
everything to be identified with URL(s):
-
user, followed by a LOGIN-BUTTON
-
THIS (shared) reasoning canvas to work/cooperate in
-
additional LINKspaces (aka triplestores) available from which concepts and relations can be referred to from within this canvas. One could make entry convenient by a table like:
checkbox name URL V DBpedia https://... WikiData https://... V WorldCat https://... my dataPOD https://inrupt... V John Doe's dataPOD https://... name of other thoughtspace https://... uni's personnel reg. https://... V _ _ _ enter name _ _ _ _ _ _ enter URL _ _ _ _ _ _ SEARCH _ _ _ using https://lod-cloud.net/datasets -
ontologies available in this canvas. One could make entry convenient by a table like:
checkbox name URL V DC(Dublin Core) https://... schema.org https://... V FOAF(Friend Of A Friend) https://... V _ _ _ enter name _ _ _ _ _ _ enter URL _ _ _ _ _ _ SEARCH _ _ _ using https://lov.linkeddata.es/dataset/lov/
PRIMARY INTERACTION:
Train-Of-Thought combines multi-touch with speech recognition (fallback: typing for quick edit) for quickly drawing a semantic graph;
While listening for concepts, matches are searched for in the available LINKspaces, plus general English is used to name new-to-define concepts. Appearing lists of options don't need a choice immediately; just keep drawing (while options load and logic filters them).
Next to what the ontologies define, relation types can also be 'undefined' with "links to". Connecting to a node with a 'relFinder' edge will be interpreted as finding a relation in available LINKspaces with http://www.visualdataweb.org/relfinder.php
Nodes are drawn or selected where the screen is touched.
Relation types are shown along the edge is between.
The following state diagram defines the main user-interaction, for 2 fingers with touch down (1,2) and touch up (1,2) events:
     +------------------+
     | WAITING FOR USER |
     +------------------+
         ^          \/
 ̶1 > > > ̶1           1
 ^       ^          \/
 ^   +------------------------------------------+
 ^   | if (1 on Node) ==> showingAvailableLINKs |
 ^   |           else ==> ListeningForConceptA  |
 ^   +------------------------------------------+
 ^                 \/
 ^                  2< < < < < < < < < < < < < < < < < < < < < <2
 ^                 \/                                           ^
 ^   +-----------------------------------------------------+    ^
 ^   | if (2 on Edge/Destination) ==> LinkIntoCanvas       |    ^
 ^   |                       else ==> ListeningForRelation |    ^
 ^   +-----------------------------------------------------+    ^
 ^                 \/                                           ^
 ^                  ƻ                                           ^
 ^                 \/                                           ^
 ^   +-------------------------------------------+              ^
 ^   | if (2 on Canvas) ==> ListeningForConceptB |              ^
 ^   +-------------------------------------------+              ^
 ^       \/        \/                                           ^
 ̶1< < < < ̶1         2> > > > > > > > > > > > > > > > > > > > > >2
OR, as most screens of any decent size are not multi-touch, better stick to single-touch/mouse
ARB=DOWN_ON_CANVAS,SPEAK_A,START_MOVING,SPEAK_R,UP,SPEAK_B,SILENCE
A=DOWN_ON_CANVAS,SPEAK_A,UP
RB=,START_MOVING_ON_A_OR_CANVAS_AS_IMPLIED_A,SPEAK_R,UP,SPEAK_B
SHOW_PROPS_OR_HIDE=CLICK_NODE, SELECT_PROPS=CLICK_PROP
WRITE QUERIES TO FILTER, CHANGE TABS TO ALTERNATIVE VIEWS:
By adding SPARQL in a textbox, the user can filter the current representation. I say current as more representations (e.g. N3, JSON-LD) are possible next to default one described in the diagram above (probably implemented in HTML5/SVG with RDFa embedded).
THINGS I STILL DOUBT ABOUT A BIT:
- Is there a clear divide between LINKspaces and ontologies?
- Can ontologies be created in the canvas?
- The principle of linked data is nicely shown in https://research.csiro.au/oznome/wp-content/uploads/sites/35/2017/06/image2016-12-6-11-30-49.png , but can I also refer in the canvas to a triple somewhere else, as not copying is the point of this all? Sort of, see http://patterns.dataincubator.org/book/reified-statement.html OR does it need RDF*'s Lois Lane construct as mentioned in https://douroucouli.wordpress.com/2019/07/11/proposed-strategy-for-semantics-in-rdf-and-property-graphs/ ?
- As syntax of SPARQL queries is very similar to one of the RDF notations, can this tool be used to create SPARQL queries?
OpenAlex.org seems a nice ScienceKnowledgeGraph to use in this.
####Coding hints:
-
https://www.ontotext.com/knowledgehub/fundamentals/what-is-rdf-star/
-
http://usefulangle.com/post/28/javascript-handling-multi-touch-with-pointer-events
-
https://technet.microsoft.com/en-us/windowsserver/hh673557(v=msdn.10).aspx
-
https://www.sitepoint.com/unifying-touch-and-mouse-with-pointer-events/
-
https://developer.mozilla.org/en-US/docs/Web/API/Pointer_events/Multi-touch_interaction
-
https://docs.microsoft.com/en-us/windows/uwp/design/input/handle-pointer-input