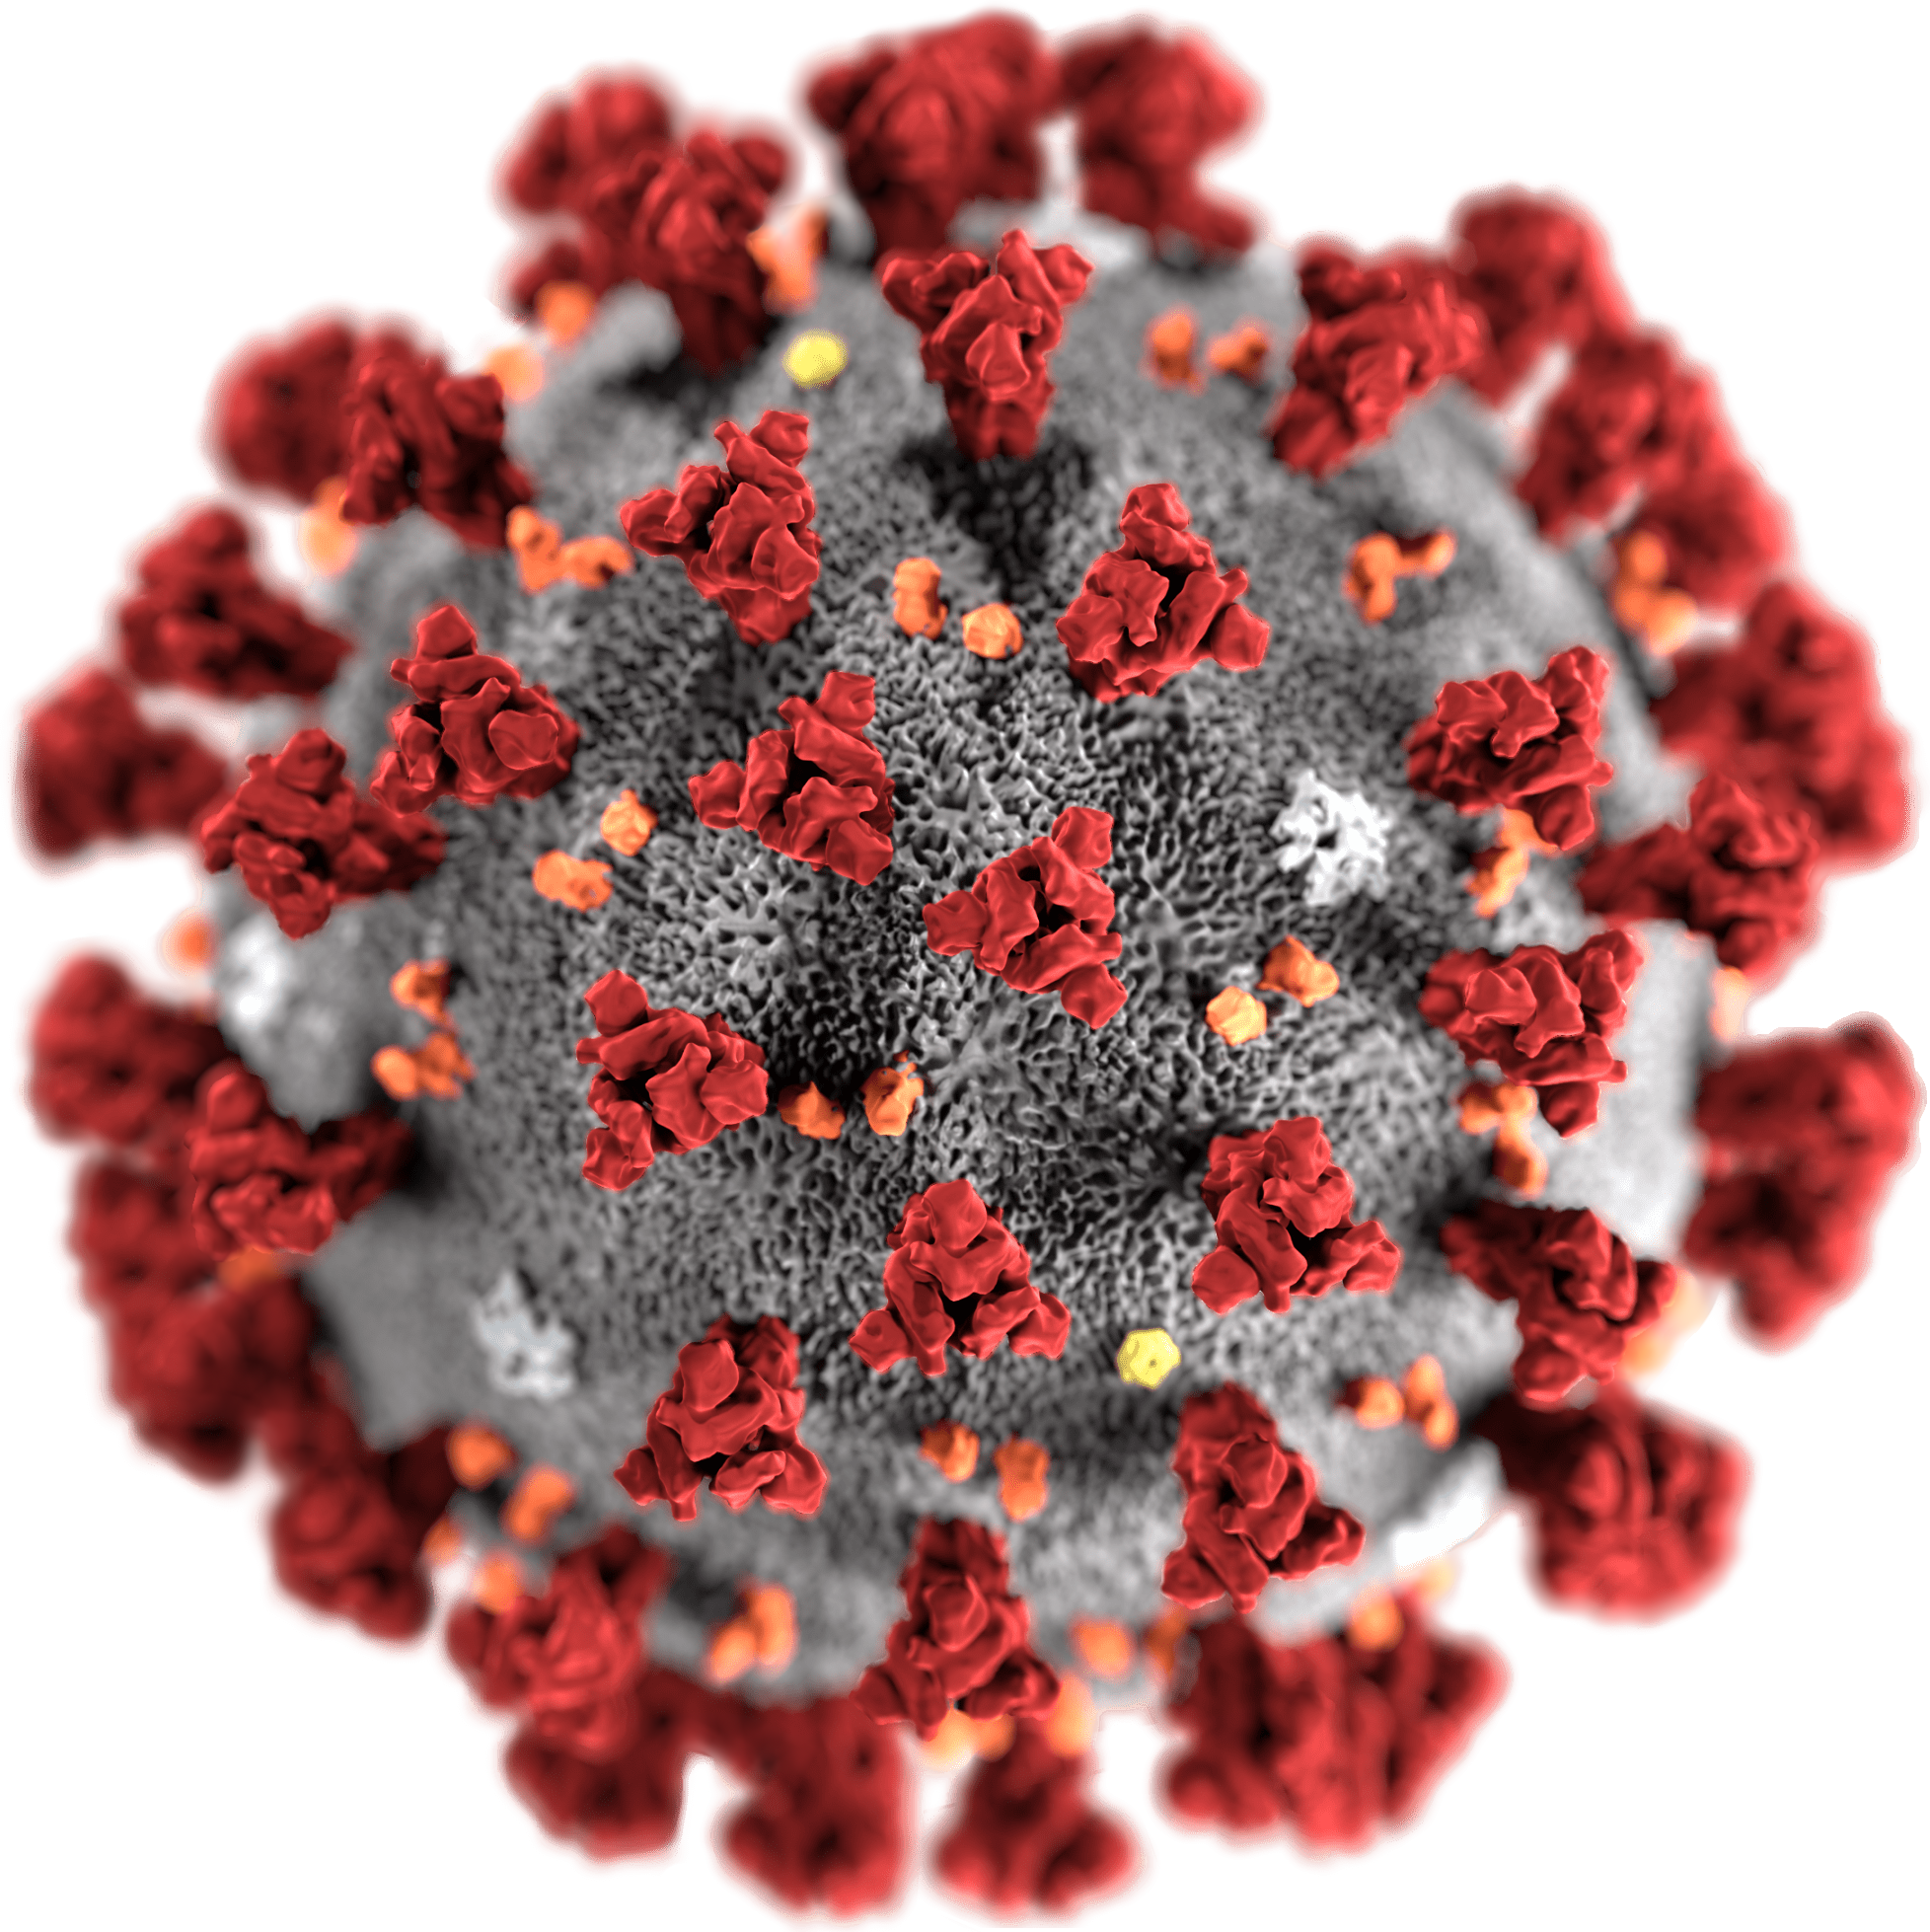
The coronavirus package provides a tidy format dataset of the 2019 Novel Coronavirus COVID-19 (2019-nCoV) epidemic. The raw data pulled from the Johns Hopkins University Center for Systems Science and Engineering (JHU CCSE) Coronavirus repository.
More details available
here, and a csv format
of the package dataset available
here
A summary dashboard is available here
Source: Centers for Disease Control and Prevention’s Public Health Image Library
As this an ongoing situation, frequent changes in the data format may occur, please visit the package news to get updates about those changes
Install the CRAN version:
install.packages("coronavirus") Install the Github version (refreshed on a daily bases):
# install.packages("devtools")
devtools::install_github("RamiKrispin/coronavirus")The package contains a single dataset - coronavirus:
library(coronavirus)

data("coronavirus")
This coronavirus dataset has the following fields:
head(coronavirus)
#>   Province.State Country.Region Lat Long       date cases      type
#> 1                   Afghanistan  33   65 2020-01-22     0 confirmed
#> 2                   Afghanistan  33   65 2020-01-23     0 confirmed
#> 3                   Afghanistan  33   65 2020-01-24     0 confirmed
#> 4                   Afghanistan  33   65 2020-01-25     0 confirmed
#> 5                   Afghanistan  33   65 2020-01-26     0 confirmed
#> 6                   Afghanistan  33   65 2020-01-27     0 confirmed
tail(coronavirus)
#>       Province.State Country.Region     Lat     Long       date cases  type
#> 29507       Zhejiang          China 29.1832 120.0934 2020-03-18     0 death
#> 29508       Zhejiang          China 29.1832 120.0934 2020-03-19     0 death
#> 29509       Zhejiang          China 29.1832 120.0934 2020-03-20     0 death
#> 29510       Zhejiang          China 29.1832 120.0934 2020-03-21     0 death
#> 29511       Zhejiang          China 29.1832 120.0934 2020-03-22     0 death
#> 29512       Zhejiang          China 29.1832 120.0934 2020-03-23     0 death
Here is an example of a summary total cases by region and type (top 20):
library(dplyr)

summary_df <- coronavirus %>% group_by(Country.Region, type) %>%
  summarise(total_cases = sum(cases)) %>%
  arrange(-total_cases)

summary_df %>% head(20)
#> # A tibble: 20 x 3
#> # Groups:   Country.Region [17]
#>    Country.Region type      total_cases
#>    <chr>          <chr>           <int>
#>  1 China          confirmed       81498
#>  2 Italy          confirmed       63927
#>  3 US             confirmed       43847
#>  4 Spain          confirmed       35136
#>  5 Germany        confirmed       29056
#>  6 Iran           confirmed       23049
#>  7 France         confirmed       20123
#>  8 Korea, South   confirmed        8961
#>  9 Switzerland    confirmed        8795
#> 10 United Kingdom confirmed        6726
#> 11 Italy          death            6077
#> 12 Netherlands    confirmed        4764
#> 13 Austria        confirmed        4474
#> 14 Belgium        confirmed        3743
#> 15 China          death            3274
#> 16 Norway         confirmed        2621
#> 17 Spain          death            2311
#> 18 Canada         confirmed        2088
#> 19 Portugal       confirmed        2060
#> 20 Sweden         confirmed        2046
Summary of new cases during the past 24 hours by country and type (as of 2020-03-23):
library(tidyr)

coronavirus %>%
  filter(date == max(date)) %>%
  select(country = Country.Region, type, cases) %>%
  group_by(country, type) %>%
  summarise(total_cases = sum(cases)) %>%
  pivot_wider(names_from = type,
              values_from = total_cases) %>%
  arrange(-confirmed)
#> # A tibble: 168 x 3
#> # Groups:   country [168]
#>    country        confirmed death
#>    <chr>              <int> <int>
#>  1 US                 10571   140
#>  2 Spain               6368   539
#>  3 Italy               4789   601
#>  4 Germany             4183    29
#>  5 France              3880   186
#>  6 Iran                1411   127
#>  7 Switzerland         1321    22
#>  8 United Kingdom       981    54
#>  9 Austria              892     5
#> 10 Canada               619     4
#> 11 Netherlands          547    34
#> 12 Portugal             460     9
#> 13 Brazil               378     9
#> 14 Israel               371     0
#> 15 Belgium              342    13
#> 16 Turkey               293     7
#> 17 Norway               236     3
#> 18 Ireland              219     2
#> 19 Malaysia             212     4
#> 20 Ecuador              192     4
#> 21 Romania              143     4
#> 22 Australia            133     0
#> 23 South Africa         128     0
#> 24 Thailand             122     0
#> 25 Czechia              116     0
#> 26 Poland               115     1
#> 27 Chile                114     1
#> 28 Sweden               112     4
#> 29 India                103     3
#> 30 Pakistan              99     1
#> 31 Philippines           82     8
#> 32 Luxembourg            77     0
#> 33 Finland               74     0
#> 34 Greece                71     2
#> 35 Russia                71     0
#> 36 Indonesia             65     1
#> 37 Mexico                65     1
#> 38 China                 63     0
#> 39 Croatia               61     0
#> 40 Denmark               58    11
#> # … with 128 more rowsThe raw data pulled and arranged by the Johns Hopkins University Center for Systems Science and Engineering (JHU CCSE) from the following resources:
- World Health Organization (WHO): https://www.who.int/
- DXY.cn. Pneumonia. 2020. http://3g.dxy.cn/newh5/view/pneumonia.
- BNO News:
https://bnonews.com/index.php/2020/02/the-latest-coronavirus-cases/
- National Health Commission of the People’s Republic of China (NHC): http:://www.nhc.gov.cn/xcs/yqtb/list_gzbd.shtml
- China CDC (CCDC):
http:://weekly.chinacdc.cn/news/TrackingtheEpidemic.htm
- Hong Kong Department of Health:
https://www.chp.gov.hk/en/features/102465.html
- Macau Government: https://www.ssm.gov.mo/portal/
- Taiwan CDC:
https://sites.google.com/cdc.gov.tw/2019ncov/taiwan?authuser=0
- US CDC: https://www.cdc.gov/coronavirus/2019-ncov/index.html
- Government of Canada:
https://www.canada.ca/en/public-health/services/diseases/coronavirus.html
- Australia Government Department of Health:
https://www.health.gov.au/news/coronavirus-update-at-a-glance
- European Centre for Disease Prevention and Control (ECDC):
https://www.ecdc.europa.eu/en/geographical-distribution-2019-ncov-cases


