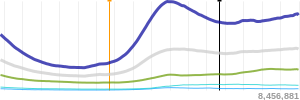
Small server-generated graphs of Guardian content page-views. Uses Ophan data.
/png?page=http://www.theguardian.com/football/2014/jan/05/fa-cup-fourth-round-draw-live
...&graphs=guardian:000099,other:0099ff,google:669900&width=100&height=40
...&markers=1388747300:ff9900&showStats=1&showHours=1
...&smoothing=15&markers=1388901600:f90,1388923200:000,&graphs=guardian:009,other:ccc,twitter:09f,facebook:0CC,google:690&width=300&height=100&hotLevel=2000&&showStats=1&showHours=1
If the number of data points is greater than the width of the graph, the points are resampled to fit. If the number of data points is less than the width, the graph is right-justified (so "now" aligns for vertically stacked graphs) and it's width is partially stretched to make the graph more readable. Smoothing is applied, and can be adjusted.
It's useful to specify a hotLevel that reflects "significant page views per minute" for the type of content in question. This sets the upper y-scale of the graph. Activity beyond this level causes all the graph lines to compress down proportionally.
The / URL displays a form for experimenting with options and producing example Sparkline URLs. Images are served from URLs starting /png?...
All parameters are optional.
-
page : url of the Guardian content. Only the pathname part is used. Default is the empty string.
-
graphs : comma-separated names of dataseries from the Ophan breakdown, with optional hex colours (after a colon), e.g.
twitter:6666ff,facebook:000099. The following are in Ophan at time of writing:guardian,unknown - to contentunknown - to frontgoogletwitterfacebookredditdrudge reportoutbrainother
Also supported istotal, which is the default.
-
markers : comma-separated vertical markers, as unix timestamps, with optional hex colours (after a colon), e.g.
1388408200:ff9900,1388409900:cccccc -
width : in pixels. Default is
50. -
height : in pixels. Default is
20. -
showStats : show the total hits counter, when set to
1. Default is0. -
showHours : show the elapsed hour markers, when set to
1. Default is0. -
hotLevel: upper y-bound of the graph, in pageviews-per-minute. Beyond this, the whole graph compresses vertically. Default is
50which is appropriate for articles; fronts need a much higher figure. Recent activity beyond this level causes a bold graph line (and a half-bold line at half this level). -
hotPeriod : number of minutes over which to calcuate the "recent activity". Default is
5. -
alpha : opacity of the graph lines. Range from 0 - 1. Default is
0.7. -
smoothing : number of points over which a moving average is computed, for smoothing. For larger graph widths this can be worth increasing. Default is
5.
Requires Node and Cairo.
For Cairo installation, see the Wiki from the node-canvas project.
Then:
$ npm install
Create a file called config.json with ophanHost and ophanKey properties (see sample-config.json).
To rewrite port 80 to port 8080 (or whatever) without using nginx, do this:
sudo iptables -t nat -A PREROUTING -i eth0 -p tcp --dport 80 -j REDIRECT --to-port 8080
Add it (minus sudo) to /etc/rc.local so that it happens on a reboot.
Install forever:
$ npm install forever -g
Start the app:
forever start ~/ophan-sparklines/app.js


