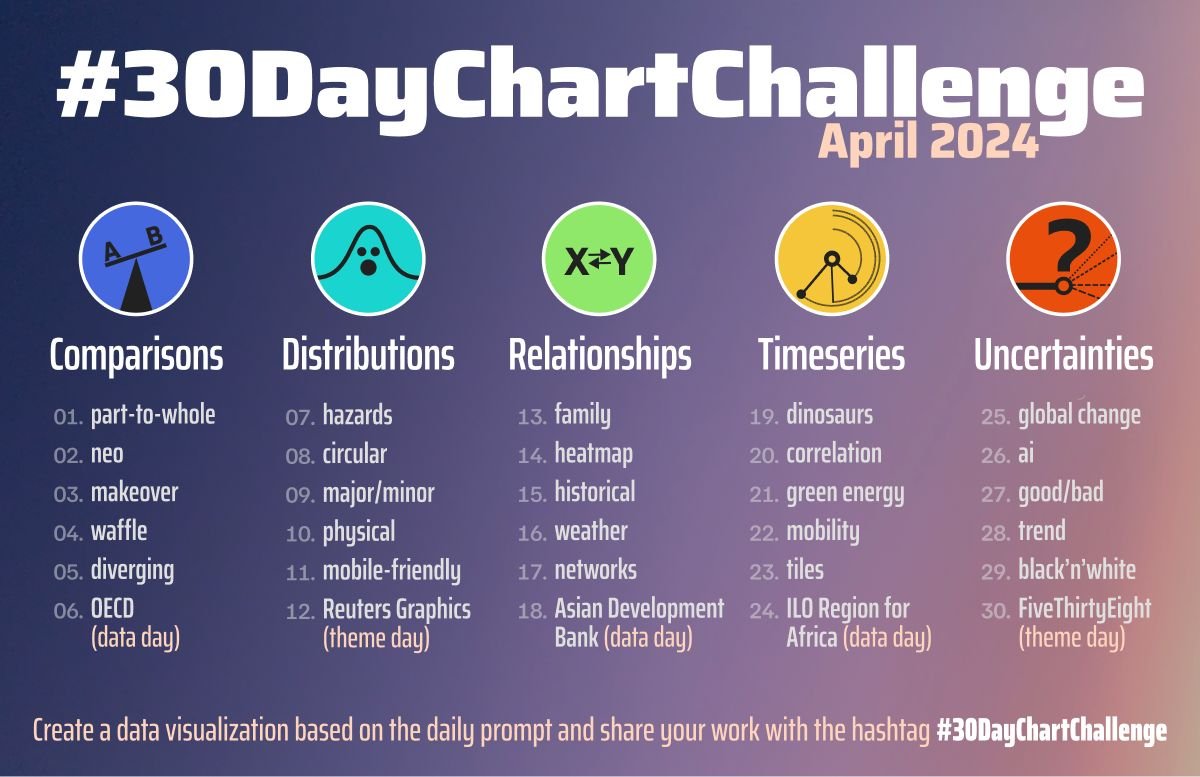
My visualizations for 30DCC. This is my first year participating on this challenge and I feel so happy with the plots I have already made. I decided my plots on 30DCC of 2024 have an unofficial theme specifically with Greece and some other topics that I am concerned about. I hope to like my visualizations. In such a case I would appreciate if you star my repository, as it gives me motivation to go on my journey with R. :)
| Day | Base Geometry | Fonts | Visualization |
|---|---|---|---|
Day 1 Part-to-Whole |
 geom_arc_bar() ggforce |
Josefin Slab Oswald |
 |
Day 4 Waffle |
geom_image() ggimage |
Josefin Slab |  |
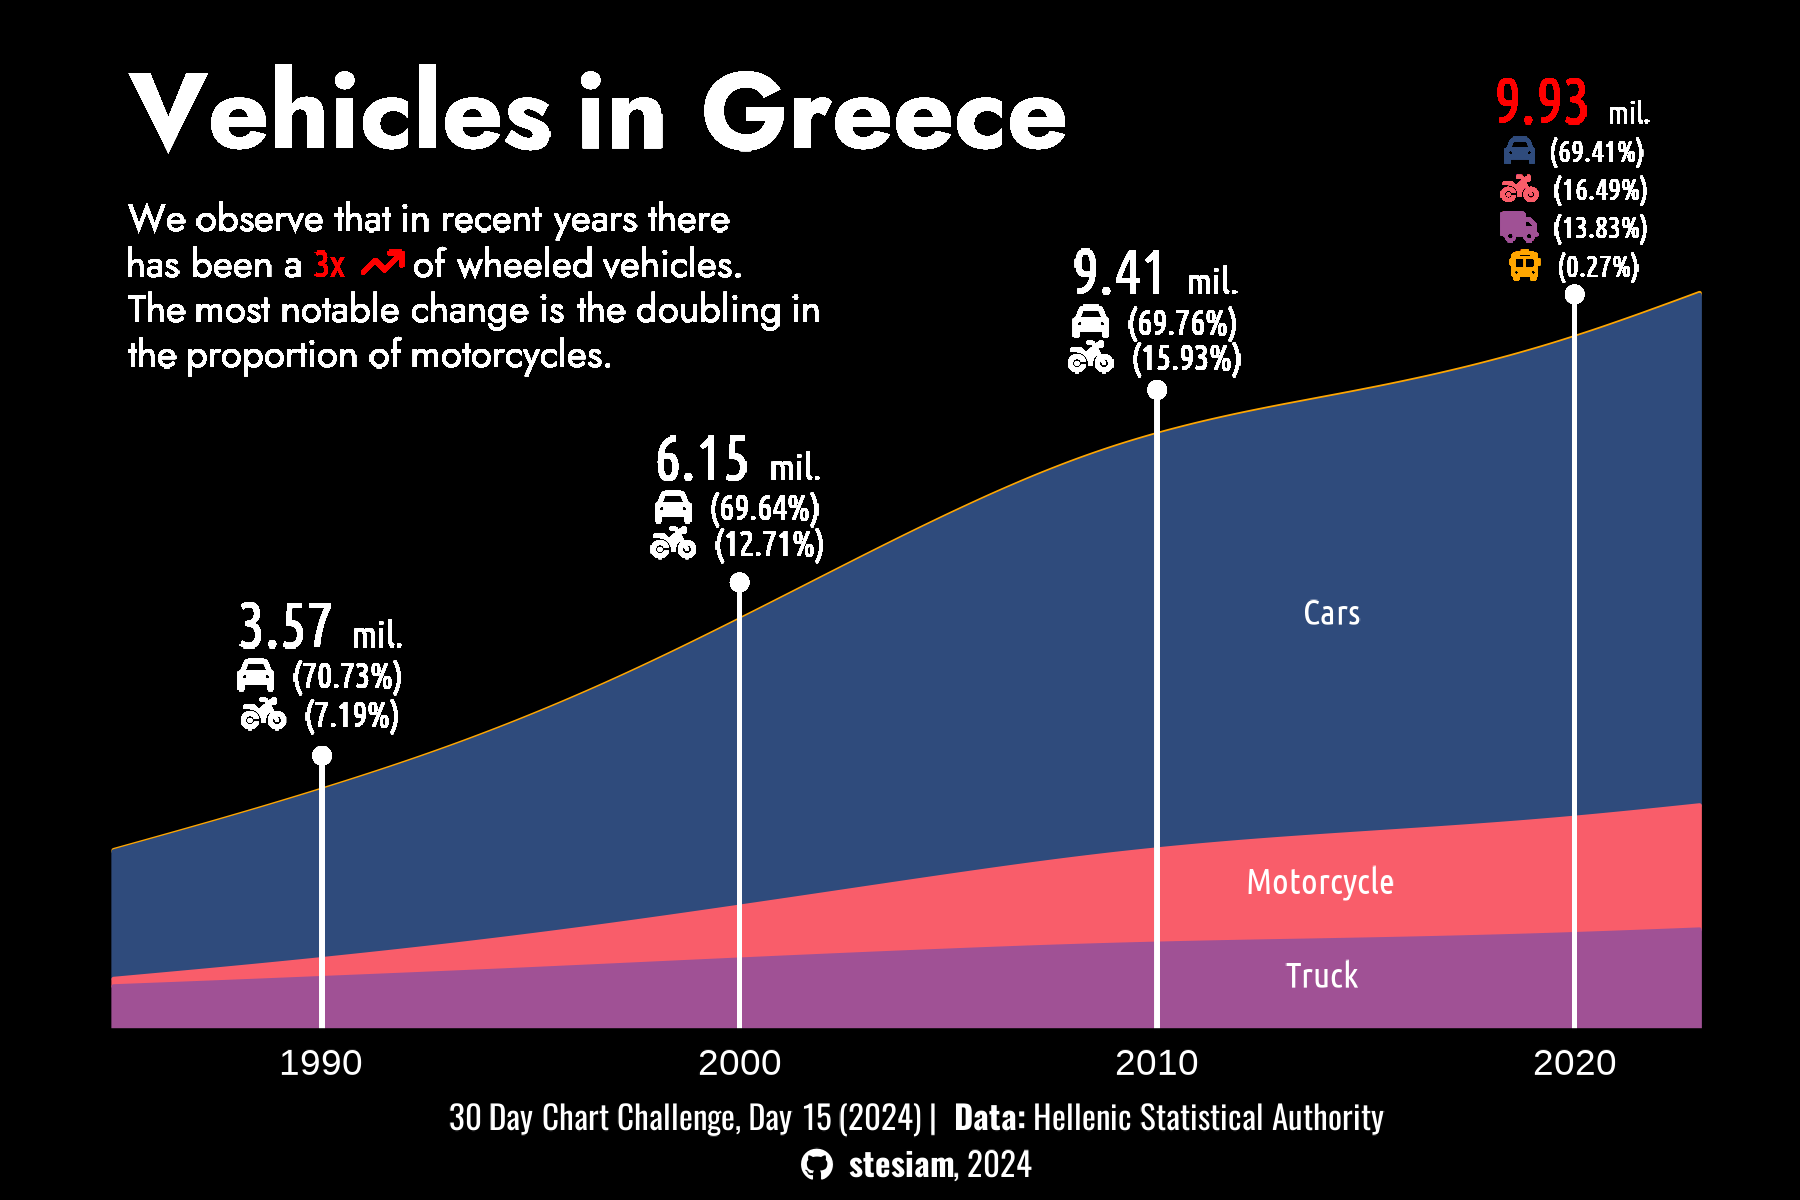
Day 15 Historical |
geom_stream() ggstream |
Jost Oswald Ubuntu Condensed |
 |
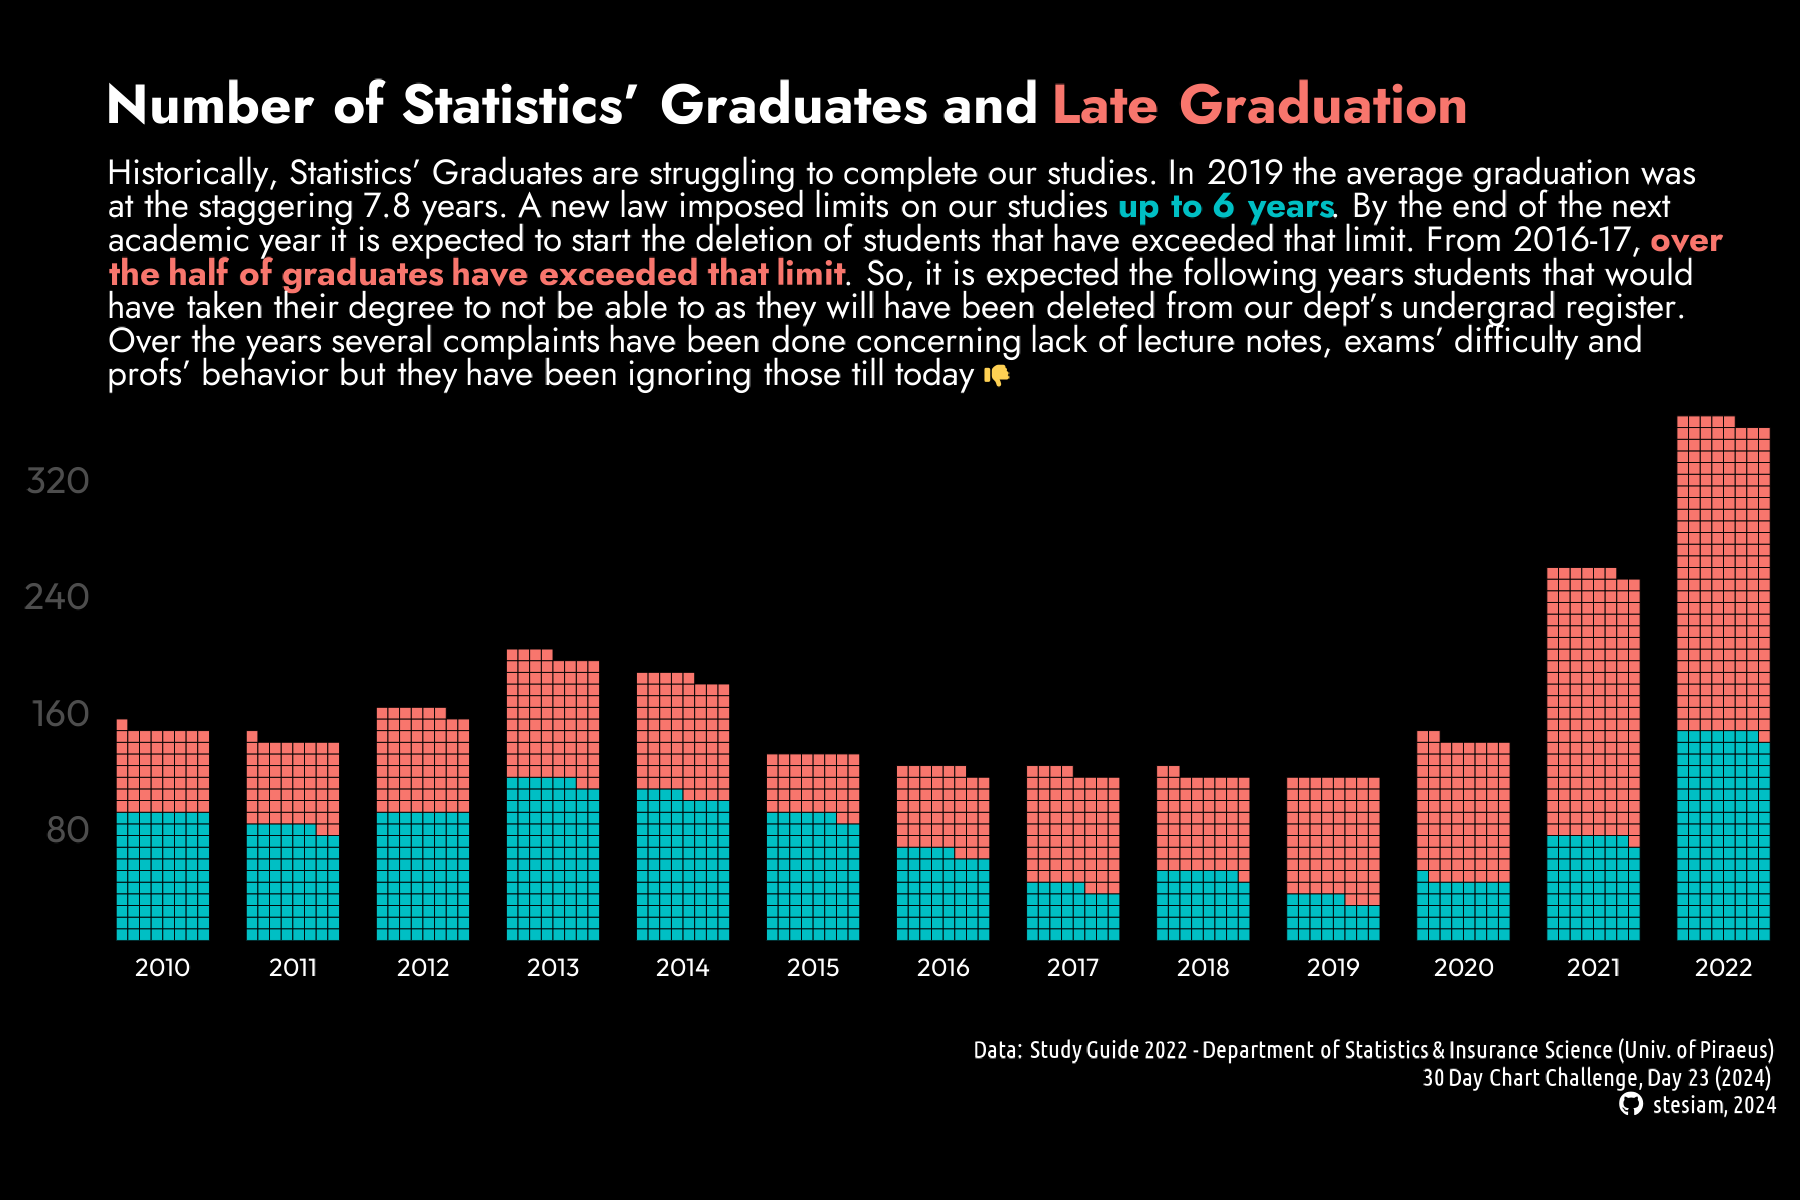
Day 23 Tiles |
geom_waffle() waffle |
Jost Ubuntu Condensed |
 |
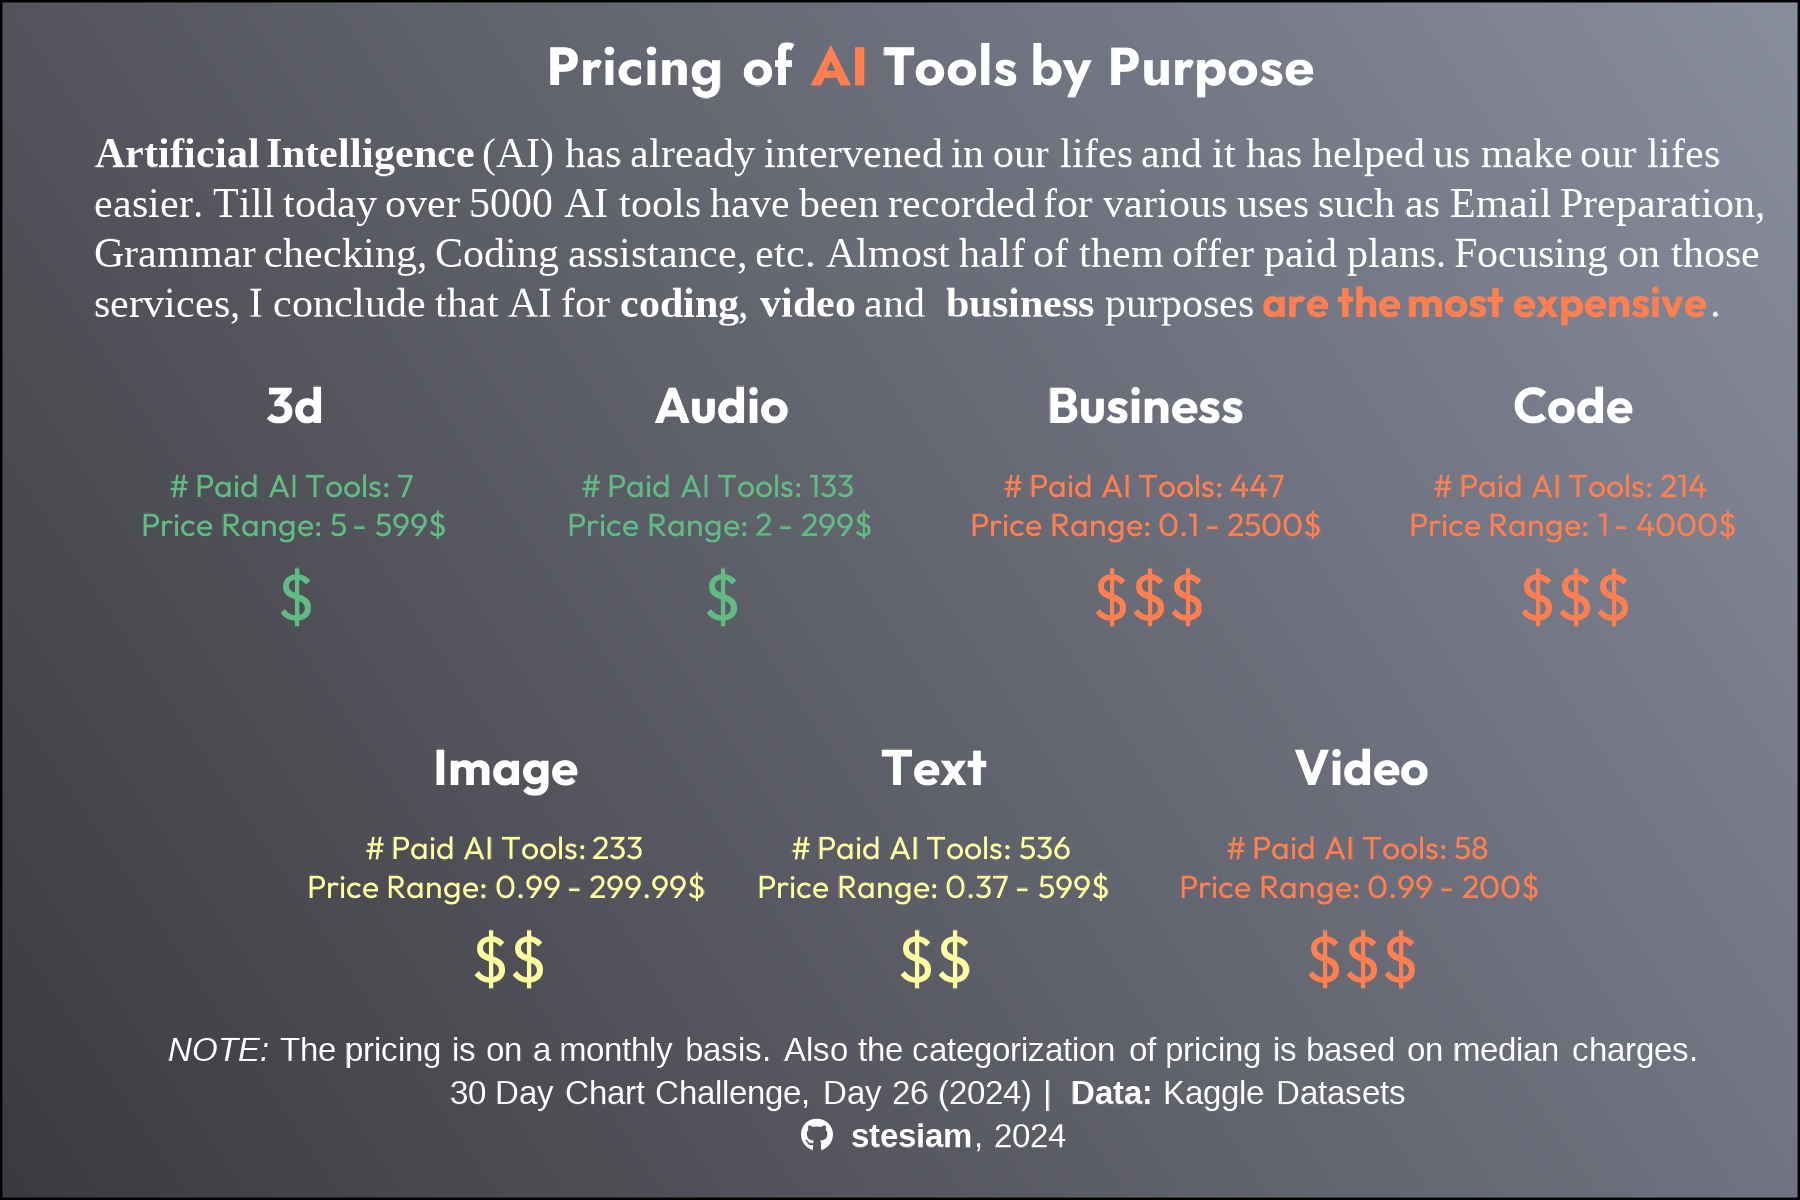
Day 26 AI |
geom_waffle waffle facet_manual ggh4x |
Jost Ubuntu Condensed |
 |
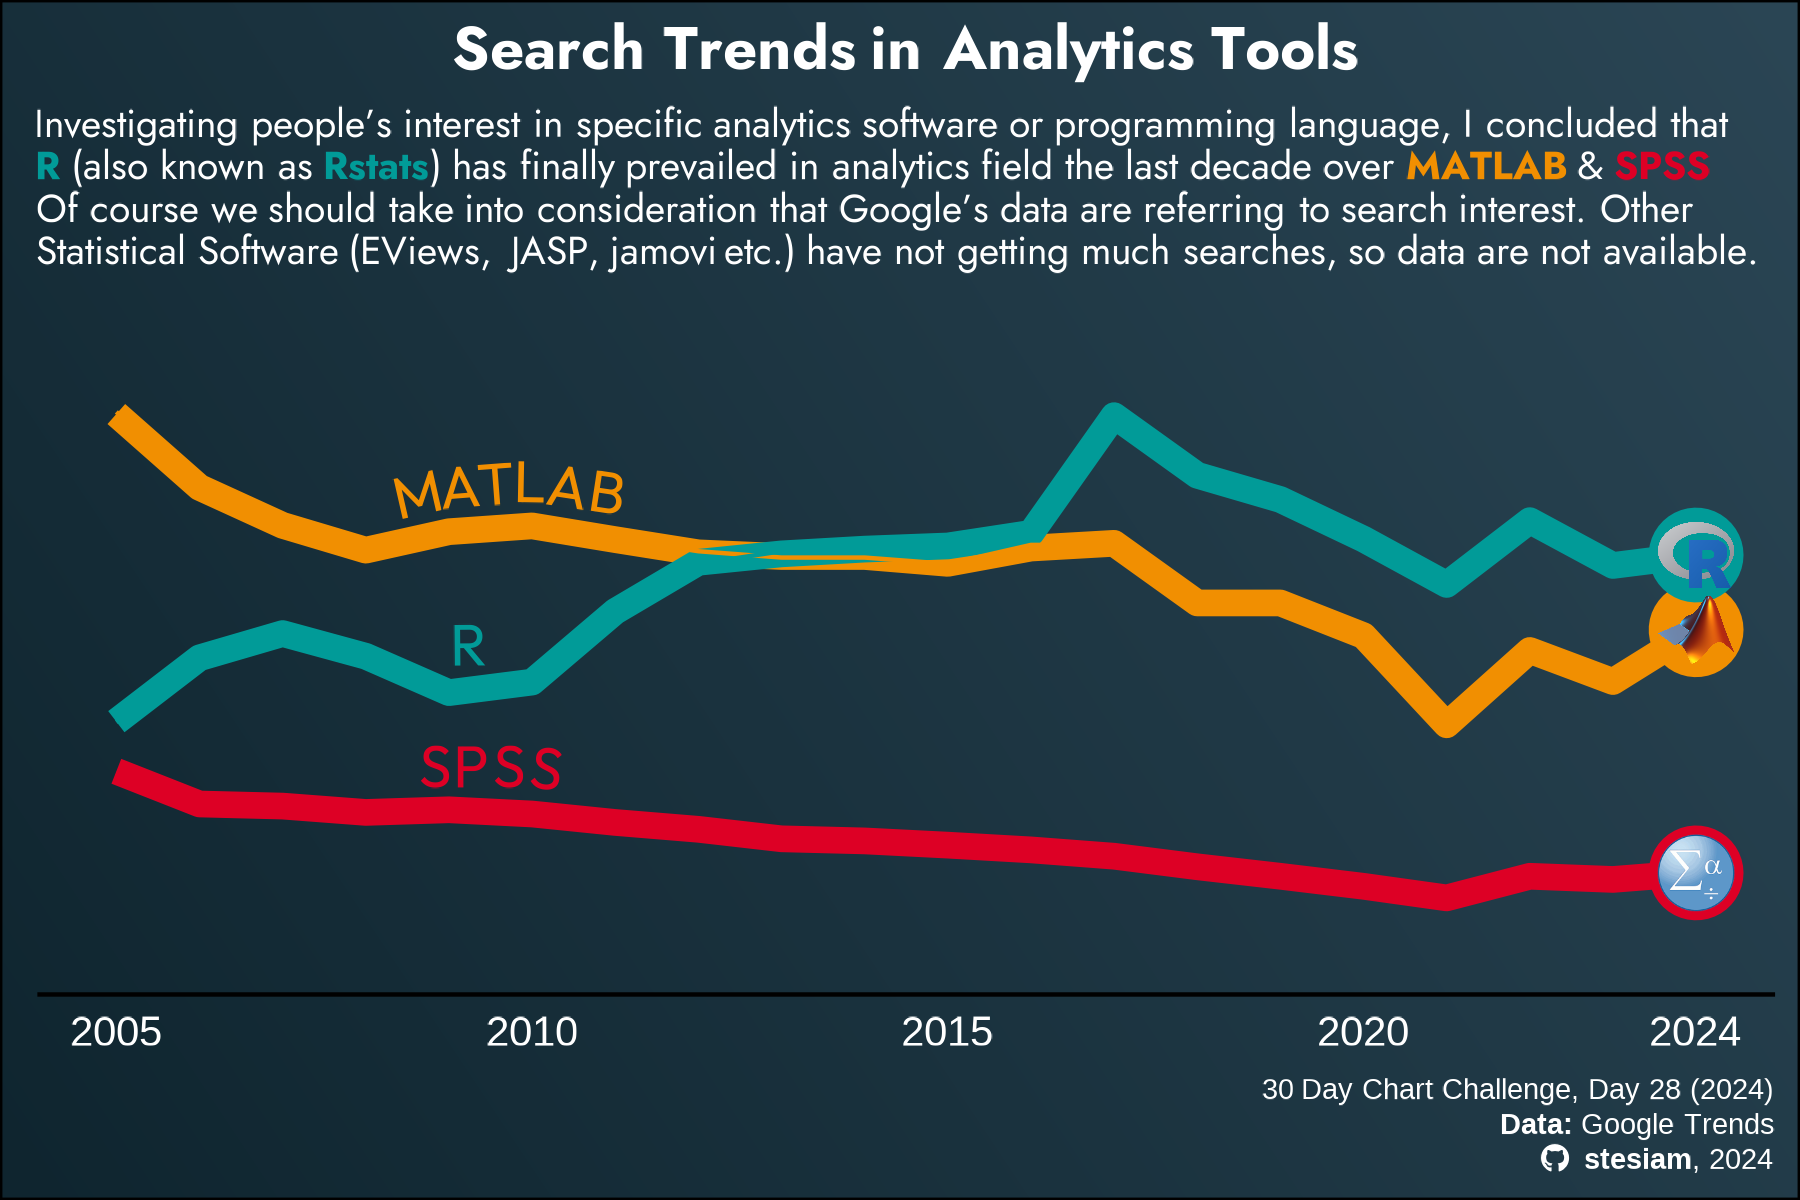
Day 28 Trend |
geom_image() ggimage |
Jost Ubuntu Condensed |
 |
