ioBroker dev-server is a simple command line tool running on Windows, Linux and MacOS that allows you to quickly develop and test ioBroker adapters and their admin interface.
Note: dev-server requires at least Node.js 14.
npm install --global @iobroker/dev-server
dev-server setup
dev-server watch
(a local installation as dev-dependency is also possible)
- Runs on all operating systems supported by NodeJS and ioBroker
- Support for HTML and React UI
- Support for JavaScript and TypeScript adapters
- Hot reload of Admin UI upon any changes to HTML and JavaScript files.
- Hot reload of adapter upon code changes
- Live log in the console
- Debug adapter during start-up
- Multiple "profiles" allow for different datasets
- Multiple instances of dev-server can run in parallel (using different ports)
- All ports are only available locally (127.0.0.1)
- Easy integration in your preferred IDE
It is possible to run dev-server in the root directory of your local copy of ioBroker.js-controller. This way you can debug and work on js-controller itself; watch, debug and debug --wait are all supported.
You need to install the dev-server package as well as set it up it in the adapter directory.
Before installing please check the following what is the best way or recommended:
- Linux
- install it as a dev-dependency of your adapter (recommended)
- install this tool as a global tool
Under Linux it is sometimes useful to install this tool as global BUT best practice for developing an own adapter it is better to install it as dev-dependency
- MacOS
- Under MacOS be careful with installation as global. This is not recommended so better to install it as dev-depency
- Windows
- Under Windows a global install is no problem.
Note: dev-server requires at least Node.js 14.
how to nstall it globally:
npm install --global @iobroker/dev-serverSome more explanation, especially when a global installation is problematic because of permission issues (e.g. on MacOS), you can add the dev-server to your adapter's devDependencies and add it e.g. as a script to your package.json.
{
  "devDependencies": {
    "@iobroker/dev-server": "^x.x.x"
  },
  "scripts": {
    "dev-server": "dev-server"
  }
}
then you can run it via npm run dev-server.
To set up and configure a local dev-server in your adapter directory, change to the base directory of your adapter and execute the following command:
dev-server setupFor additional command line arguments, see blow.
Note: the executable can either be called with the short name dev-server or its full name iobroker-dev-server. We will use the first way in this document.
By default dev-server creates a temporary directory called .dev-server in your adapter directory where all data is stored. This directory must be excluded from NPM and Git.
Your .gitignore file must be extended with a single additional line:
.dev-server/
If you created your adapter using a recent version of Adapter Creator, the .nmpignore file will already contain a pattern matching this folder, otherwise add the above line or simply ignore all "dot"-files and folders:
.*
Usage: dev-server <command> [options] [profile]
All long-running commands can be stopped using Ctrl-C.
The following global options are available for all commands:
--temp <path> Change the temporary directory where the dev-server data will be located (default: ".dev-server").
All commands (except of course dev-server profile) support the [profile] command line argument. It allows the user to use choose between different profiles.
Each profile is a completely independent instance of ioBroker and can run in parallel with other profiles of the same adapter (if different ports are configured).
If no profile is specified on the command line, dev-server will do the following:
- if only one profile exists, it will be used
- if no profile exists, a profile called
defaultwill be created (only valid fordev-server setup) - if multiple profiles exist, the user has to choose one from a list
Set up dev-server in the current directory. This should always be called in the directory where the io-package.json file of your adapter is located.
The following options are available:
--adminPort <number> TCP port on which ioBroker.admin will be available (default: 8081). This port number is also used to generate all other port numbers required to run dev-server. This allows multiple instances of dev-server to run in parallel. It is suggested to use ports in the range of 8000-9999. If you experience connection problems, try a different port.
--jsController <version> Define which version of js-controller to be used (default: "latest").
--admin <version> Define which version of admin to be used (default: "latest").
--backupFile <filename> Provide an ioBroker backup file to restore in this dev-server. Use this option to populate the dev-server with data (and possibly other adapters).
--symlinks Use symlinks instead of packing and installing the current adapter for a smoother dev experience. Requires JS-Controller 5+.
Run dev-server, the adapter will not run, but you may test the Admin UI with hot-reload.
If you start the adapter from Admin, be aware that it will use the code uploaded during setup (or when dev-server upload was called explicitly).
Run dev-server and start the adapter in "watch" mode.
The adapter will automatically restart when its source code changes (with a 2 seconds delay).
DO NOT start the adapter manually in ioBroker.admin! If you see errors like ADAPTER_ALREADY_RUNNING then most likely you ignored this info :-)
You may attach a debugger to the running adapter. Keep in mind that the debugger will be detached when you change your source code, you need to manually attach again to the new process. Watch the console output for the correct process id to attach to.
If you are using TypeScript, make sure you have the watch:ts script defined the same way it is done by Adapter Creator. There is no need to run npm run watch:ts separately, this is automatically done by dev-server.
The following options are available:
--noStart Do not start the adapter itself, but only watch for changes and synchronize them between the development and the temporary directory.
--noInstall Do not build and install the adapter before starting dev-server.
--doNotWatch <filepattern> Provide files and locations relative to adapter base directory that should not be watched for changes. This option can be provided multiple times to ignore several locations.
Run dev-server and start the adapter from ioBroker in "debug" mode.
You may attach a debugger to the running adapter. Watch the console output for the correct process id to attach to.
The following options are available:
--wait Start the adapter only once the debugger is attached. This works the same way as calling iobroker debug <adapter-name>.0 --wait which in itself is similar to node --inspect-brk ...
--noInstall Do not build and install the adapter before starting dev-server.
Update ioBroker and its dependencies to the latest versions.
If you specified --jsController during setup, the js-controller version will not be updated.
Upload the current version of your adapter to the dev-server.
This is only required if you changed something relevant in your io-package.json.
You should only do this when dev-server is not running.
This is a shortcut for npm pack and npm install <package>.tgz.
Create an ioBroker backup to the given file.
Lists all available profiles with their meta-data.
You can of course use dev-server together with you preferred IDE.
The following chapters all assume you have dev-server installed and set up correctly (see above).
Depending on your preferences, you can either start the adapter with dev-server and then attach your debugger or you can start dev-server and then launch the adapter from Visual Studio Code. Both setups are explained below.
If you want dev-server to take care of the adapter by building (if needed), uploading, running and relaunching upon changes, start it from the built-in Terminal in Visual Studio Code:
dev-server watchWhen the adapter is ready, you will see a message like the following:
╭──────────────────────────────────────────────────╮
│                                                  │
│   Debugger is now available on process id 1234   │
│                                                  │
╰──────────────────────────────────────────────────╯
You can now attach the Visual Studio Code debugger to the given process ID:
- Open the Command Pallette (Ctrl-Shift-P)
- Choose "Debug: Attach to Node Process (legacy)"
- Select the right process, it usually looks like follows:
node  --inspect <path to your dev-server directory>/node_modules/...
process id: 1234, debug port: 9229
Now you can set breakpoints (or they are hit, if you set them before) and inspect your adapter while running.
If you want to launch the adapter from Visual Studio Code, start dev-server without the adapter from the built-in Terminal:
dev-server watch --noStartWhen dev-server is ready, you will see a message like the following:
╭──────────────────────────────────────────────────────────────────────────╮
│                                                                          │
│   You can now start the adapter manually by running                      │
│       node node_modules/iobroker.<adapter>/<path-to-main.js> --debug 0   │
│   from within                                                            │
│       <your-project-root>/.dev-server/default                            │
│                                                                          │
╰──────────────────────────────────────────────────────────────────────────╯
Take note of the two paths and create (or extend) a file called .vscode/launch.json:
{
  "version": "0.2.0",
  "configurations": [
    {
      "type": "node",
      "request": "launch",
      "name": "Launch ioBroker Adapter",
      "skipFiles": ["<node_internals>/**"],
      "args": ["--debug", "0"],
      "program": "node_modules/iobroker.<adapter>/<path-to-main.js>",
      "cwd": "${workspaceFolder}/.dev-server/default"
    }
  ]
}
You may now launch this configuration with "Start Debugging" (F5).
Depending on your preferences, you can either start the adapter with dev-server and then attach your debugger or you can start dev-server and then launch the adapter from Webstorm. Both setups are explained below.
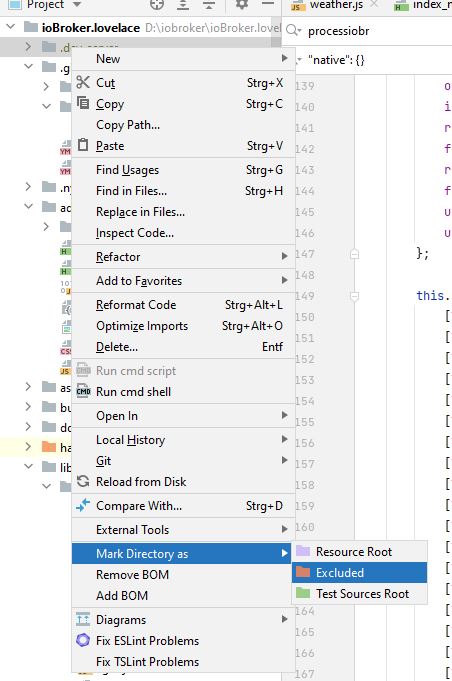
In order to improve performance of Webstorm, I recommend to exclude the .dev-server directory from the context menu (see screenshot). This will prevent Webstorm from indexing the directory, which could take some time.
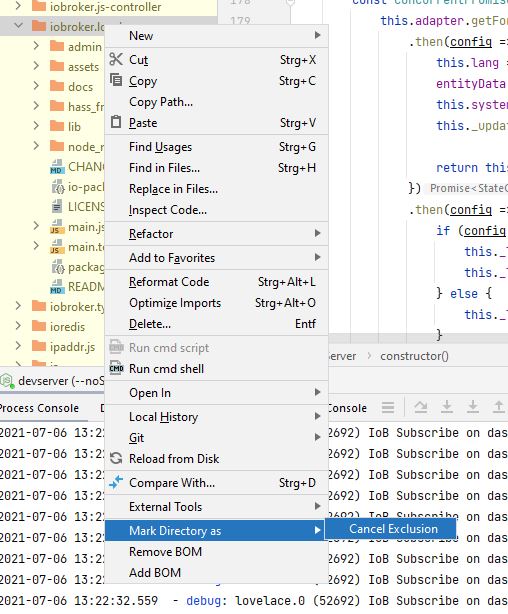
Now cancel the exclusion for the adapter directory in .dev-server\default\node_modules\ioBroker.ADAPTER like in the screenshot below. This is necessary to get breakpoints for the attached/debugged process working again.
If you want dev-server to take care of the adapter by building (if needed), uploading, running and relaunching upon changes, start it from the built-in Terminal in Webstorm:
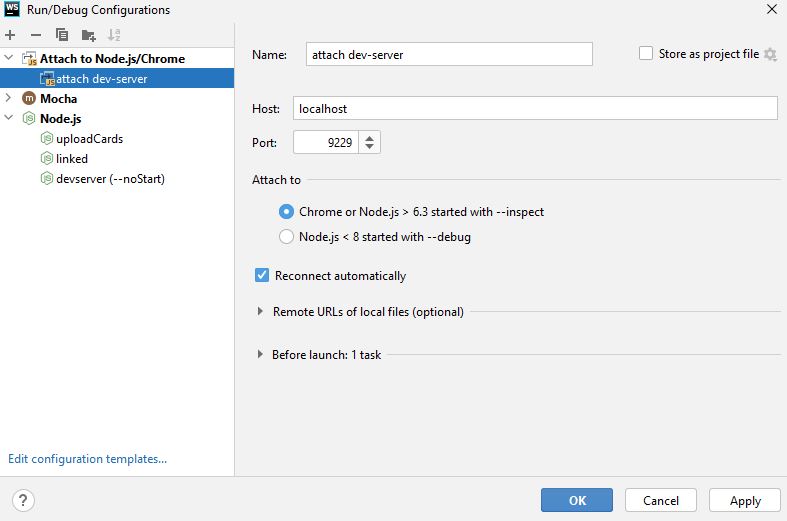
dev-server watchSetup a launch configuration to attach to the process like this:
When the adapter is ready, you will see a message like the following:
╭──────────────────────────────────────────────────╮
│                                                  │
│   Debugger is now available on process id 1234   │
│                                                  │
╰──────────────────────────────────────────────────╯
You can now start the attach configuration and use the debugger console as usual.
If you want to launch the adapter from Visual Studio Code, start dev-server without the adapter from the built-in Terminal:
dev-server watch --noStartWhen dev-server is ready, you will see a message like the following:
╭──────────────────────────────────────────────────────────────────────────╮
│                                                                          │
│   You can now start the adapter manually by running                      │
│       node node_modules/iobroker.<adapter>/<path-to-main.js> --debug 0   │
│   from within                                                            │
│       <your-project-root>/.dev-server/default                            │
│                                                                          │
╰──────────────────────────────────────────────────────────────────────────╯
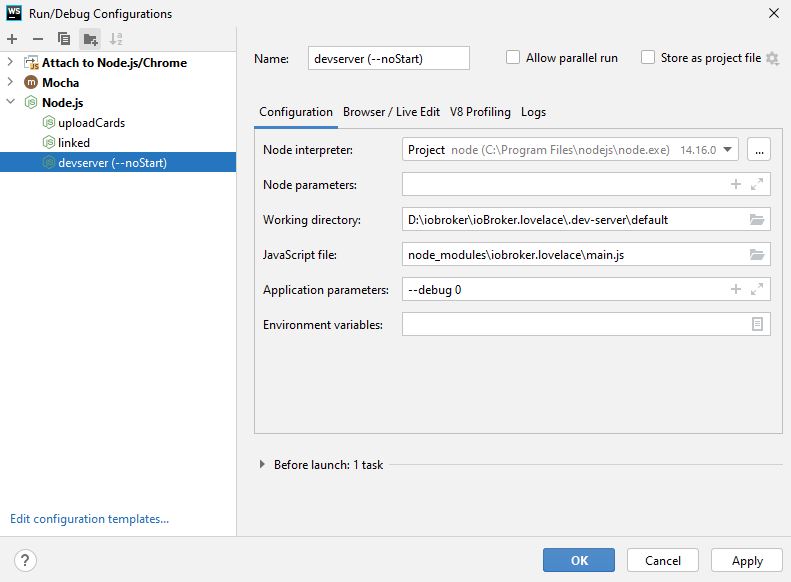
Take note of the paths and setup a launch configuration like in the screenshot below:
Now you can run / debug and restart the process from Webstorm and changes will automatically be synced.


