ValueStream provides a centralized view into key DevOps delivery Events: Issues, Pull Requests, Builds and Deploys. ValueStream comes with a standalone HTTP service that listens for events (webhooks) from a variety of software platforms, and using it is as easy as:
- Starting ValueStream and point it to a metric store: jaeger, lightstep, prometheus
- Configuring a supported Event Source's webhooks to point to ValueStream
ValueStream can help answer:
- What's the deployment rate (per project, type, etc)?
- What's the deployment success ratio (per project, type, etc)?
- What's the average/distribution time of open issues (per project, type, etc)?
- What's the average/distribution of build times (per project, type, etc)?
- What's the average/distribution of deploy times (per project, type, etc)?
- What's the average/distribution of pull request times (per project, repo, etc)?
ValueStream is also a collection of CLI tools to generate performance metrics from third party sources (ie GitHub).
- QuickStart
- Overview
- Local Development
- Configuration
- Roadmap
(Sending Github Issue Data in 1 Minute!)
ValueStream can be started and submitting software metrics in minutes. VIDEO QUICKSTART HERE (video requires docker-compose up -d)
- Start ValueStream Docker Stack (or using Docker image directly)
$ docker-compose up -d
- Tail ValueStream
$ docker-compose logs -f valuestream
Attaching to valuestream_valuestream_1
valuestream_1       | {"level":"info","msg":"initializing tracer: jaeger","time":"2019-07-19T20:12:56Z"}
valuestream_1       | 2019/07/19 20:12:56 Initializing logging reporter
valuestream_1       | 2019/07/19 20:12:56 Initializing logging reporter
valuestream_1       | {"level":"info","msg":"Starting Server: \":5000\"","time":"2019-07-19T20:12:56Z"}
valuestream_1       | {"buffer_percentage":0,"buffer_size":500,"curr_size":0,"level":"info","msg":"buffered_spans_state","name":"github","time":"2019-07-19T20:13:16Z"}
- Setup
ngrokto access your local env
$ ~/ngrok http 5000
-
Point your github webhook at
ngrok -
Start tracking issues and pull requests!
ValueStream offers a CLI for pulling data and generating offline performance reports. Generating a report requires pulling the raw pull request information from a third-party api (GitHub in this case):
$ go run cmd/vsperformancereport/main.go github -org=ImpactInsights -repo=valuestream -per-page=10 -max-page=1 -out=/tmp/vs-prs.csv
This command pulls 10 of the most recent closed pull requests using the GitHub api. Outputs:
$ go run cmd/vsperformancereport/main.go github -org=ImpactInsights -repo=valuestream -per-page=10 -max-page=1 -out=/tmp/vs-prs.csv
INFO[0000] PullRequests.List                             last=unknown page=1
INFO[0000] PullRequests.Get                              curr=0 last=10
INFO[0001] PullRequests.Get                              curr=1 last=10
INFO[0001] PullRequests.Get                              curr=2 last=10
INFO[0002] PullRequests.Get                              curr=3 last=10
INFO[0002] PullRequests.Get                              curr=4 last=10
INFO[0003] PullRequests.Get                              curr=5 last=10
INFO[0003] PullRequests.Get                              curr=6 last=10
INFO[0004] PullRequests.Get                              curr=7 last=10
INFO[0004] PullRequests.Get                              curr=8 last=10
INFO[0005] PullRequests.Get                              curr=9 last=10
INFO[0005] max page: 1 reached
Next is to generate pull request performance metrics:
$ go run cmd/vsperformancereport/main.go agg -in=/tmp/vs-prs.csv pull-request

Key,Interval,Owner,Repo,TotalPullRequests,NumMerged,MergeRatio,AvgTotalLinesChanged,AvgDuration,P95Duration,AvgDurationLine,AvgDurationComment
2020|3_ImpactInsights|valuestream,2020|3,ImpactInsights,valuestream,1,1,1,428,98687,0,0.0043369440757141265,0
2020|1_ImpactInsights|valuestream,2020|1,ImpactInsights,valuestream,3,2,0.67,84.66666666666667,3675.3333333333335,0,0.049723958097649984,0.00022528174109838546
2019|50_ImpactInsights|valuestream,2019|50,ImpactInsights,valuestream,1,1,1,665,8565,0,0.07764156450671336,0.0002335084646818447
2019|49_ImpactInsights|valuestream,2019|49,ImpactInsights,valuestream,2,2,1,220,251010,0,0.5457733277063436,0.004546450739991414
2019|47_ImpactInsights|valuestream,2019|47,ImpactInsights,valuestream,3,3,1,2267.3333333333335,57137.666666666664,0,20.19594165433617,0
These can be easily visualized using any spreadsheet:
ValueStream aggregates data from multiple different system and stores it in a standardize data model based on opentracing specification. Having a standard data model allows for drilling down into individual integrations (think looking at just github pull request metrics) as well as providing cross service view (Tracing delivery time across multiple systems).
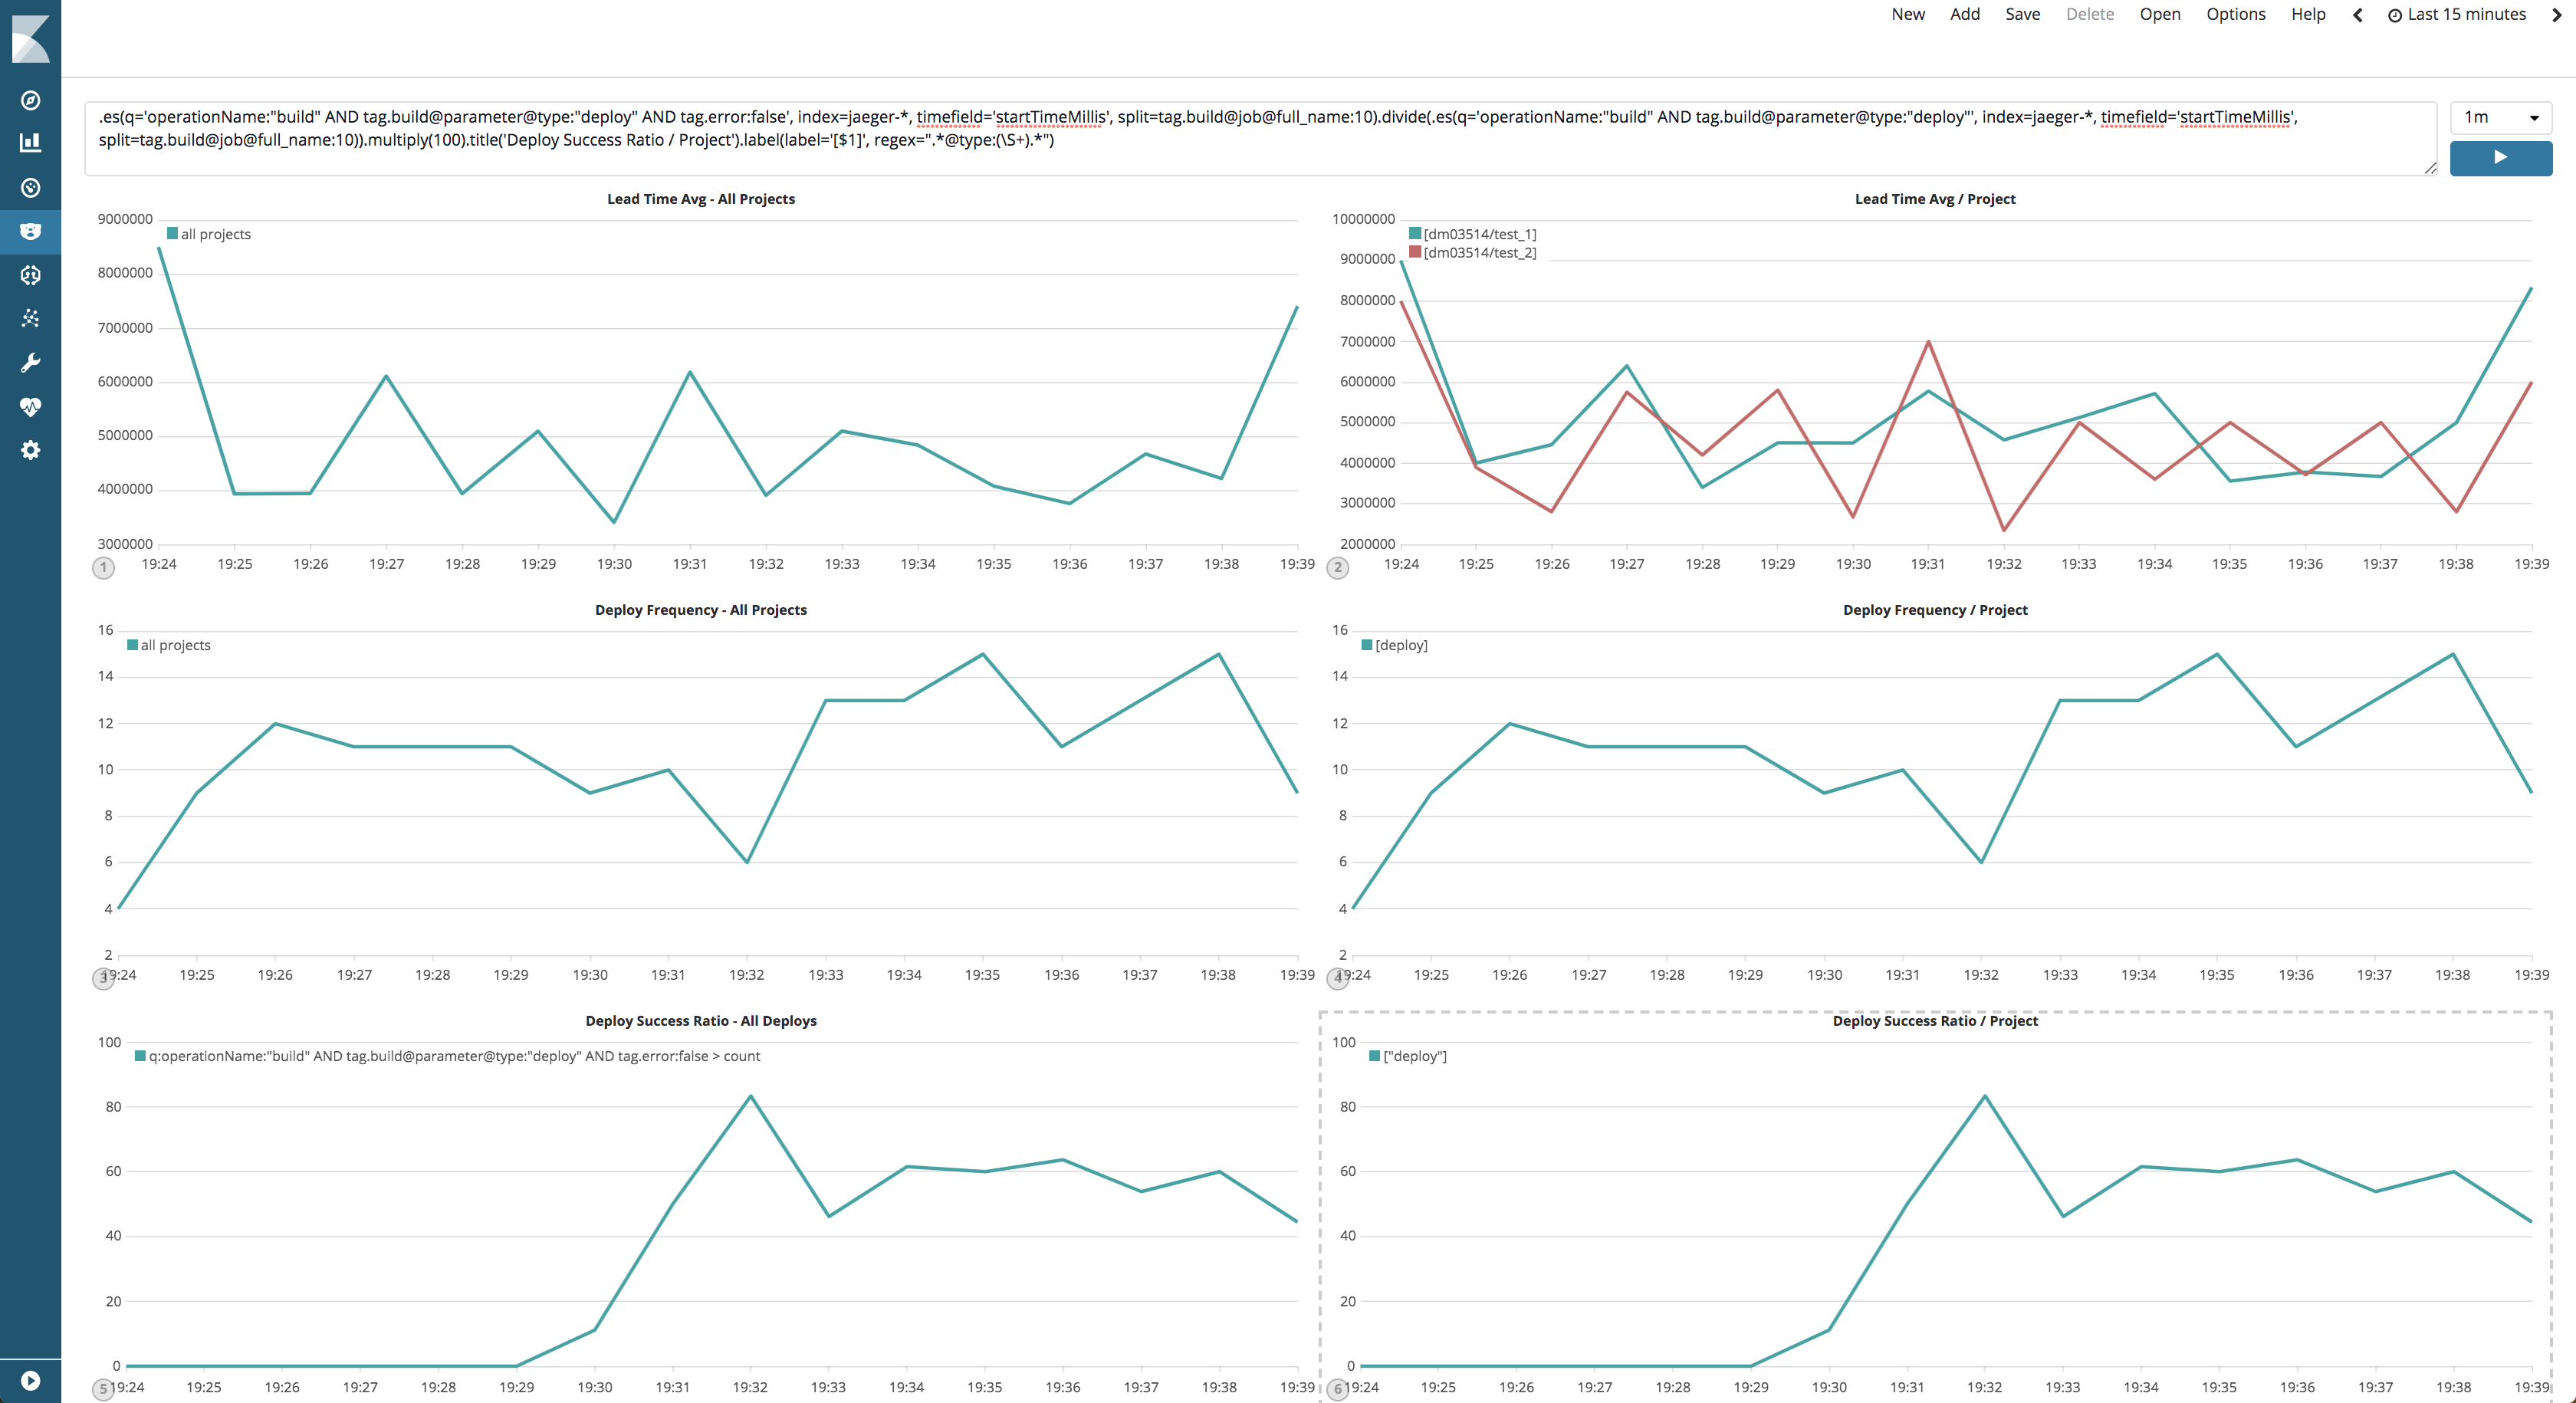
ValueStream is able to provide a cross system view into software development. The dashboard below shows the average lead time across all issues from all systems (currently only Github issues are supported). The magic of having a standardized data model enables the view below to seamlessly work for github issues, jira issues, trello issues, or any other system that supports webhooks. To drive this home consider a company that has code in both Github and Gitlab. ValueStream can provide the average pull request duration across both github and gitlab, as well as the average across just github or just gitlab. It even supports drilling down further by providing the average pull request duration by repo across both github and gitlab.
The real power of value stream comes from being able to tie together all the Delivery events (Issue, PRs, Builds & Deploys) from different sources. When events are connected it is called a "Trace". The image below shows the example of all steps required in order to produce a ValueStream feature:
To generate traces ValueStream leverages the OpenTracing ecosystem. ValueStream must be started using an opentracing compliant backend (jaeger or lightstep). This defines a structured conventions to connecting data from multiple systems and provides mature client libraries and a rich infrastructure ecosystem. In order to use get the most out of ValueStream it must be pointed at an opentracing stack. Jaeger (by uber) is the most popular open source stack and has 8500+ stars on github. Local development of ValueStream is done using jaeger. Any other opentracing compliant stack can be used (Datadog, Lightstep, etc). ValueStream uses LightStep in production for development of ValueStream.
Traces support drilling down into individual units or stages of work in order to see where time was spent in the delivery pipeline. This allows technical executives, managers, directors and VPs to debug software delivery in the same way an engineer debugs a distributed system, using datadriven hypothesis and measuring impact for each change.
- Start ValueStream
$ make start-valuestream-events-test
GO111MODULE=on \
        VS_LOG_LEVEL=debug \
        go run main.go -addr=:7778 -tracer=mock
INFO[0000] building tracer initializer for: "mock"       source="init.go:61"
{"level":"info","msg":"initializing source: \"github\"","time":"2019-12-08T07:11:12-05:00"}
{"level":"info","msg":"initializing source: \"gitlab\"","time":"2019-12-08T07:11:12-05:00"}
{"level":"info","msg":"initializing source: \"customhttp\"","time":"2019-12-08T07:11:12-05:00"}
{"level":"info","msg":"initializing source: \"jenkins\"","time":"2019-12-08T07:11:12-05:00"}
{"level":"info","msg":"initializing source: \"jira\"","time":"2019-12-08T07:11:12-05:00"}
{"level":"info","msg":"Starting Server: \":7778\"","time":"2019-12-08T07:11:12-05:00"}
- Execute Test Suite
$ make test-service-events

TEST_EVENTS_CUSTOM_HTTP_PATH="/customhttp" \
        TEST_EVENTS_JENKINS_PATH="/jenkins" \
        TEST_EVENTS_GITHUB_PATH="/github" \
        TEST_EVENTS_GITLAB_PATH="/gitlab" \
        TEST_EVENTS_JIRA_PATH="/jira" \
        TEST_EVENTS_URL=http://localhost:7778 \
        VS_LOG_LEVEL=DEBUG \
        go test \
                -run TestService \
                -tags=service \
                ./eventsources/... -count=1 -p 1
?       github.com/ImpactInsights/valuestream/eventsources      [no test files]
ok      github.com/ImpactInsights/valuestream/eventsources/github       0.103s
ok      github.com/ImpactInsights/valuestream/eventsources/gitlab       0.121s
ok      github.com/ImpactInsights/valuestream/eventsources/http 0.094s
ok      github.com/ImpactInsights/valuestream/eventsources/jenkins      0.098s
ok      github.com/ImpactInsights/valuestream/eventsources/jiracloud    0.115s
?       github.com/ImpactInsights/valuestream/eventsources/types        [no test files]
ok      github.com/ImpactInsights/valuestream/eventsources/webhooks     0.080s [no tests to run]
- Logging Level - Environmental Variable -
VS_LOG_LEVEL - Tracer Agent: CLI flag
-tracer=<<TRACER>>which supportslogging|jaeger|lightstep-- Both jaeger and lightstep require additional configuration using their exposed environmental variables for their go client
- Data analysis commands
- Trace Strategy
- Trello
- Historical Data Import


