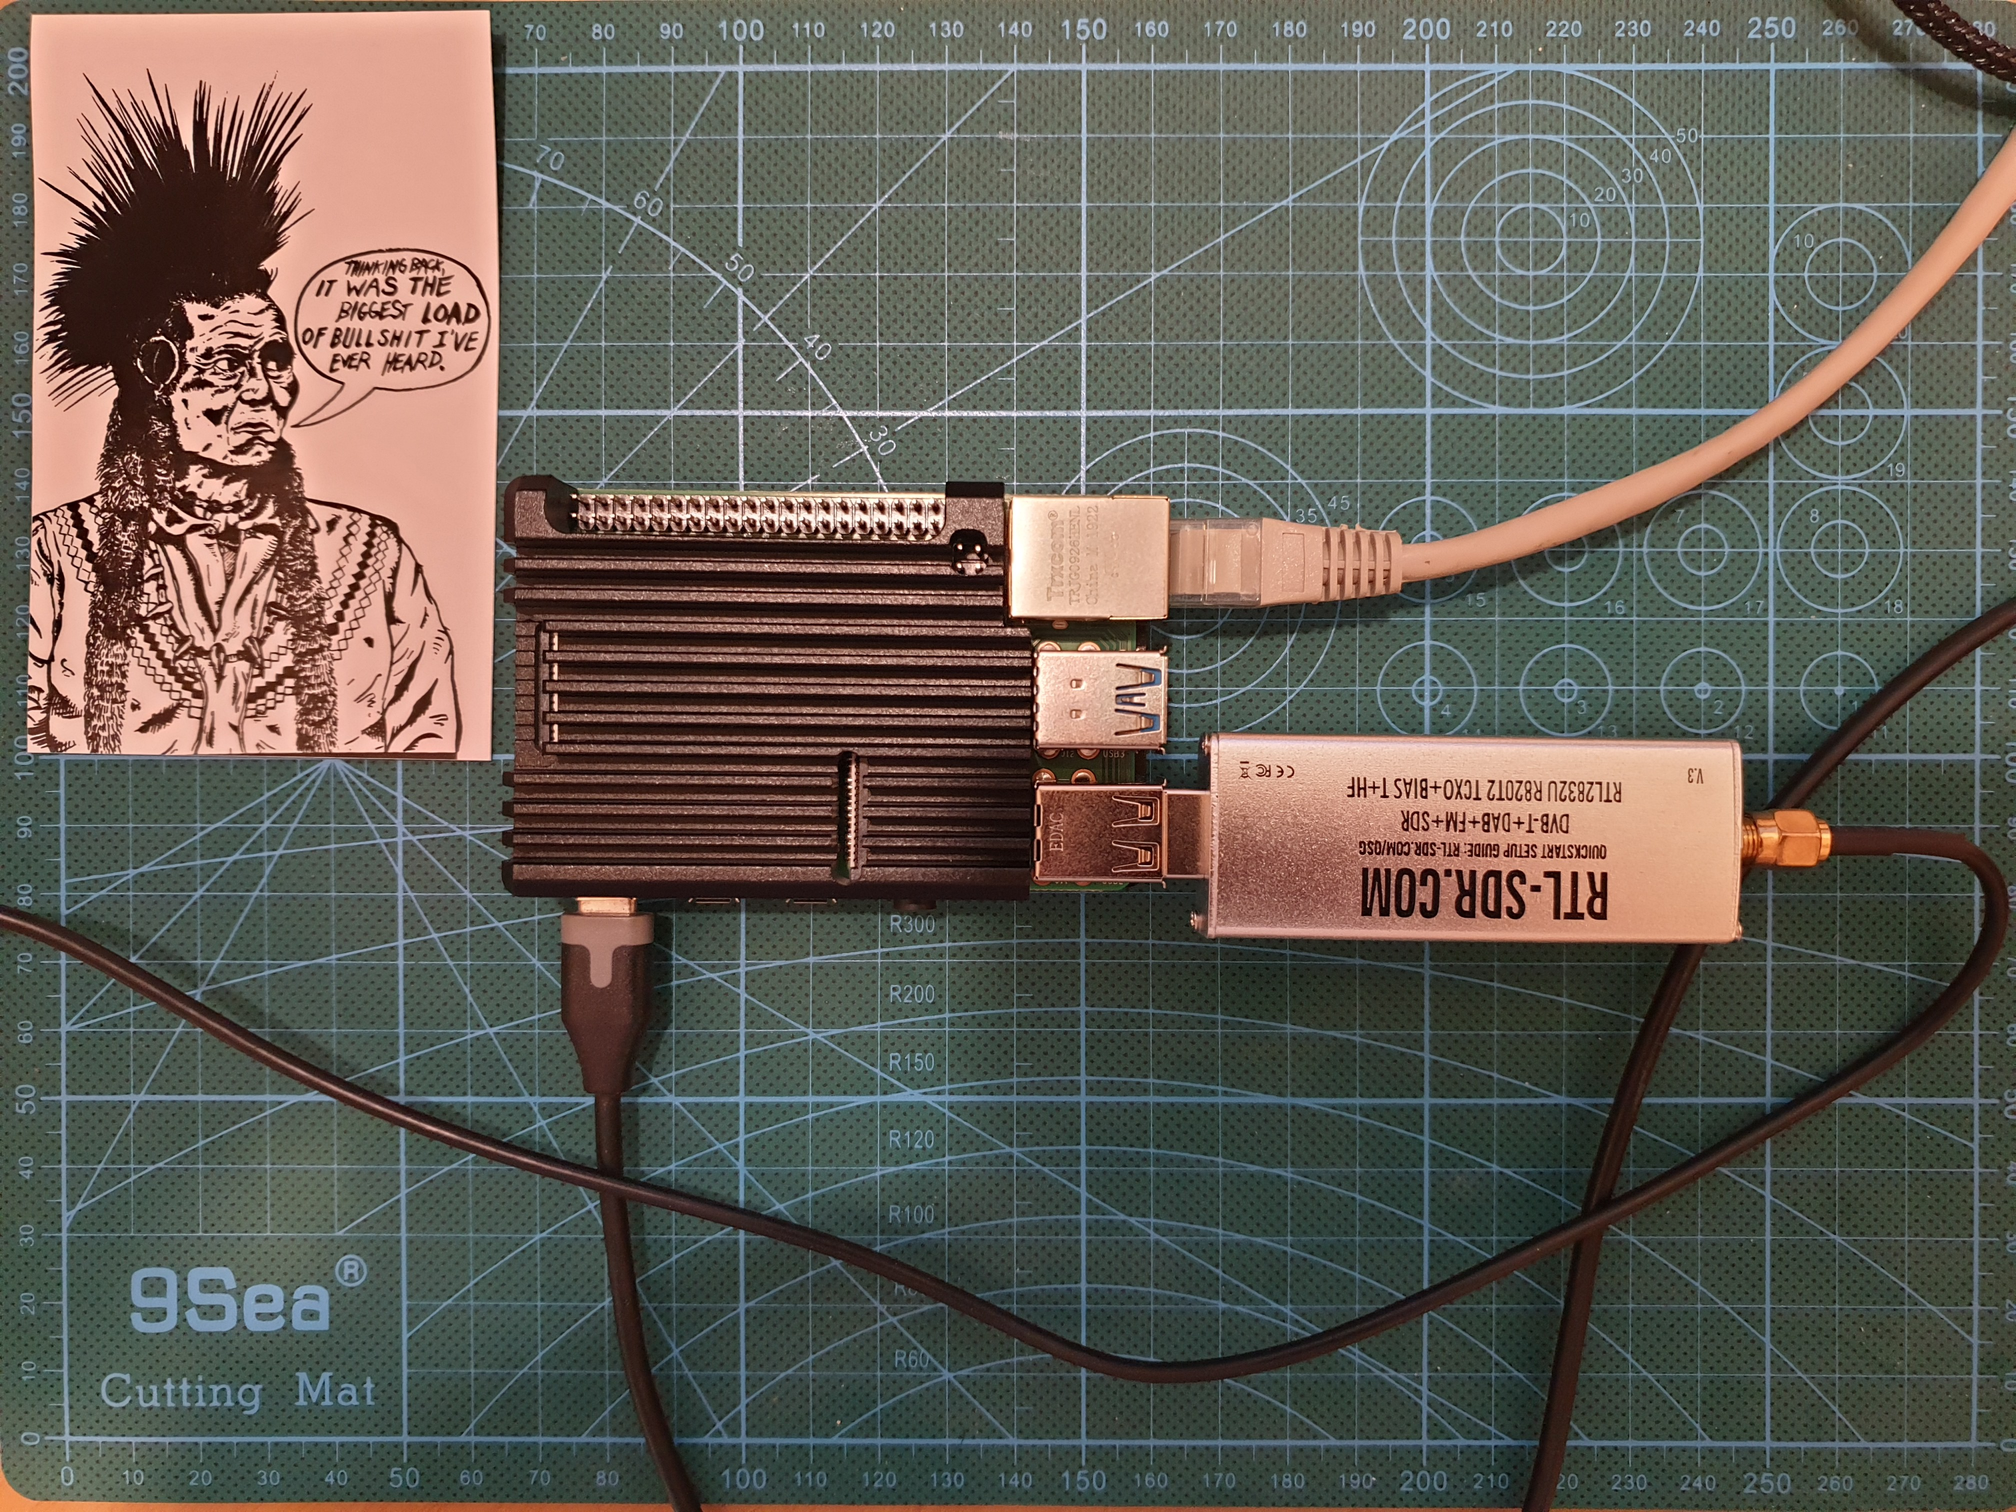
LABStack is a curated and managed collection of IoT services and tools. The stack runs in concert in a containerized environment, typically on a small compute node like a raspberry pi or old laptop. It allows you to get going with current best-of-breed services with minimum effort.
LABStack is also a embedded edge-compute stream processing framework. Messages are ingested from various sources like attached sensors, remote services and the local mqtt message bus. Messages are read, processed and published using the common message bus, and results disseminated via mqtt, node red or any other local process. The principle is that message plumbing and processing facilities are common standard commodities allowing the user to focus on data content and information extraction.
LABStack is intended to be deployed on a Raspberry Pi3 or later running Archlinux|ARM. LABStack also works fine on Raspian or most other system running a recent docker. Archlinux|ARM is preferred as it is more up to date and performant, and seems a better fit for a LAB environment, YMMV. Simple Ansible playbooks are available in the repo to assist with the build-out of the LABStack hosting compute node.
All services are shipped and managed in docker containers with persistent data volumes.
LABStack can be deployed as-is on any existing linux machine with docker already installed by:
- cloning this repo
- run
./up.shin theservicesdirectory
This will download all the images and start the various services. All services in the stack have the restart 'always' restart policy so docker will automatically start the containers after a reboot.
For notes on prepping a new Pi for LABStack on Arch see below. If you just want to stick with Raspian (which is perfectly fine), be sure to install docker and docker-compose.
$ sudo apt-get install docker docker-composeBe sure to add the main user to the docker group to avoid starting the stack
as root.
LABStack makes common IoT services available out of the box, but it does not set up databases or flows, as these would be relatively unique for each environment. It can be the basis of your own more specific stack of course.
Once the stack is up you can
- start adding flows from your data sources
- do message stream processing
- make realtime/current flow visualizations in node-red dashboard
- persist data to influxdb
- visualize your stored data in Grafana
The persistent volumes will keep your flows and data and other configs intact between stack and server drops. Be sure to backup your volumes to keep your data save, if that is important to you.
Typically you would make a bespoke system, perhaps based on LABStack for 'production' flows once you have figured out what you want to do using LABStack, and then migrate that stack to something more permanent and dedicated to that task. In which case volume, flow and data permanence aught to get proper attention, perhaps.
LABStack running on server labstack provides
| Service | Description | Port or URL |
|---|---|---|
| heimdall | Service portal | http://labstack |
| portainer | Container management | http://labstack:9000 |
| influx | Time series database | 8086/8083/2003 |
| grafana | Time series data visualization | http://labstack:3000 |
| node-red | IIOT message switch | http://labstack:1880 |
| mqtt | MQTT Broker | tcp:labstack:1883 |
| telegraf | System metrics harvester | |
| rtl_433 | 433Mhz SDR Dongle message harvester |
With a labstack system running you have most all infrastructure in place to gather, process, visualize and persist data in your home IIOT LAB. Container data is persisted in volumes and can be forwarded to a cloud hosted store if needed.
See the docker-compose file for detail.
Heimdall provides a landing page portal that allows you to configure all your interesting landing pages once so you do not have to remember on which port each service lives. Essentially a bookmarks service with some extra support for specific services.
To get to a specific service browse to http://labstack and click on the relevant service icon. See below on how to rename a typical raspberry pi based LABStack server.
Add links to LABStack services you deem fit and perhaps other links you need quick access to, things you'll typically find in your browser's bookmarks.
Use portainer to manage the individual stack service containers. You can add other services as well. Be sure to add new services to docker-compose.yml with a 'always' restart policy if the service needs to be pulled up with the rest of the stack.
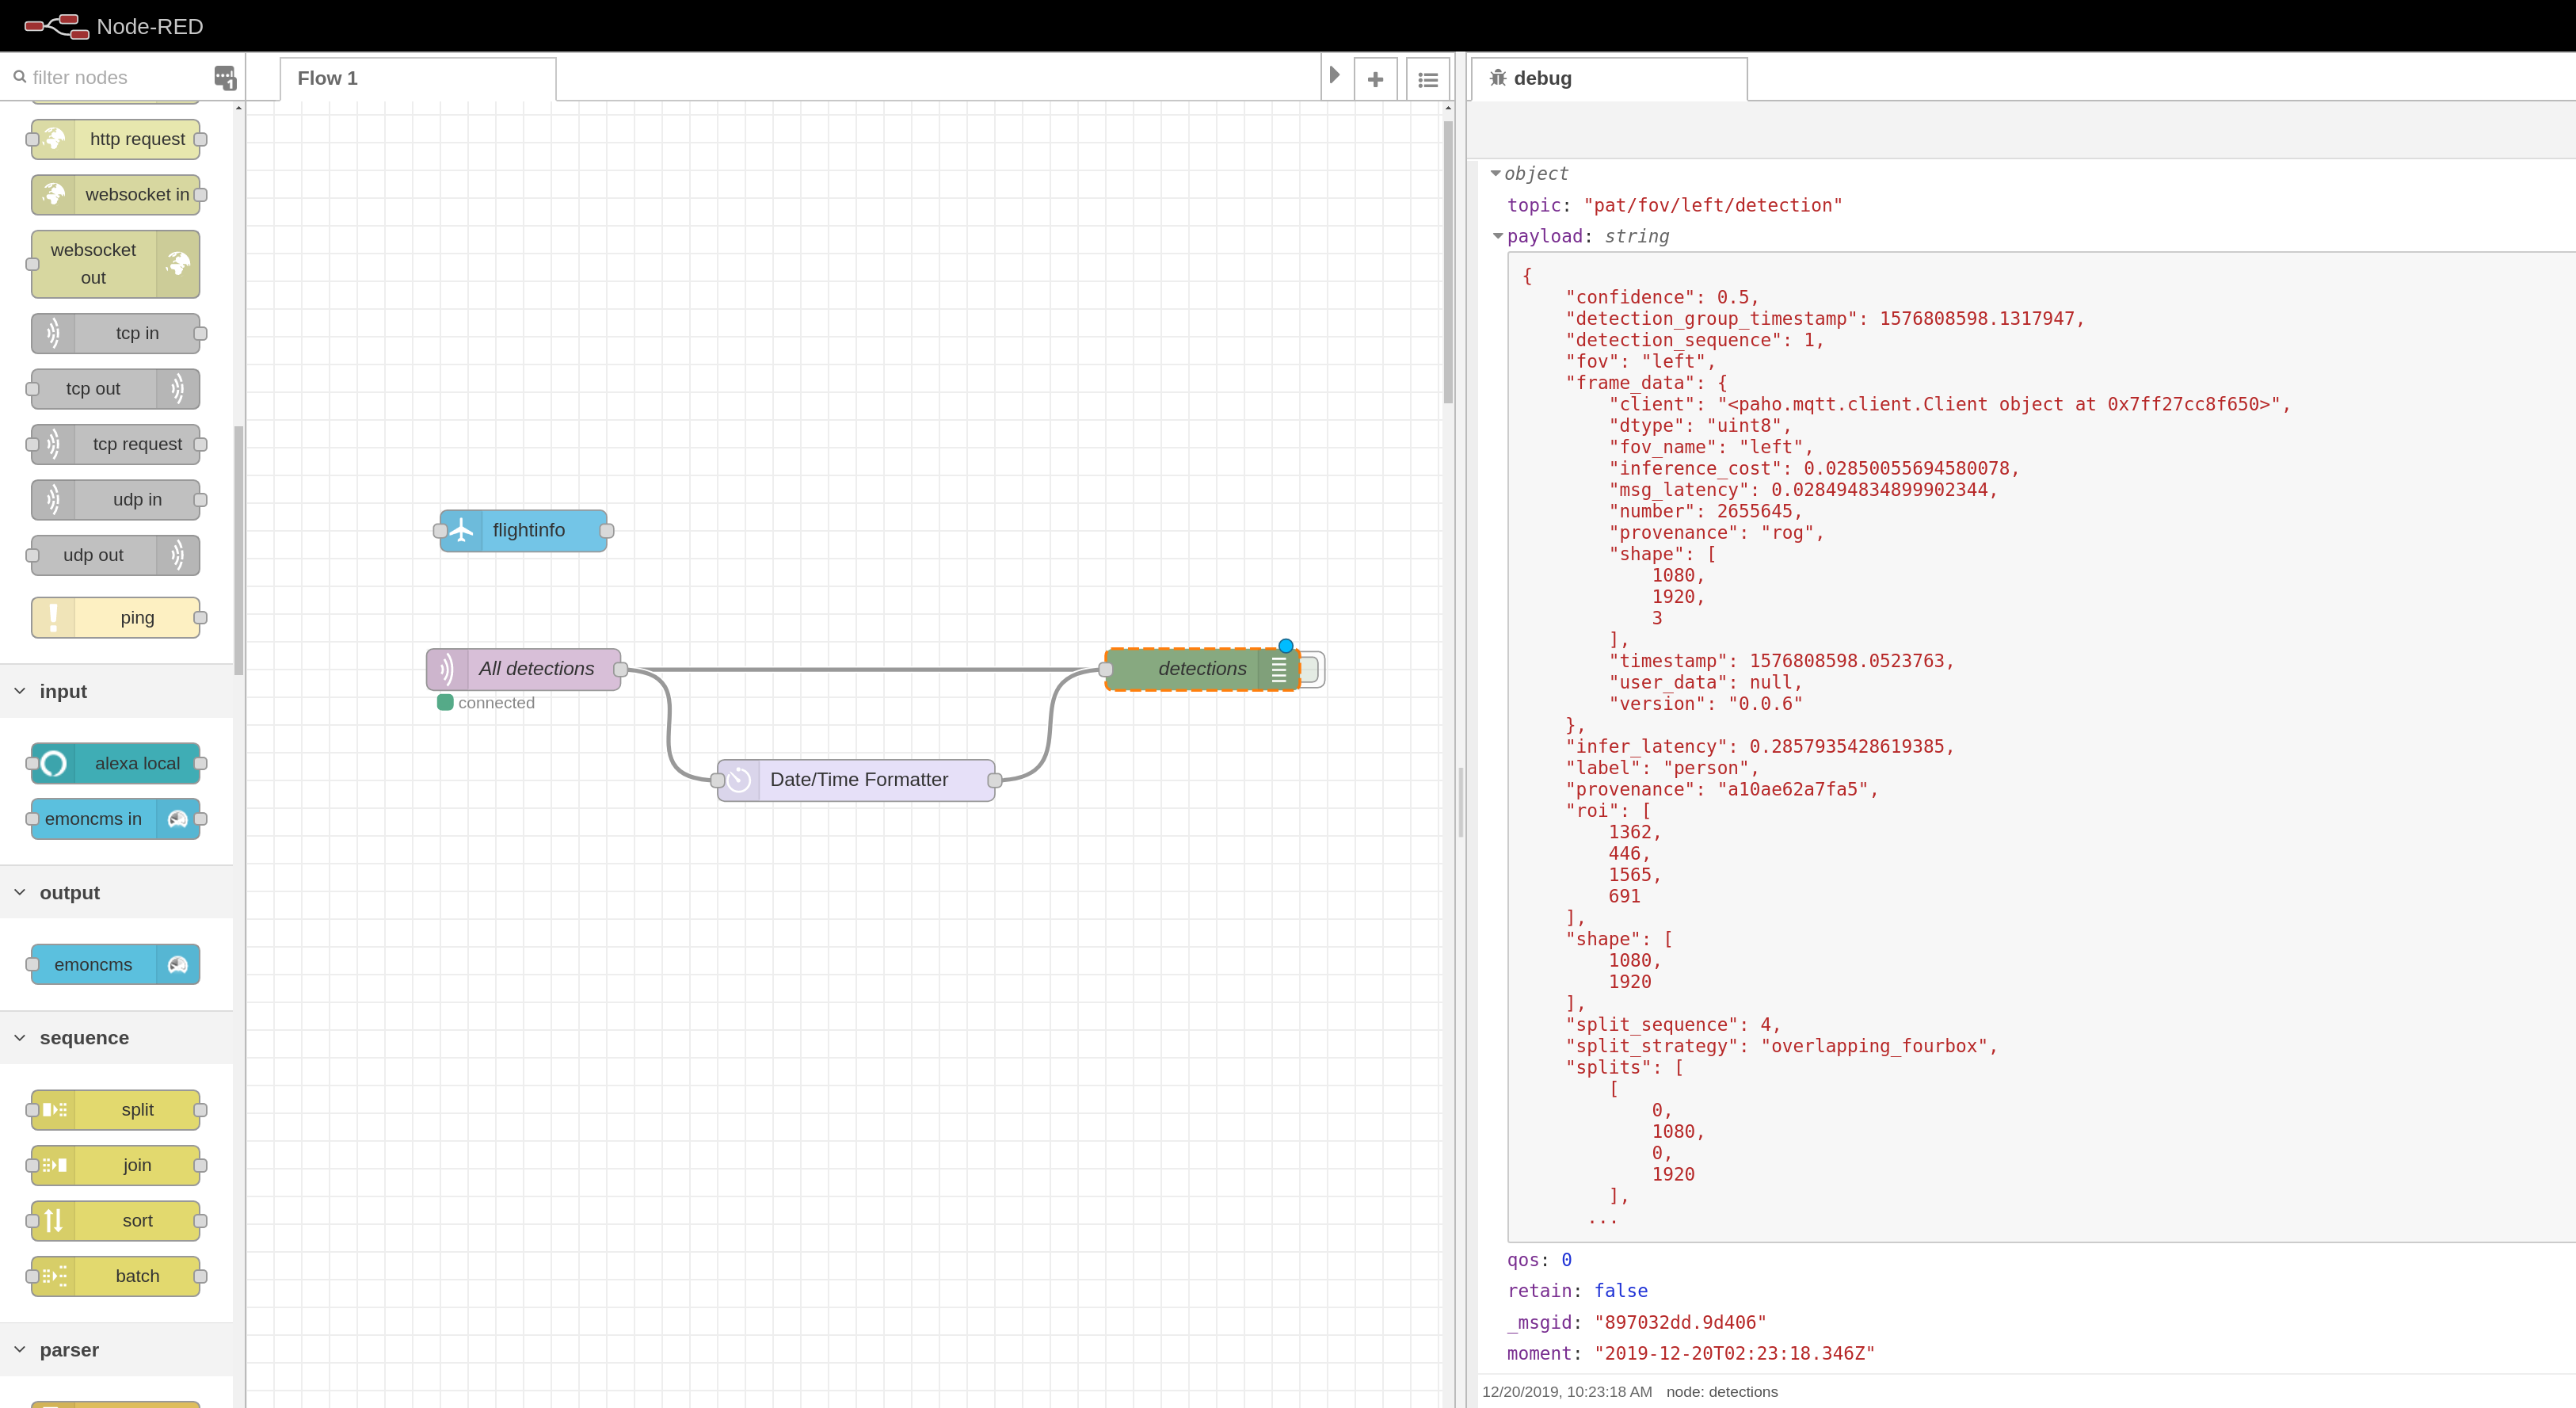
Nodered wired to MQTT allows message management, visualization and processing.
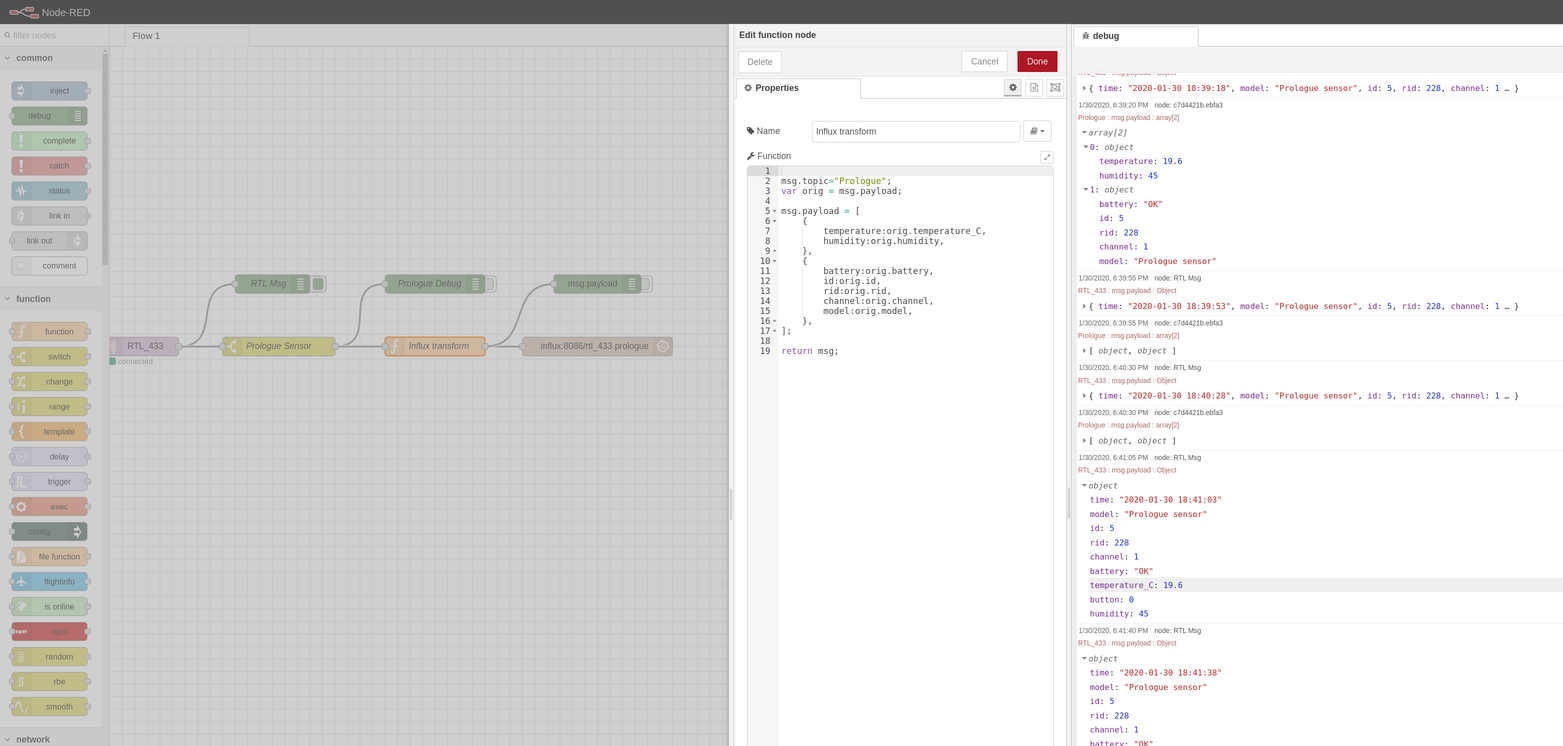
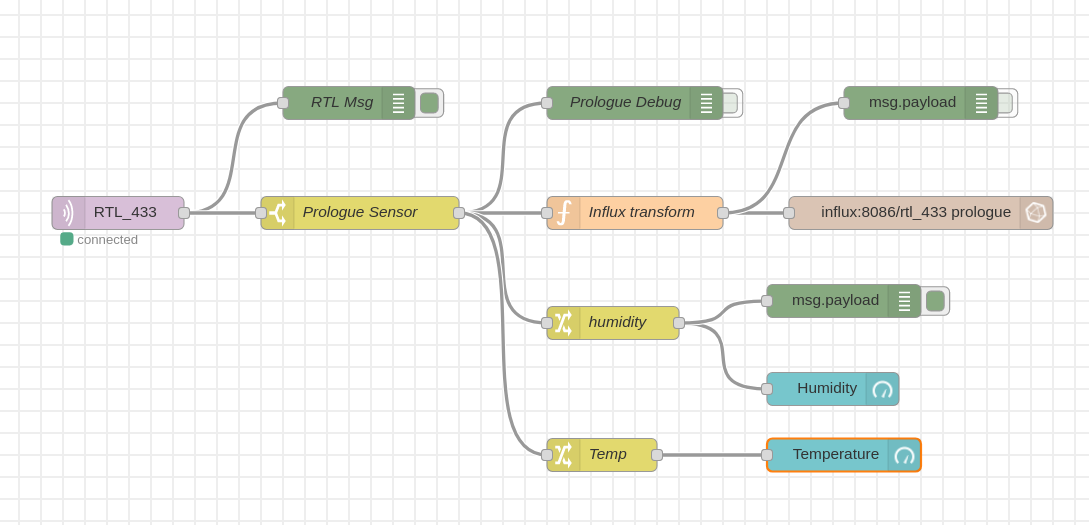
The RTL_433 process uses a software defined radio dongle to receive wireless sensor traffic on the 433Mhz band, and others, decodes the packets and submits data messages to mqtt. Here node red picks up the message, transforms it to influxdb line protocol and writes it to the influx time series database.
The function node example here transforms the rtl_433 message to something the influx write node understands:
msg.topic="Prologue";
var orig = msg.payload;

msg.payload = [
    {
        temperature:orig.temperature_C,
        humidity:orig.humidity,
    },
    {
        battery:orig.battery,
        id:orig.id,
        rid:orig.rid,
        channel:orig.channel,
        model:orig.model,
    },
];

return msg;
Node red's Dashboard facility is fine for quick gauges and graphs if Influx + Grafana is unnecessary. Why not both ?
Specify dash flows using the dashboard widgets
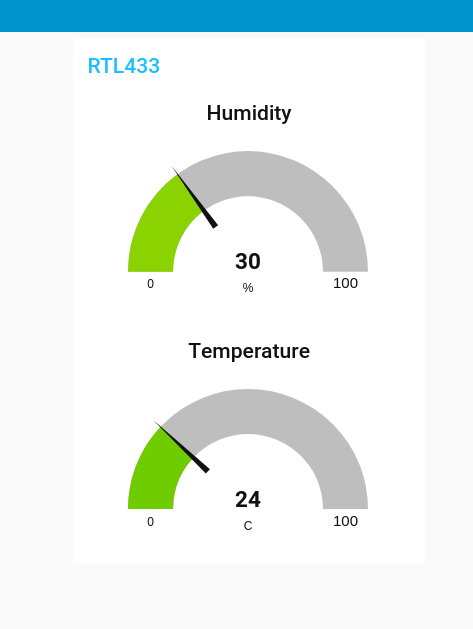
Resulting in a simple Gauge Dashboard on http://labstack:1880/ui like so:
Feed flows in from any other available sources. Here is a another MQTT data source.
The following plugins are available out of the box:
- node-red-contrib-flightaware
- node-red-contrib-alexa-local
- node-red-contrib-bigtimer
- node-red-contrib-blynk-ws
- node-red-contrib-boolean-logic
- node-red-contrib-config
- node-red-contrib-diode
- node-red-contrib-esplogin
- node-red-contrib-file-function
- node-red-contrib-grove
- node-red-contrib-influxdb
- node-red-contrib-isonline
- node-red-contrib-moment
- node-red-contrib-npm
- node-red-contrib-owntracks
- node-red-contrib-particle
- node-red-contrib-ramp-thermostat
- node-red-contrib-timeout
- node-red-contrib-web-worldmap
- node-red-dashboard
- node-red-node-darksky
- node-red-node-emoncms
- node-red-node-geofence
- node-red-node-google
- node-red-node-openweathermap
- node-red-node-pi-gpiod
- node-red-node-ping
- node-red-node-random
- node-red-node-smooth
- node-red-node-sqlite
If a SDR dongle is plugged into the pi, this service will start harvesting 433Mhz messages and publish them to mqtt where node-red and grafana will process and visualize them. They can also be persisted to the influx database.
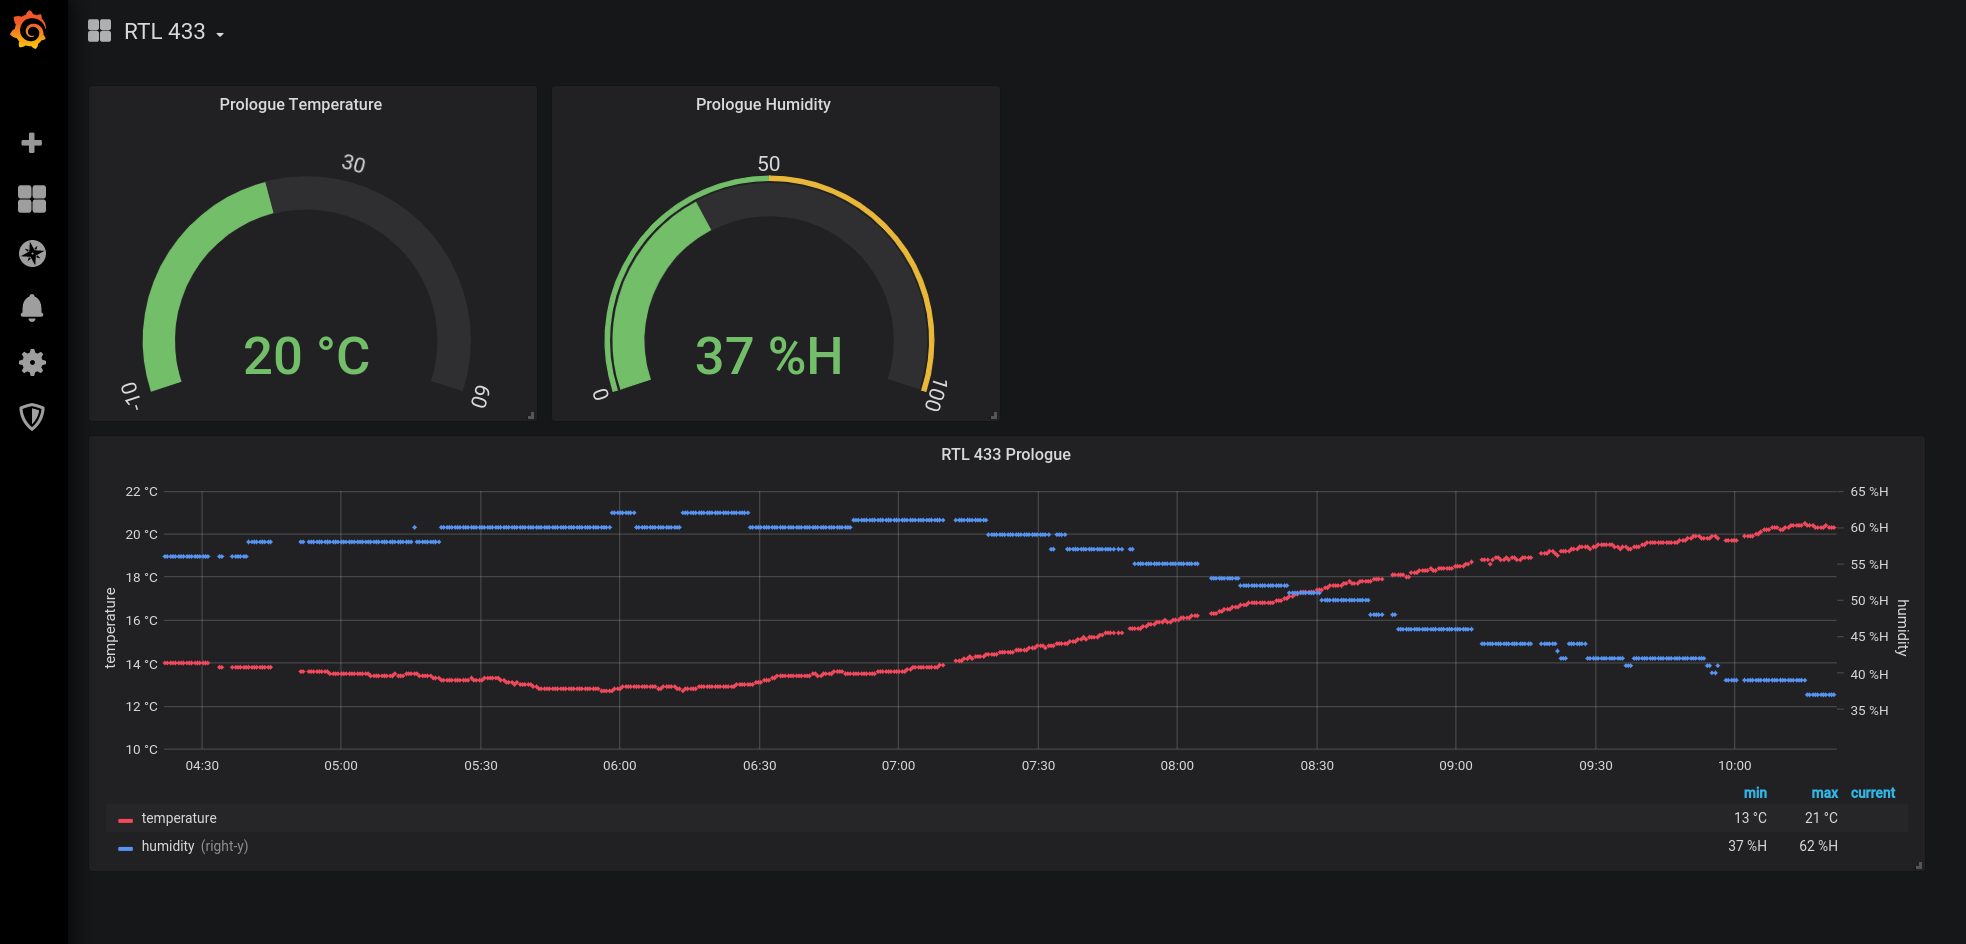
Grafana is used to visualize data available from the influxdb and others. In this example the RTL 433 data from the SDR dongle that was persisted to the influx database is displayed.
In short:
- install a labstack host, something like a recent pi
- Make use of the optional ansible roles to prep the pi for docker and keep things tight
- dotfiles to keep the pi environment sane
- docker-compose is used to maintain the service stack
From Archlinux|ARM install Arch on SD Card.
Boot the pi, find it on the local LAN $ nmap -sn 10.0.0.1/24, its called
alarmpi, user alarm, root password is root, change if so inclined.
ssh to alarmpi
- make a user, say
thys - add
thysto wheel usingvisudo
Like so:
# pacman -Syyu
# useradd -G wheel -m thys
# pacman -S sudo vim
# visudo
Change the server name to labstack for convenience:
$ sudo hostnamectl set-hostname labstack
Check out this repo on the pi and in the ansible directory run ./play. To
run the playbook over the pi from another machine with ansible installed do./play $PI_IP
Once ansible has run to completion start the stack in ~/labstack/labstack/ by running
up.sh.

