Project for Data visualization (COM-480) course @ EPFL
The goal of this project is to analyze the GitHub users’ behavior, explore relations among overall programming language usage and the overlaps in the different languages that programmers use. We also want to show how this changes over time, taking into account monthly activity from February 2011 to the present day. present day.
We use GitHub every day but we don’t know how other people use it and what is the behaviour of users that are programming in different languages and the relations between languages themselves. We wondered do programmers use several languages at the same time and do they "migrate" to new languages when they appear.
Our target audience are both GitHub’s users and newcomers to the programming world who would like to have an overview of the general behavior on GitHub over a specific time period.
Some inspiration for our project can be found on the following links:
- http://githut.info/ (A Parallel coordinates visualization of most used programming languages on GitHub)
- http://blog.coderstats.net/github/2013/event-types/ (A Jupyter Notebook with visual overview of GitHub event types from 2013)
- http://geeksta.net/geeklog/exploring-expressions-emotions-github-commit-messages/ (An exploration of expressions of emotions in commit messages)
- https://www.youtube.com/watch?v=U_LNo_cSc70 (A video showing the analysis of millions of GitHub commits - "What makes developers happy, angry, and everything in between?")
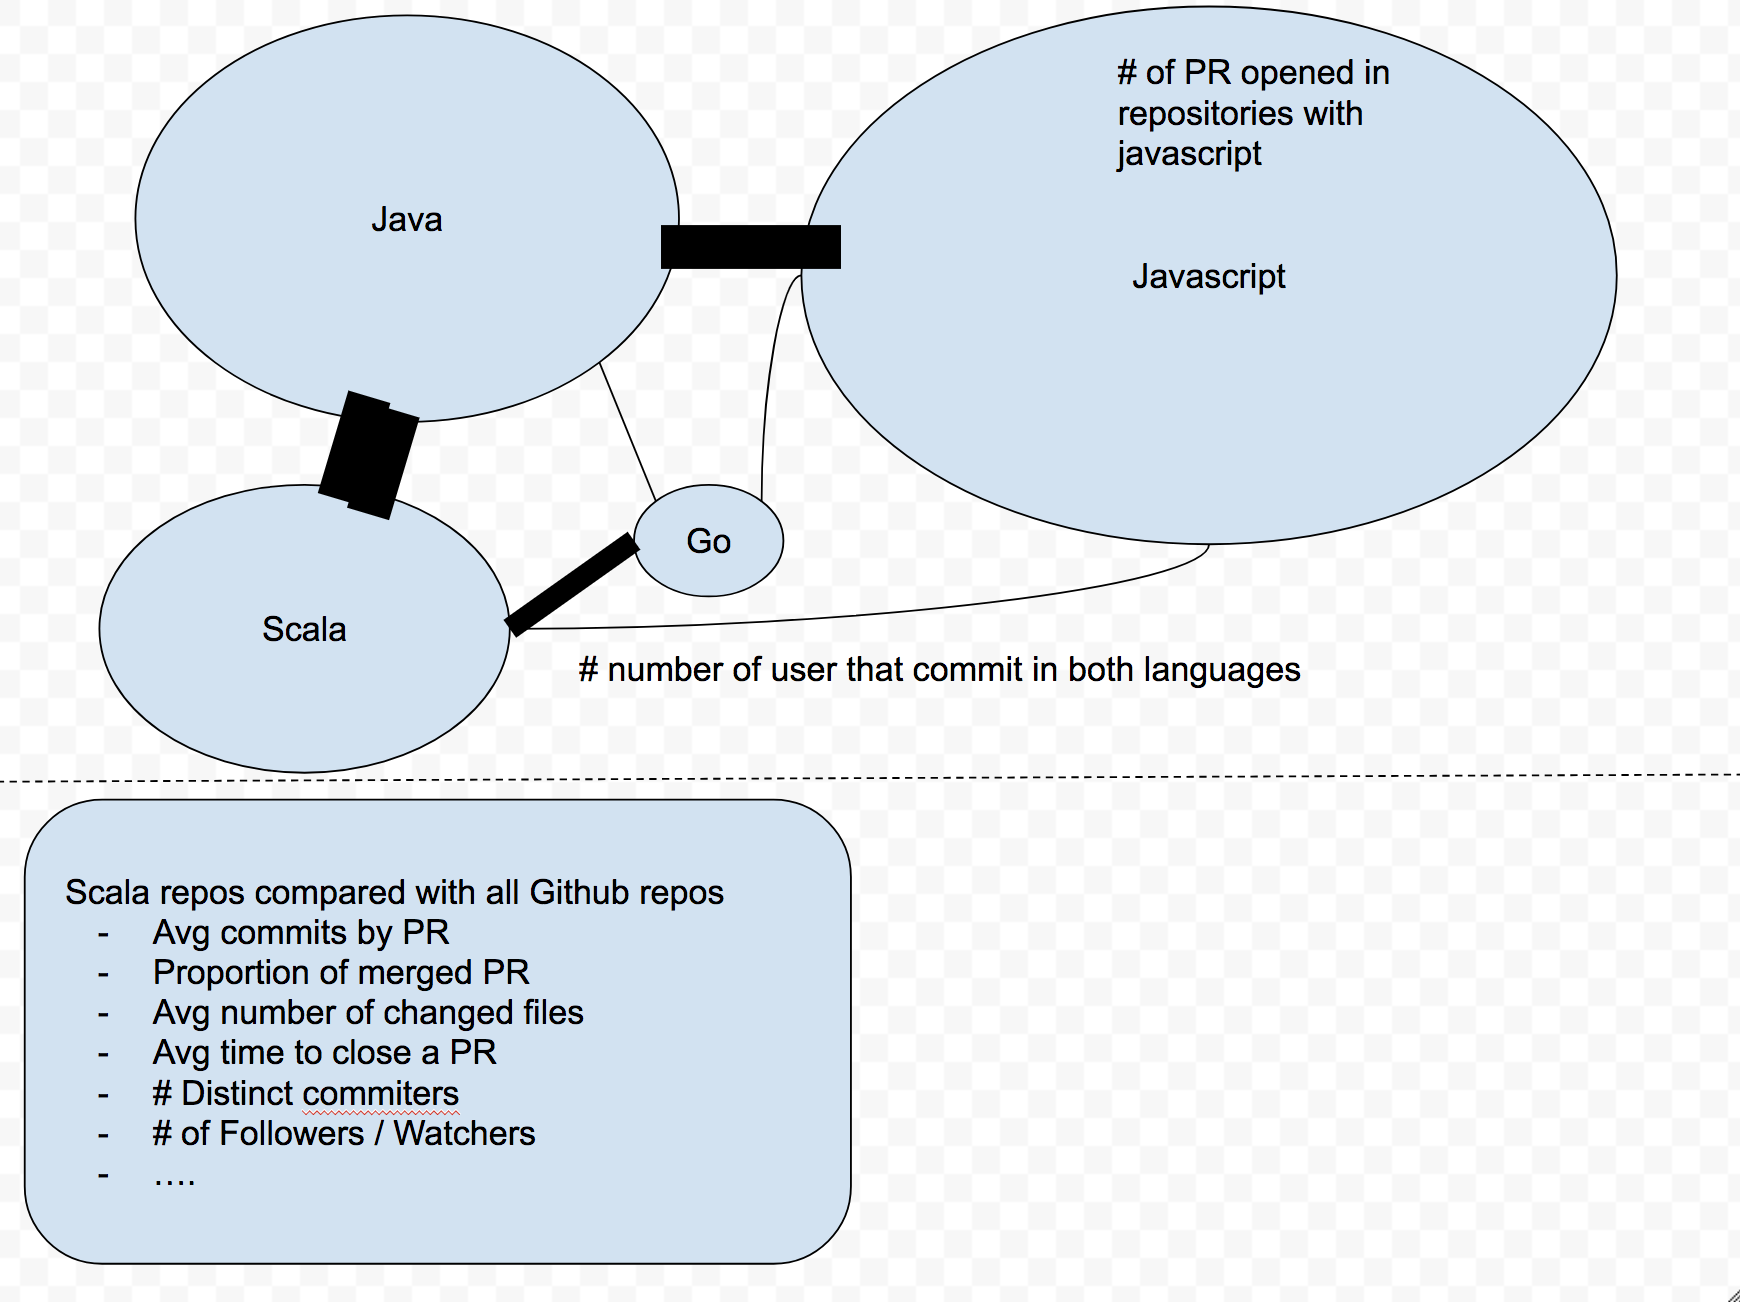
We want to analyze the interaction of users in projects with different programming languages and the number of commits per language and project over time. For instance, do users who contribute to projects in Scala also contribute more to projects in Java or Python? The users will be able to compare one programming language to another with the possibility to see which one is the “closest” to their preferred language. Also, our audience will be able to see a statistical analysis of the usage of the specific language. By selecting a language, the users will be able to see:
- Average number of commits by Pull Request for the specific language
- Average number of changed files by language by Pull Request/Commit
- Average number of forks/watchers/followers
- ...
Possibly show the trends in migrations of programmers from one language to another.
A very broad idea about what we’ll do is in the following image:
The dataset that we will use is the GitHub Archive. GitHub Archive is a project with the aim to record the public GitHub timeline, archive it, and make it easily accessible for further analysis. The data is available from 12. February 2011. with events aggregated into hourly .json archives. It can be downloaded directly via HTTP or accessed with Google BigQuery.
The documentation for the different types of events that are recored in the archive is available on this link.
We might use the information from Google Trends and TIOBE Index to analyze the language’s popularity over time, but this is a topic to discuss yet.
- Filter the database for
PullRequestEvententries. - Remove entries that have a NULL value for the programming language feature (seems to be a small percentage for pull request)
- Analyze this data to reveal the parameters specified above (number of commits by language, file changes by language, number of forks, time between open and close, ...)
In order to run this project you must have npm installed in your machine. Then run:
npm install
npm start
The last command should spin a new browser tab in http://localhost:8080.
To download the data, processing and save you must have installed python3 in your machine and run:
To download:
bash grab_data/download-data.shTo aggregate or build the network run the files grab_data/src/grab_data/aggregate.py and grab_data/src/grab_data/network_matrix.py
