Optimization of loading large json files into database as well as rendering web pages speed with the given amount of data.
- Optimize program to load large.json file within one minute.
- Figure out how we can render schedule pages faster
- gem pghero
- newrelic
- gem activerecord-import
- gem strong_migrations
- benchmark
- apache benchmark testing
- desided to start with
small.jsonin order to increase feedback loop - extracted logic from rake tasks in it's own service so that it's easier to test.
- wrote test for loading
.jsonfiles - by implementing any changes on database level I made sure tests are passing and my benchmark metrics show better results
- I decided to insert records not one by one, but in bulk (for this I used gem activercord-import). I accumulate model instances in hashes. This allows quickly access the required instance by key, as well as avoid duplicate records. As a result, all imports are done in four inserts.
- I used Oj gem for parsing json.
- CPU time
- system CPU time
- the sum of the user and system CPU time
- the elapsed real time. The unit of time is seconds.
Initial results of running bundle exec rake 'reload_json_benchmark[fixtures/small.json]' and bundle exec rake 'reload_json_benchmark[fixtures/medium.json]':
Results of running be rake 'reload_json_benchmark[fixtures/small.json]' after optimization and using gem oj, gem activerecord-import:
-
I added a test that checks the response from the problematic endpoint in order to prevent logic changes.
-
To assess the effectiveness of the changes, I used apache benchmark tools (10 requests with concurrency 1). The measurements were made on the basis that was imported from the small.json file.
-
To find bottlenecks I used Newrelic, rails console and gem pghero
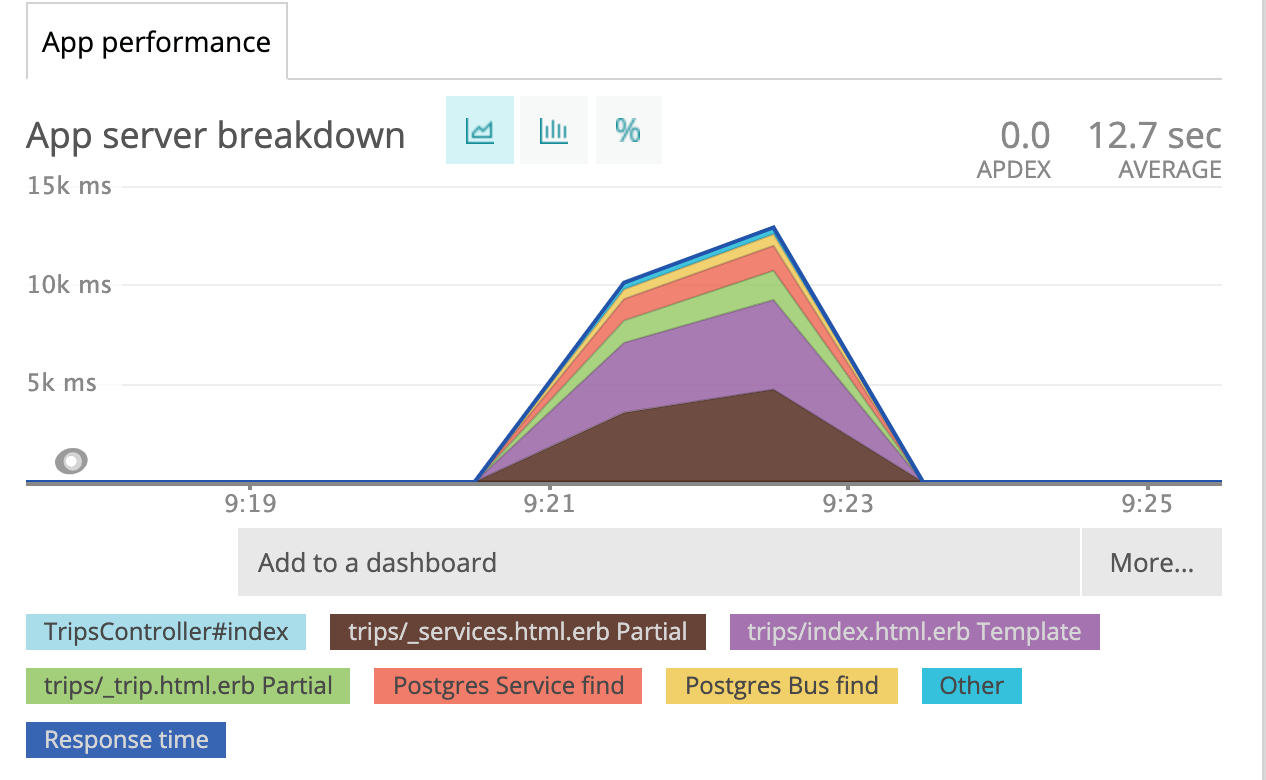
Rendering the page turned out to be the most time-consuming, as can be clearly seen from the graph:
-
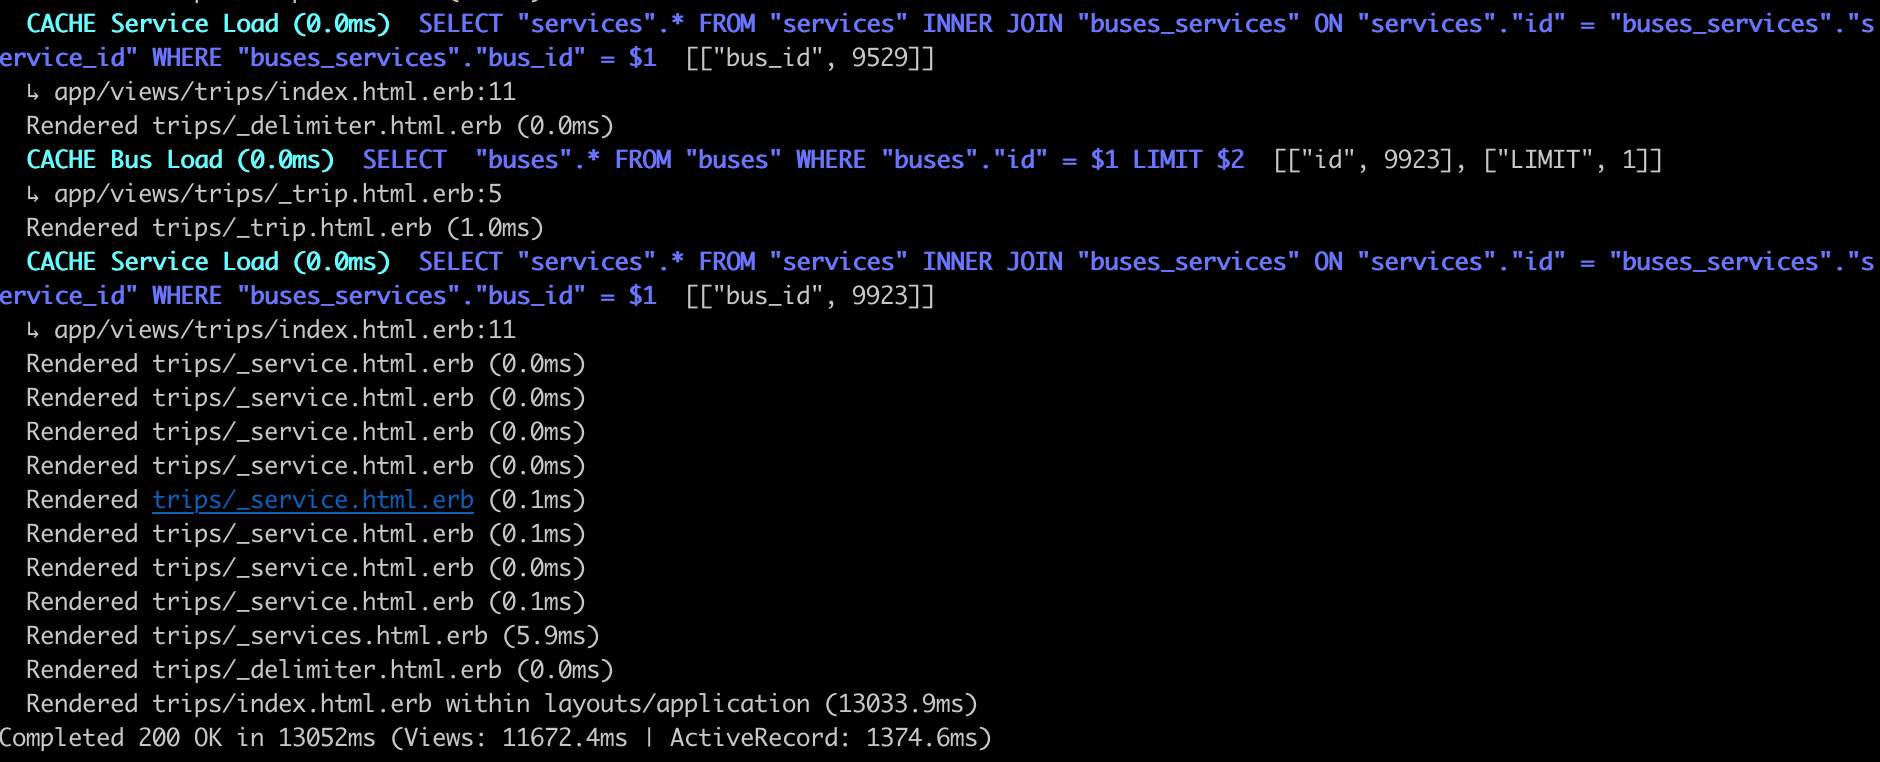
First, I removed the unnecessary splitting into partial 's, since it has no value, but it slows down document generation.
-
Second, I replaced rendering of partials in a loop with rendering of a collection.
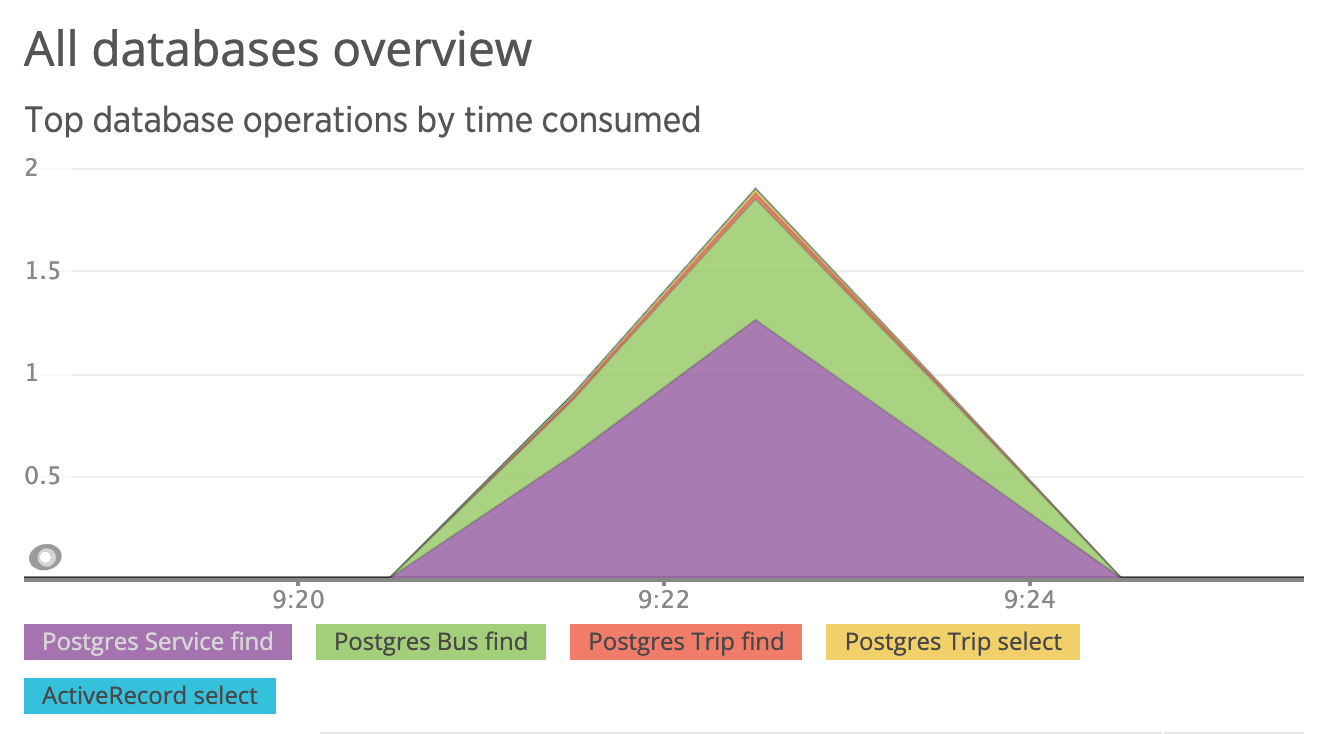
The problem of N + 1 Query is clearly to see in the newrelic report and from rails: the bus and services associations are called for each request from the view.
We can use eager_load and call all related records with one request. So, it makes one query for each request, but a more complex one, including joining tables.
- With indicies but without front end optimization
ab -n 10 -c 1 http://localhost:3000/автобусы/Самара/Москва

Server Software:
Server Hostname:        localhost
Server Port:            3000

Document Path:          /автобусы/Самара/Москва
Document Length:        538780 bytes

Concurrency Level:      1
Time taken for tests:   247.233 seconds
Complete requests:      10
Failed requests:        0
Total transferred:      5395342 bytes
HTML transferred:       5387800 bytes
Requests per second:    0.04 [#/sec] (mean)
Time per request:       24723.295 [ms] (mean)
Time per request:       24723.295 [ms] (mean, across all concurrent requests)
Transfer rate:          21.31 [Kbytes/sec] received

Connection Times (ms)
              min  mean[+/-sd] median   max
Connect:        0    0   0.0      0       0
Processing: 22301 24723 948.8  25043   25566
Waiting:    22300 24723 948.9  25043   25566
Total:      22301 24723 948.8  25043   25566

Percentage of the requests served within a certain time (ms)
  50%  25043
  66%  25186
  75%  25199
  80%  25265
  90%  25566
  95%  25566
  98%  25566
  99%  25566
 100%  25566 (longest request)
- After removing partials and adding collections
ab -n 10 -c 1  http://localhost:3000/автобусы/Самара/Москва

Server Software:
Server Hostname:        localhost
Server Port:            3000

Document Path:          /автобусы/Самара/Москва
Document Length:        569667 bytes

Concurrency Level:      1
Time taken for tests:   45.169 seconds
Complete requests:      10
Failed requests:        0
Total transferred:      5704204 bytes
HTML transferred:       5696670 bytes
Requests per second:    0.22 [#/sec] (mean)
Time per request:       4516.931 [ms] (mean)
Time per request:       4516.931 [ms] (mean, across all concurrent requests)
Transfer rate:          123.33 [Kbytes/sec] received

Connection Times (ms)
              min  mean[+/-sd] median   max
Connect:        0    0   0.0      0       0
Processing:  3838 4517 448.1   4523    5575
Waiting:     3838 4516 448.1   4522    5575
Total:       3838 4517 448.1   4523    5575

Percentage of the requests served within a certain time (ms)
  50%   4523
  66%   4573
  75%   4583
  80%   4725
  90%   5575
  95%   5575
  98%   5575
  99%   5575
 100%   5575 (longest request)
As we can see from the results above after getting rid of partials and rendering partial with collection
- Time taken for tests reduced from 247.233 seconds to 45.169 seconds
- Time per request reduced from 24723.295 [ms] (mean) to 4516.931 [ms] (mean)
- Requests per second increased from 0.04 [#/sec] to 0.22 [#/sec] (mean)


