SClean is a tool for data cleaning and visualization of the output of various packages in the sysstat tool under Linux.
Many times we have performance analysis tools, but the log obtained through the tools is too long, especially the log obtained after a long time pressure test. It is dazzling at first sight and difficult to findthe key points. If you try to select several time periods to check, the locality problem may bring you into another misunderstanding. Then you may try to filter by keywords manually, which make it a difficulty to analyze the root cause, either because the file is too large to open, or because the filtering result is not good enough. The purpose of SClean is to visualize the results of performance analysis from "God's perspective", which can help engineers quickly locate the root cause of the problem and save a lot of time for drinking coffee, while they are immersed in the log analysis.
- The system performance cannot be monitored in real time under embedded Linux environment.
- Quickly locate the performance bottleneck caused by a large number of threads (dozens) running on different CPU cores.
- the CPU core can't be observed by the average data obtained by pidstat, which needs to be analyzed further.
- The log file is too large, which takes a lot of time to analyze.
- Memory, IO, and the number of context switching are abnormal in a certain partial time period, which affects the global judgment.
- If you want to see the overall performance during certain periods, the visual display is clear at a glance.
This tool is developed by python3. So please install python3 first.
$ pip install -r requirements.txtYou can skip this step if you have no Chinese requirement. If there is Chinese in the output log of your system tools, such as the date "2020年10月1日", you can install the SimHei font. If you don't install, it won't affect the visual output, but the Chinese characters are garbled.
Find out the matplotlibrc file in your python3 environment. If you cann't find it, try the following ways.Open a py file and write the code below:
import matplotlib
print(matplotlib.matplotlib_fname())
After running, a path will be displayed, such as:
~/.local/lib/python3.7/site-packages/matplotlib/mpl-data/matplotlibrc
Then modify the file: ~/.local/lib/python3.7/site-packages/matplotlib/mpl-data/matplotlibrc
- Remove the "#" in front of font.family to make this configuration effective;
- Remove the "#" in front of font.sans-serif to make this configuration effective, and add SimHei font, as shown below;
font.family  : sans-serif
#font.style   : normal
#font.variant : normal
#font.weight  : normal
#font.stretch : normal
#font.size    : 10.0

#font.serif      : DejaVu Serif, Bitstream Vera Serif, Computer Modern Roman, New Century Schoolbook, Century Schoolbook L, Utopia, ITC Bookman, Bookman, Nimbus Roman No9 L, Times New Roman, Times, Palatino, Charter, serif
font.sans-serif : Arial, SimHei, Bitstream Vera Sans, Lucida Grande, Verdana, Geneva, Lucid, Helvetica, Avant Garde, sans-serif
#font.cursive    : Apple Chancery, Textile, Zapf Chancery, Sand, Script MT, Felipa, cursive
#font.fantasy    : Comic Neue, Comic Sans MS, Chicago, Charcoal, ImpactWestern, Humor Sans, xkcd, fantasy
#font.monospace  : DejaVu Sans Mono, Bitstream Vera Sans Mono, Computer Modern Typewriter, Andale Mono, Nimbus Mono L, Courier New, Courier, Fixed, Terminal, monospace
$ cp font/SimHei.ttf ~/.local/lib/python3.7/site-packages/matplotlib/mpl-data/fonts/ttf
$ rm ~/.cache/matplotlib
SClean cleans the output of the sysstat tool, so you must have a log file before you can use it.
For pidstat, at present SClean only cleans data at the thread level, because most of the time we don't know the CPU status of several threads in progress. So your command parameter should be "-t", for example:
$ pidstat -t interval count // interval indicates time interval, count indicates frequencyAssuming that you already have a log based on pidstat: pidstat.log, note that pidstat must be entered until it ends normally, and the log after the end will count the average value during this time. SClean also cleans the average value. The following is an example:
$ pidstat -t 5 360 > pidstat.log
pidstat.log looks like this:
Linux 4.15.0-112-generic (m2133)        2020年10月20日  _x86_64_        (12 CPU)

14时26分02秒      TGID       TID    %usr %system  %guest    %CPU   CPU  Command
14时26分03秒         -       344    0.96    0.00    0.00    0.96     0  |__chrome
14时26分03秒      1808         -    1.92    0.00    0.00    1.92     7  chrome
14时26分03秒         -      2620    1.92    0.00    0.00    1.92    11  |__Media
14时26分03秒         -     30579    0.96    0.96    0.00    1.92    10  |__PacerThread
......
Average:         TGID       TID    %usr %system  %guest    %CPU   CPU  Command
Average:            -       344    0.96    0.00    0.00    0.96     -  |__chrome
Average:         1808         -    1.92    0.00    0.00    1.92     -  chrome
Average:            -      2620    1.92    0.00    0.00    1.92     -  |__Media
Average:            -     30579    0.96    0.96    0.00    1.92     -  |__PacerThread
run command:
python sclean.py -p example/log/pidstat.log -pt
The parameter "-p" specifies the log path, and the parameter "-pt" specifies the CPU usage of the thread to be analyzed. By default, the command will analyze the CPU performance of all threads with the first CPU core (CPU0) and multiple CPU cores bound or unbound (it appears that this thread will run on multiple CPU cores). After running, three files will be generated: pidstat_bar.jpg, pidstat_cpu.csv, pidstat_sunburst.html. Note that the values in the three files we see are all averages over this period of time.
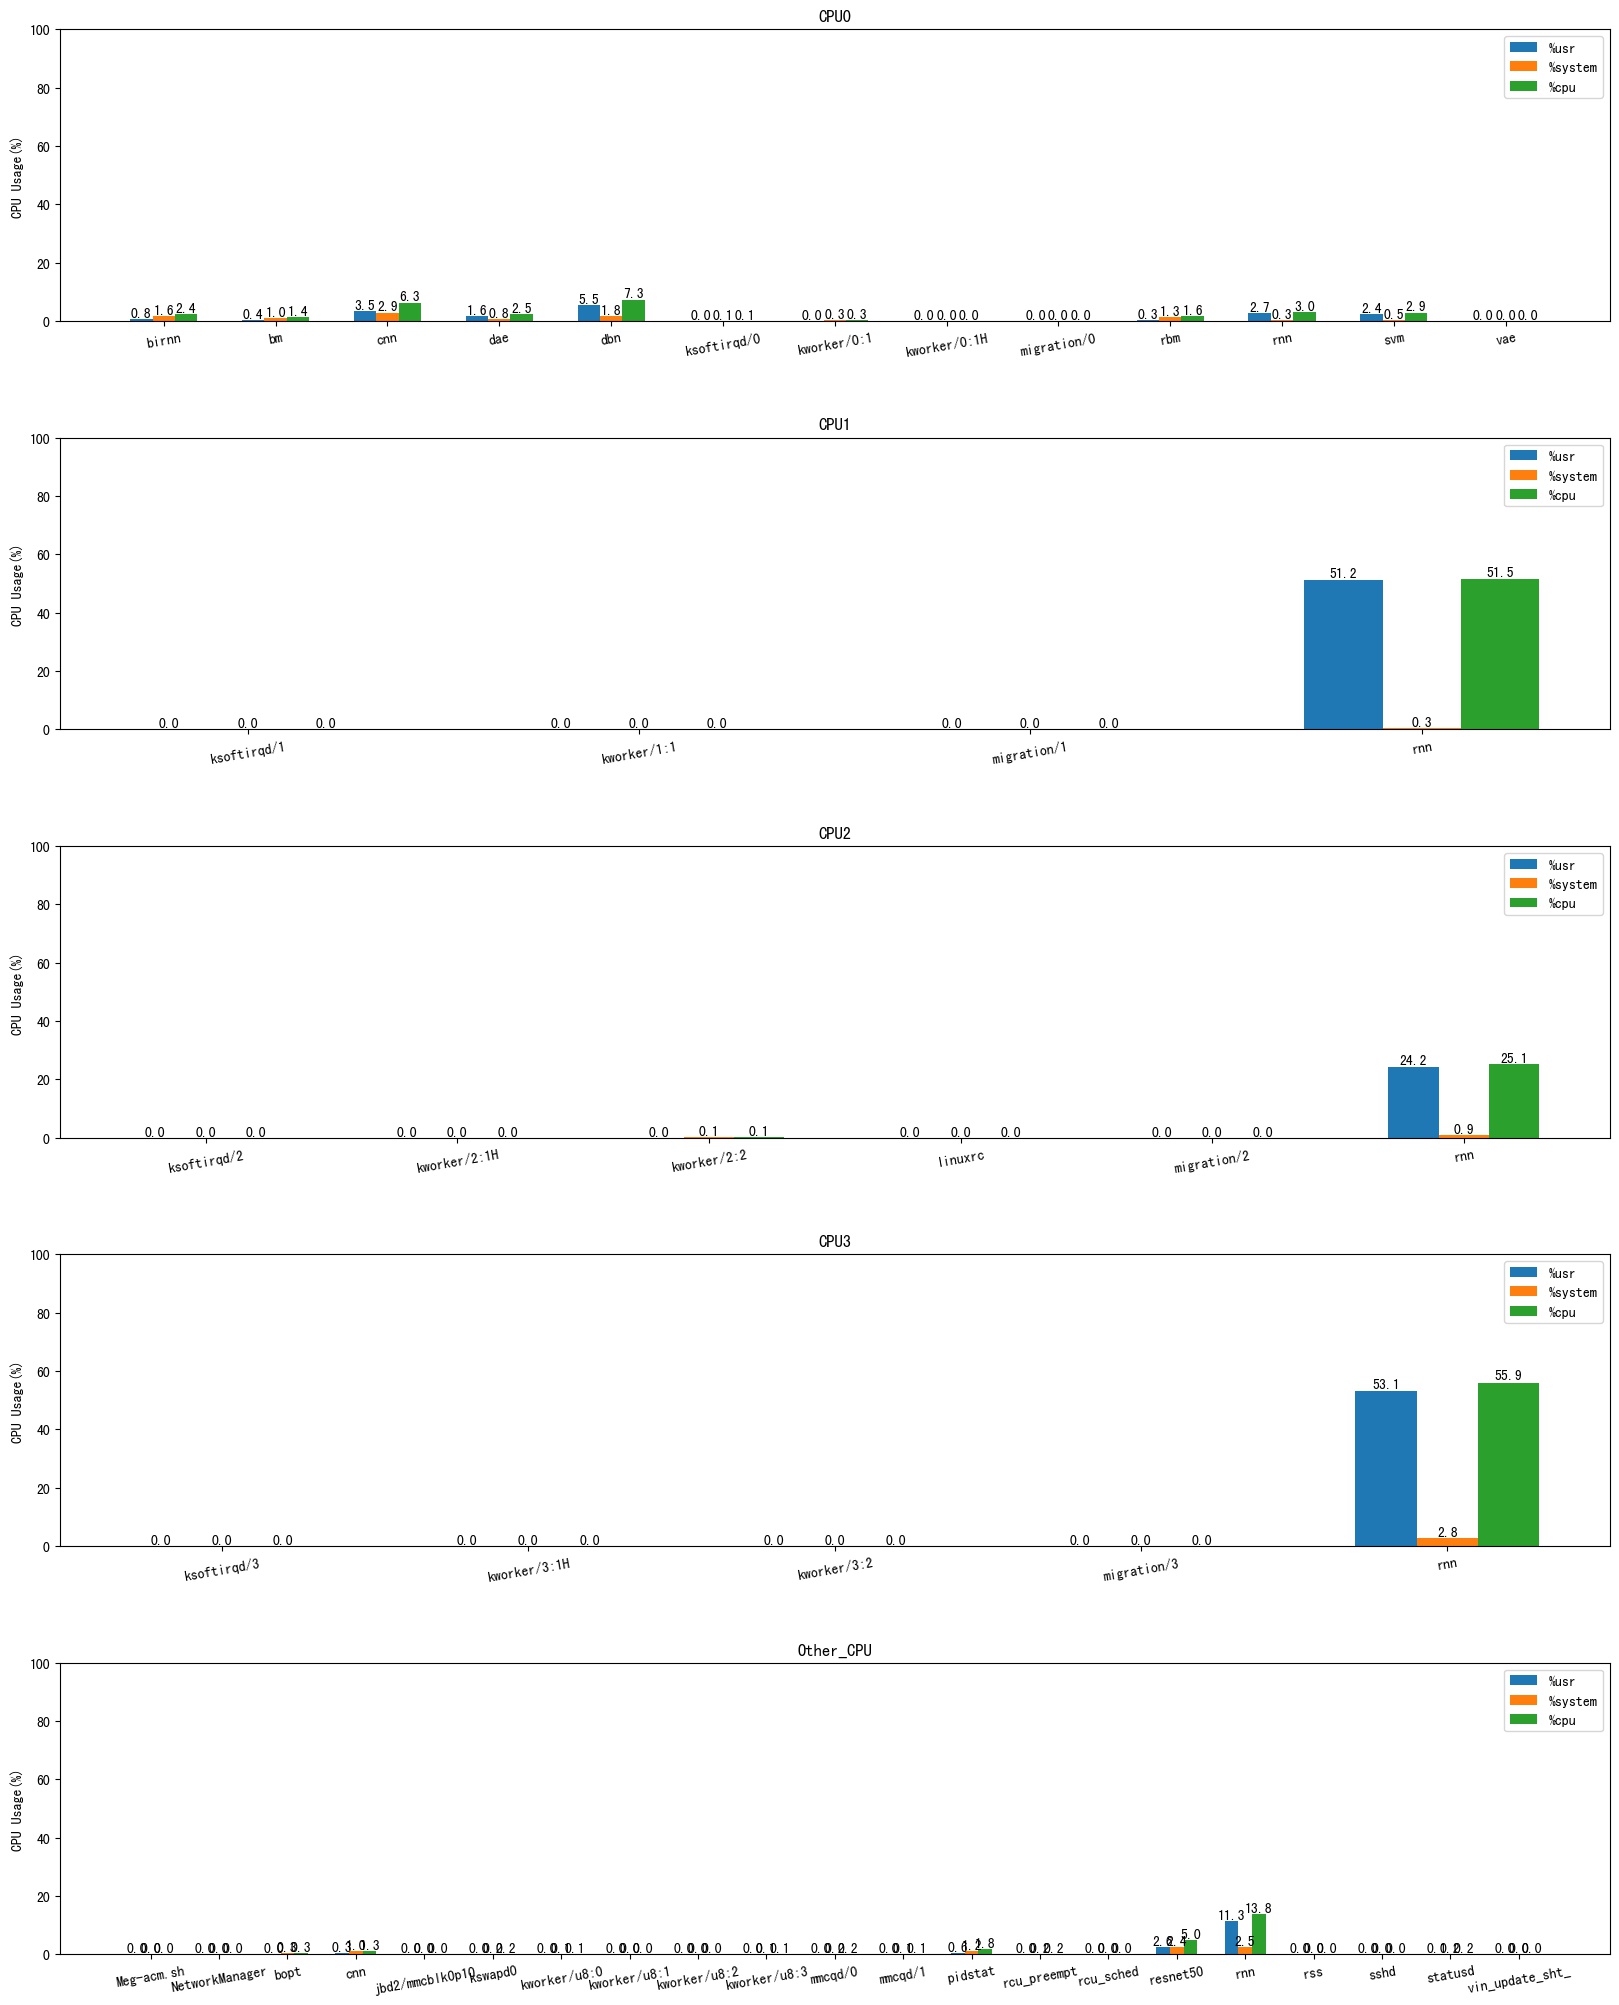
pidstat_bar.jpg is a histogram generated for all processes on a specified CPU core. By default, it counts the average user-mode CPU usage (%usr), kernel-mode CPU average usage (%system), and total CPU average usage (%CPU) during this period of time. As shown below:
If you want to see other indicators of pidstat, you can specify it with the parameter "-ps"。You can specify the CPU core through "-c":
python sclean.py -p example/log/pidstat.log -pt -c 0 1 2 3 -ps guest usr system cpu
The above command specifies four CPU cores, CPU0, CPU1, CPU2, and CPU3, and displays the four specified indicators: %guest, %usr, %system, %CPU.
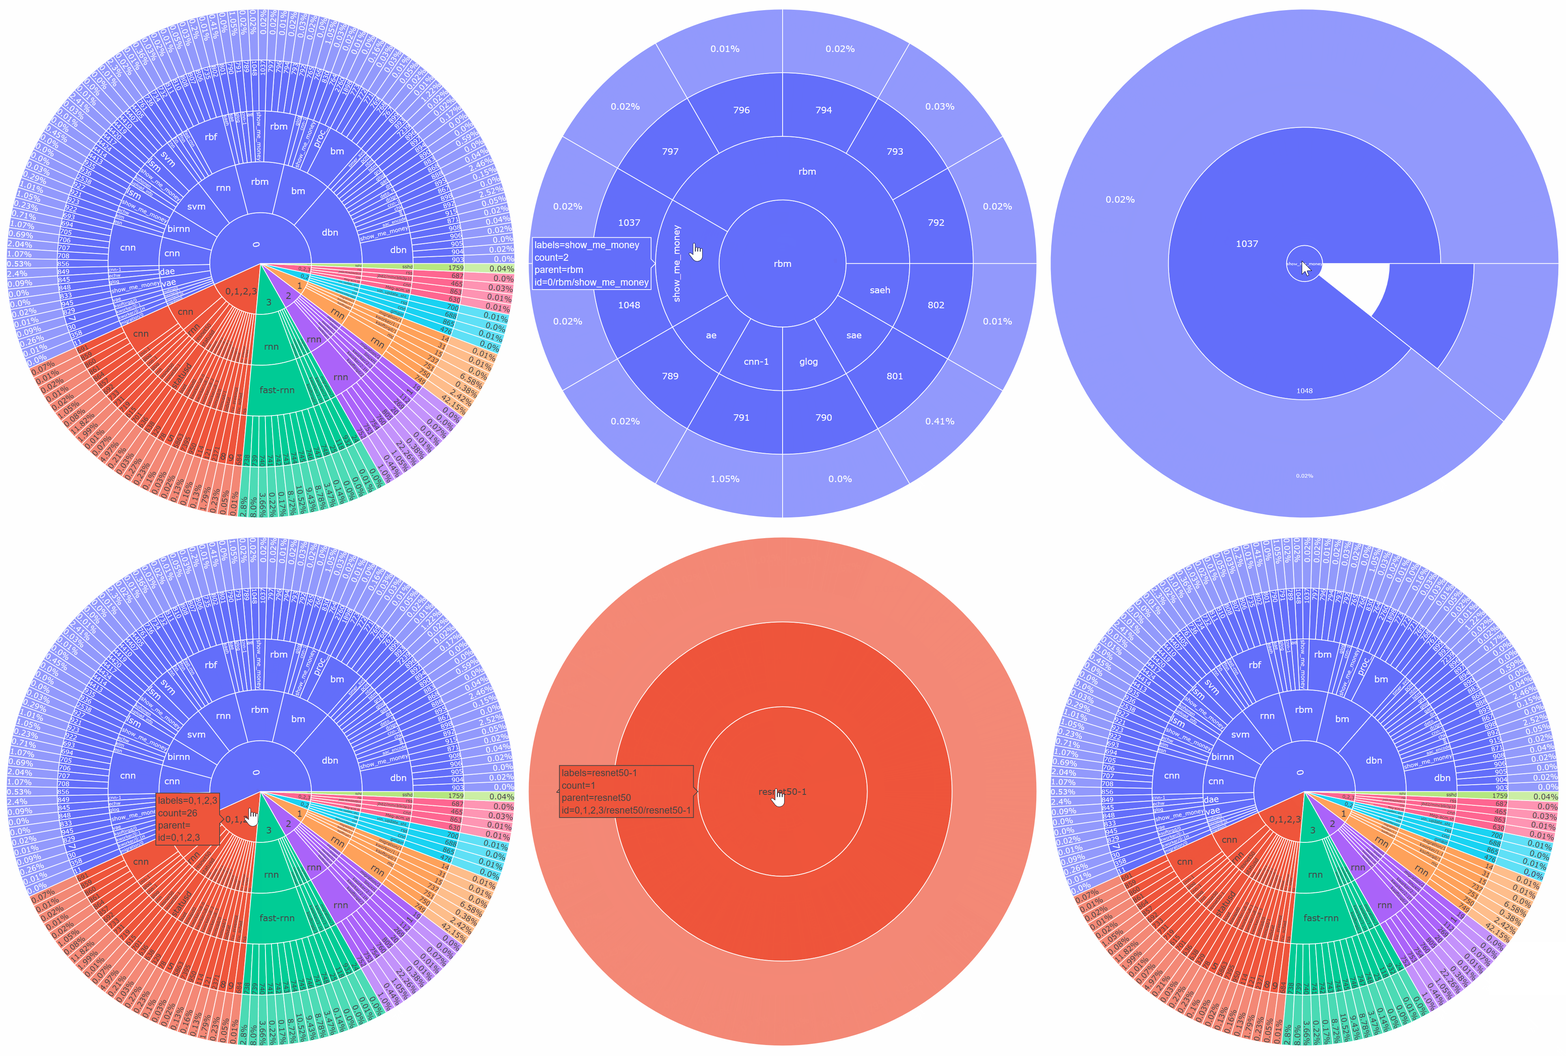
pidstat_sunburst.html is a sunburst chart, which shows the CPU usage (%CPU) of each thread in the specified CPU core:
- Counting the fifth circle from inside to outside, ie. the outermost circle represents the average CPU usage (%CPU) of this thread during this time period.
- The fourth circle from the inside out indicates the thread number.
- The third circle from the inside out indicates the thread name. Different threads may have same names in different cores, such as a thread created by a shared library.
- The second circle from the inside out indicates the name of the process to which the thread of the third circle belongs, and there may be processes with the same name in this circle. For example, the threads in this process may be tied to different cores, and they will be divided into the same process when categorized.
- The innermost circle represents the number of CPU cores. For example, "0" means all processes/threads running only on CPU0 core; "0,1,2,3" means all processes/threads running on CPU0, CPU1, CPU2, and CPU3 Process/thread (meaning that this thread is either bound to the four cores of CPU0, CPU1, CPU2, and CPU3; or if no core is bound, it will float on the four cores of CPU0, CPU1, CPU2, and CPU3).
- Which processes are on each core, which threads each process contains, and the thread number of each thread is distinguished by the radius line in the circle.
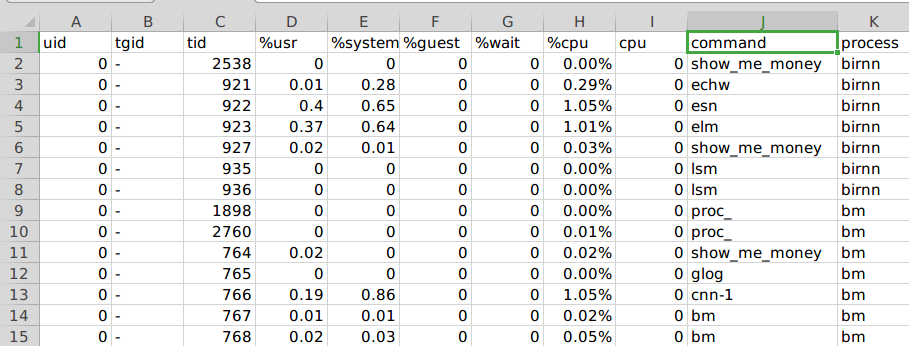
The pidstat_cpu.csv file records in detail the average CPU usage of all threads in the system:
The command column represents the thread name, and tid represents the thread number, which is consistent with the output of pidstat. The process to which a thread belongs is represented by process, and cpu means the corresponding thread is running on which CPU core. The tgid column has been filtered out and displayed as "-", because we are mainly concerned with threads.
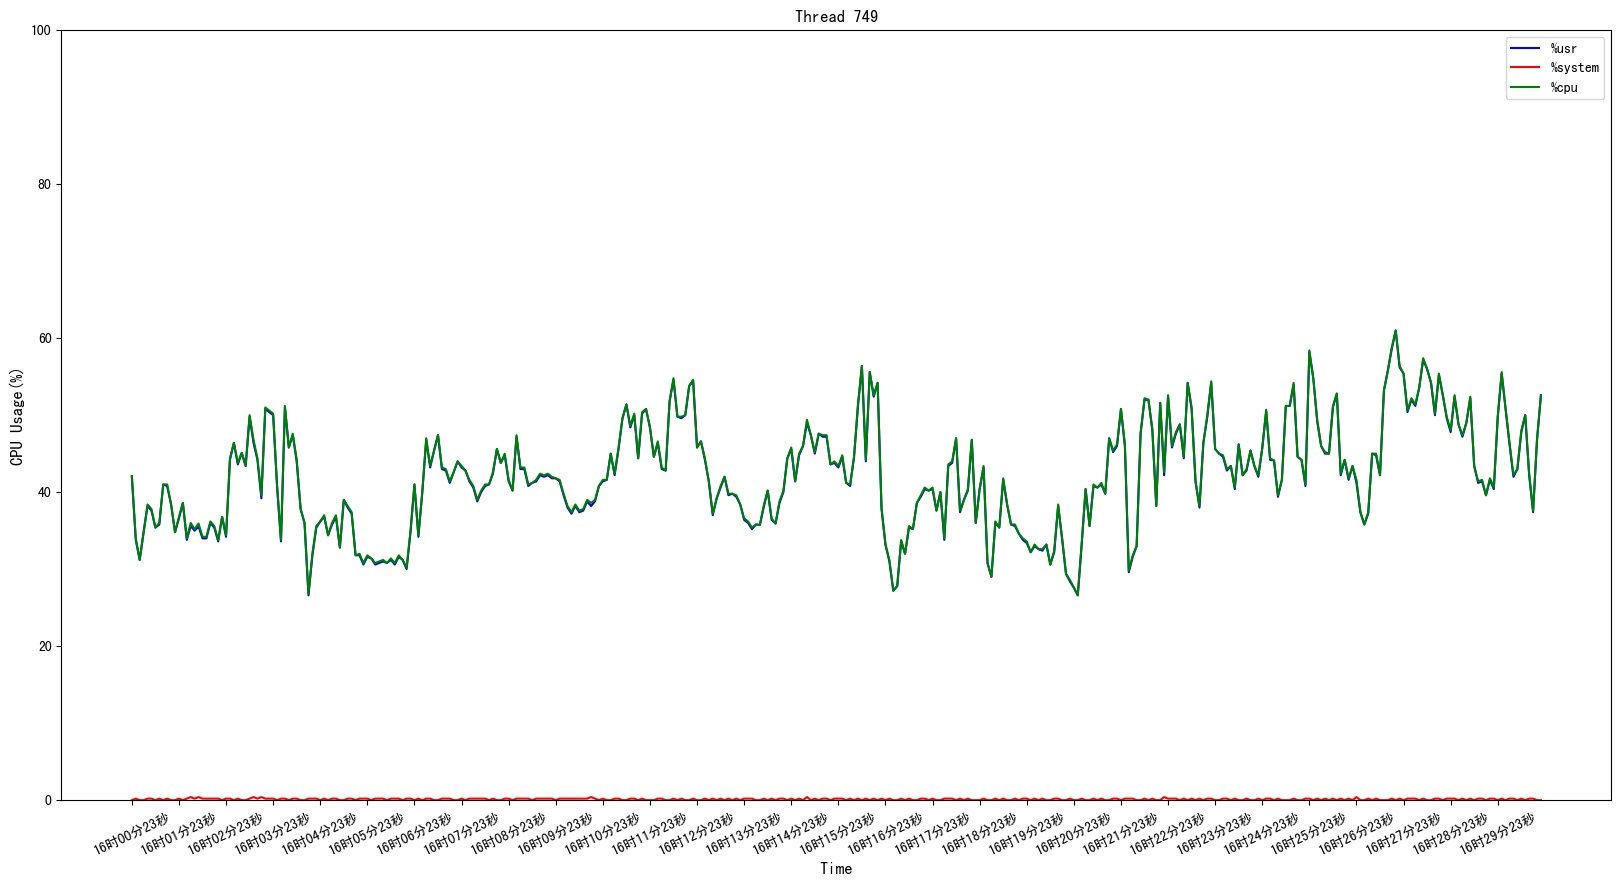
If you want to further view the curve graph of the CPU usage of a thread during this period, you can use the "-t" parameter, and a line graph with the name of the thread will be generated.
python sclean.py -p example/log/pidstat.log -pt -t 749
If you only want to display the CPU status of the process you follow, you can use the "-pp" parameter:
python sclean.py -p example/log/pidstat.log -pt -c 0 1 2 3 -pp rss cnn rnn rbm
This command only focuses on these processes: rss cnn rnn rbm
Because it is to analyze the data of the memory, you need to add the parameter "-r" to your log command, as shown in the following example:
$ pidstat -C "process1|process2|process3|process4|process5|process6|process7|process8|process9|process10" -rdh -p ALL 10 > pidstat_mem_io.log
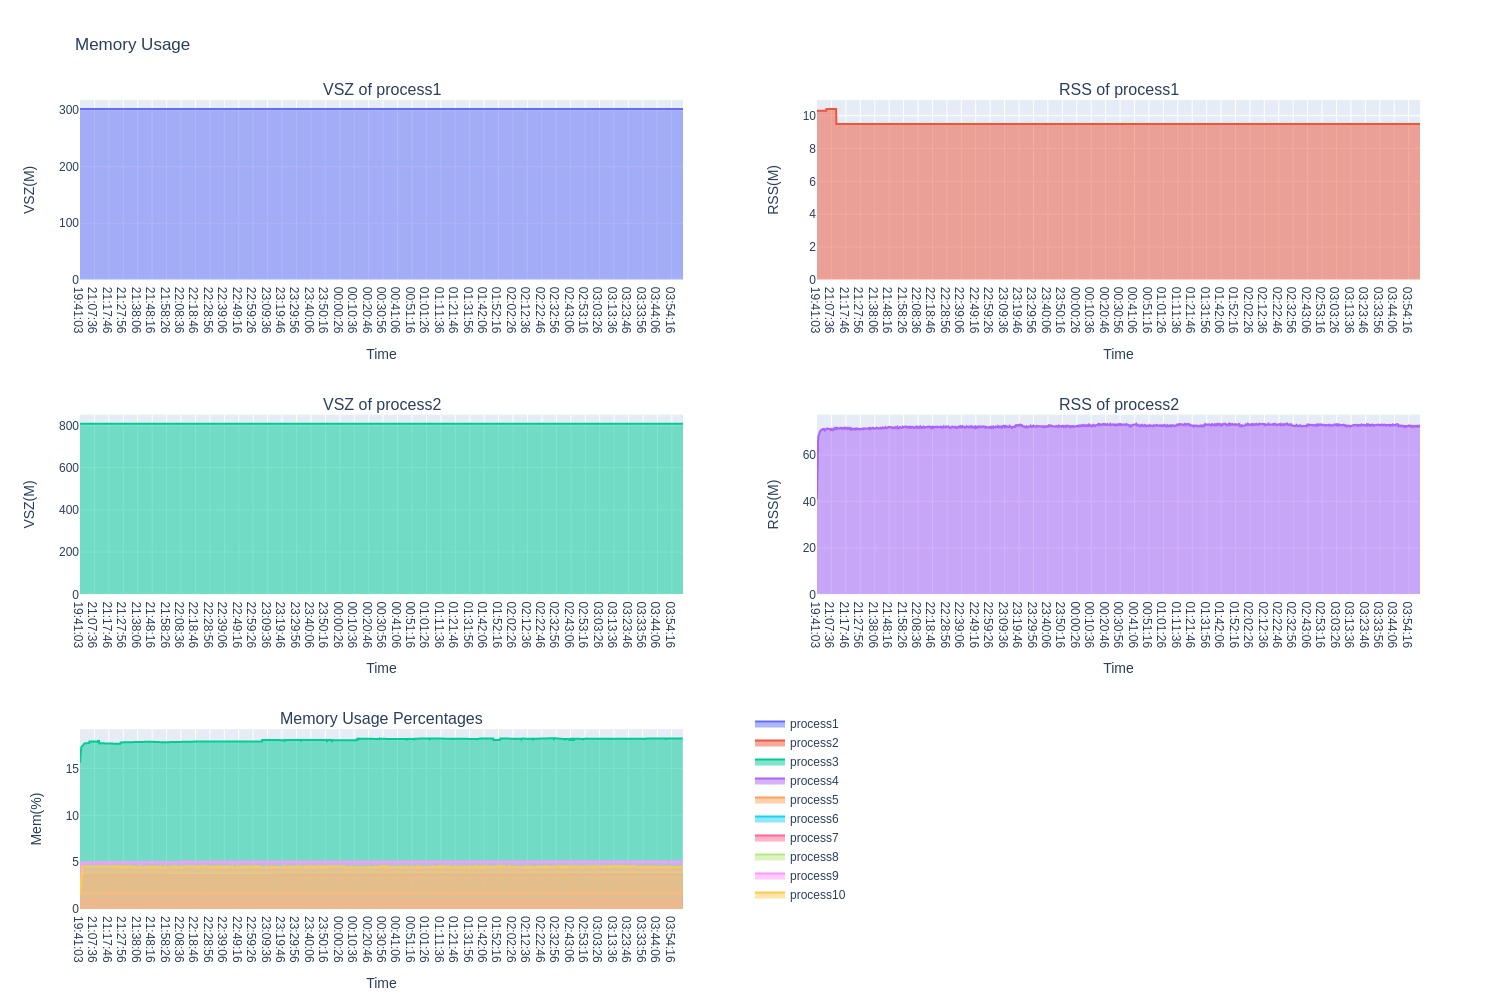
Using the parameter "-pr" will generate a line graph of the memory usage of the specified process, as the following command:
python sclean.py -p example/log/pidstat_mem_io.log -pr
Or specify the process name to filter:
python sclean.py -p example/log/pidstat_mem_io.log -pr -pp process1 process2
Finally, the file pidstat_mem.html will be generated . Display the VSZ, RSS of each process and the memory usage of the specified process in an interactive form on the html page.
Because it is for data analysis of IO, you need to add the parameter "-d" to your log command, as shown in the following example:
$ pidstat -C "process1|process2|process3|process4|process5|process6|process7|process8|process9|process10" -rdh -p ALL 10 > pidstat_mem_io.log
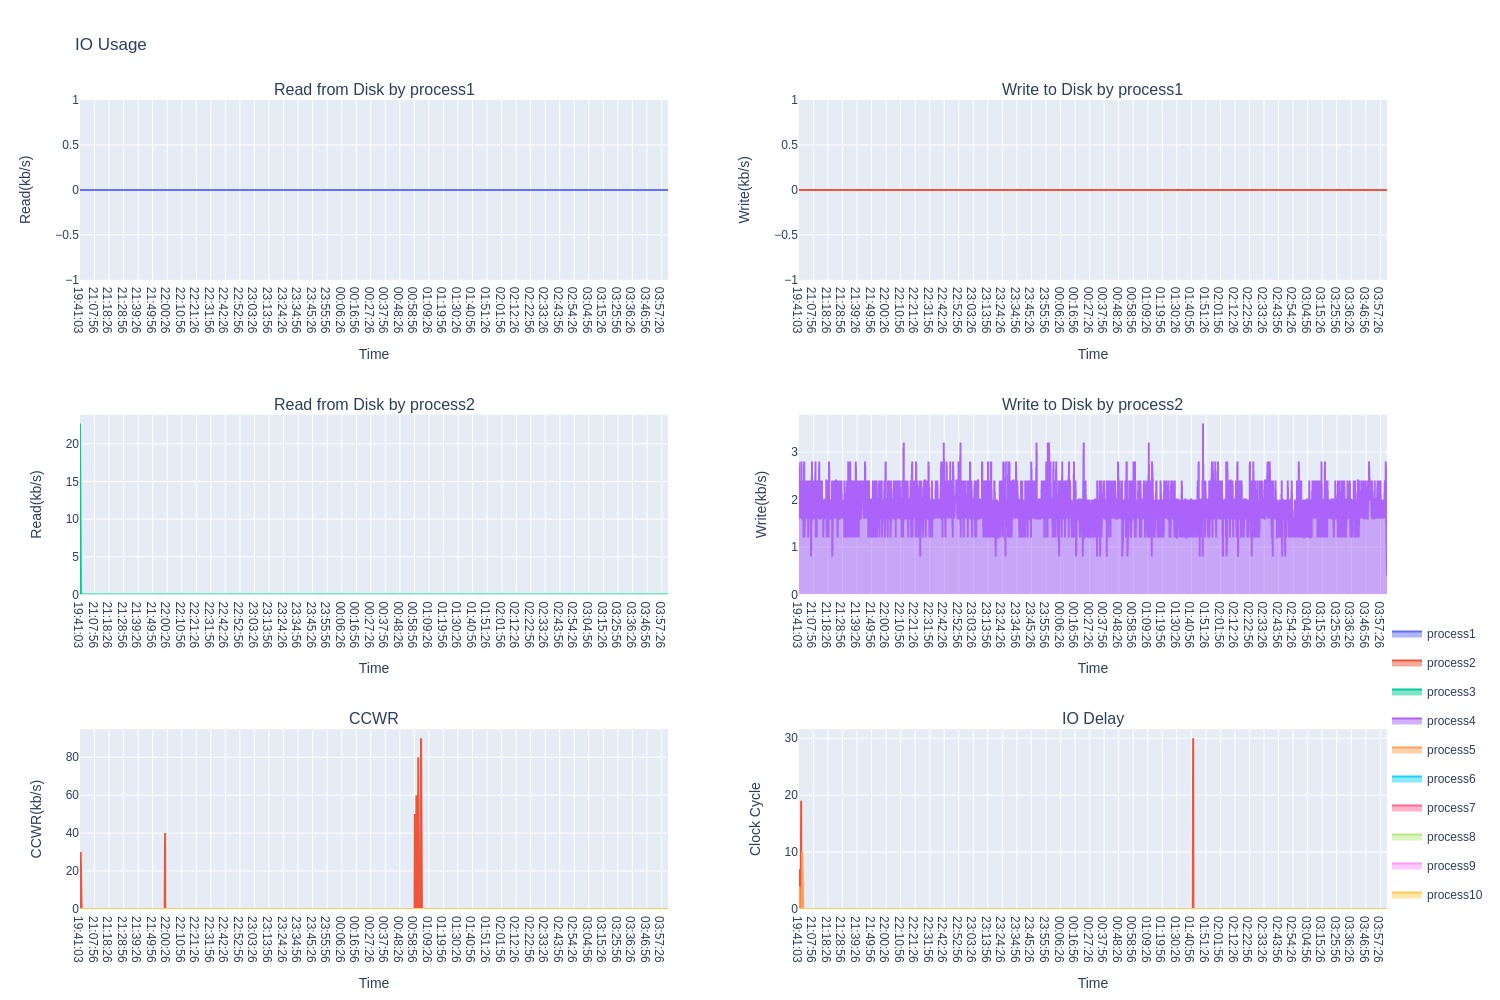
Using the parameter "-pd" will generate a line chart of the IO usage rate of the specified process, as the following command:
python sclean.py -p example/log/pidstat_mem_io.log -pd
Or specify the process name to filter:
python sclean.py -p example/log/pidstat_mem_io.log -pd -pp process1 process2
Finally, the file pidstat_io.html will be generated.The html page interactively displays the read and write disk size of the specified process per second, as well as the status of CCWR and IO Delay.
The following commands can be used for mpstat log recording:
mpstat -P ALL 5 360 > mpstat.log // Output every 5s, a total of 360 records, that is, half an hour of log recording
run:
python sclean.py -m example/log/mpstat.log -c 0 1 2 3
This command will generate three files: mpstat.csv, mpstat_line.jpg, mpstat_pie.html.
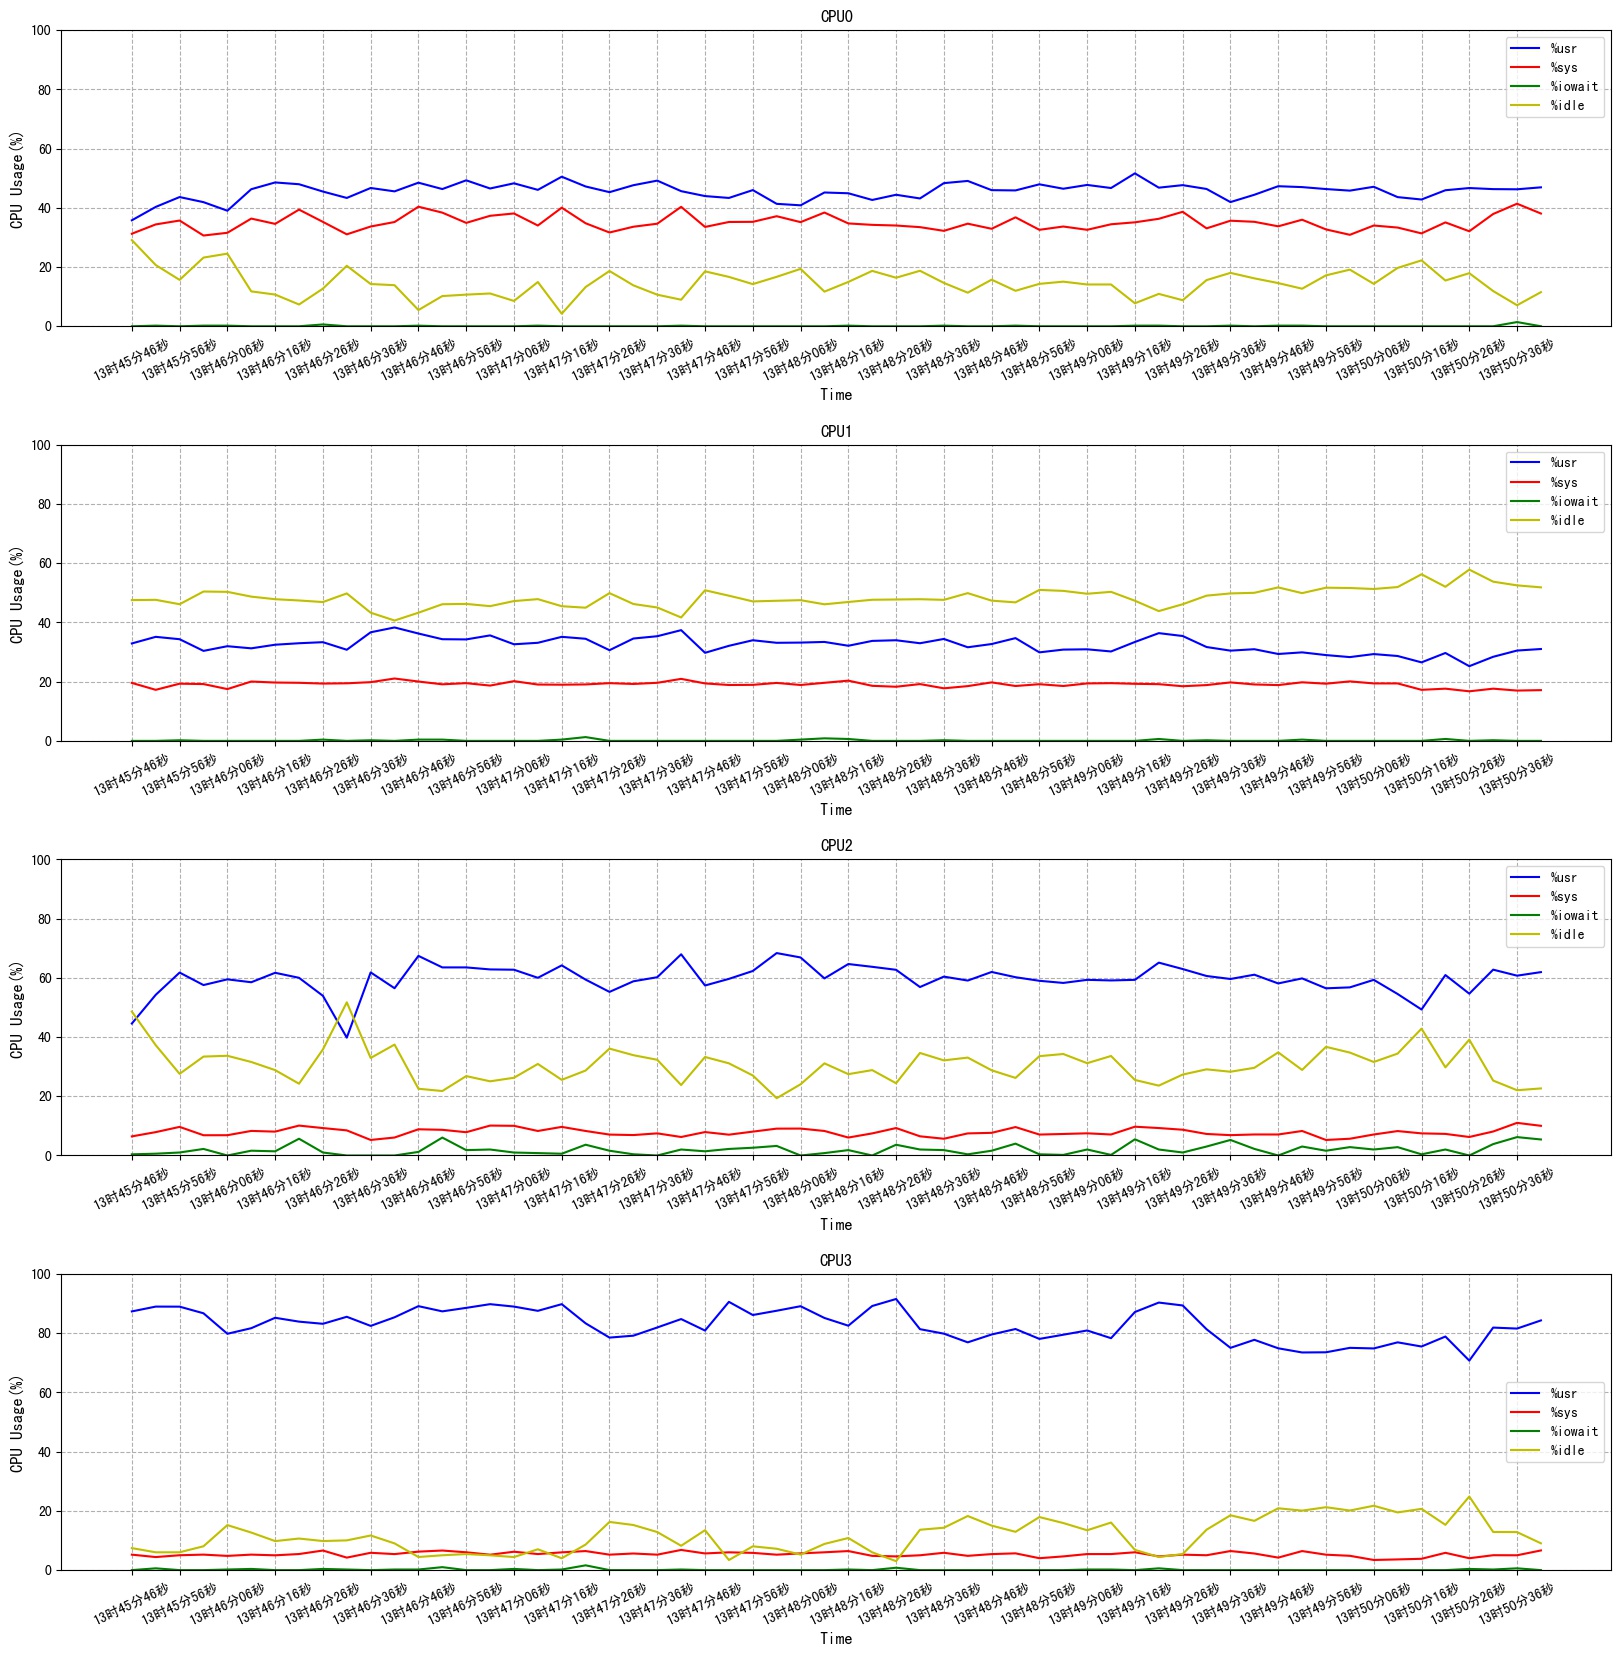
mpstat_line.jpg displays the CPU performance curve of the specified CPU core during this period in the form of a line graph. By default, these indicators are displayed: %usr, %sys, %iowait, %idle.
If you want to see other indicators of mpstat, you can specify it with the parameter "-ms", and run:
python sclean.py -m example/log/mpstat.log -c 0 1 2 3 -ms usr nice irq soft
This command specifies these CPU indicators: %usr, %nice, %irq, %soft.
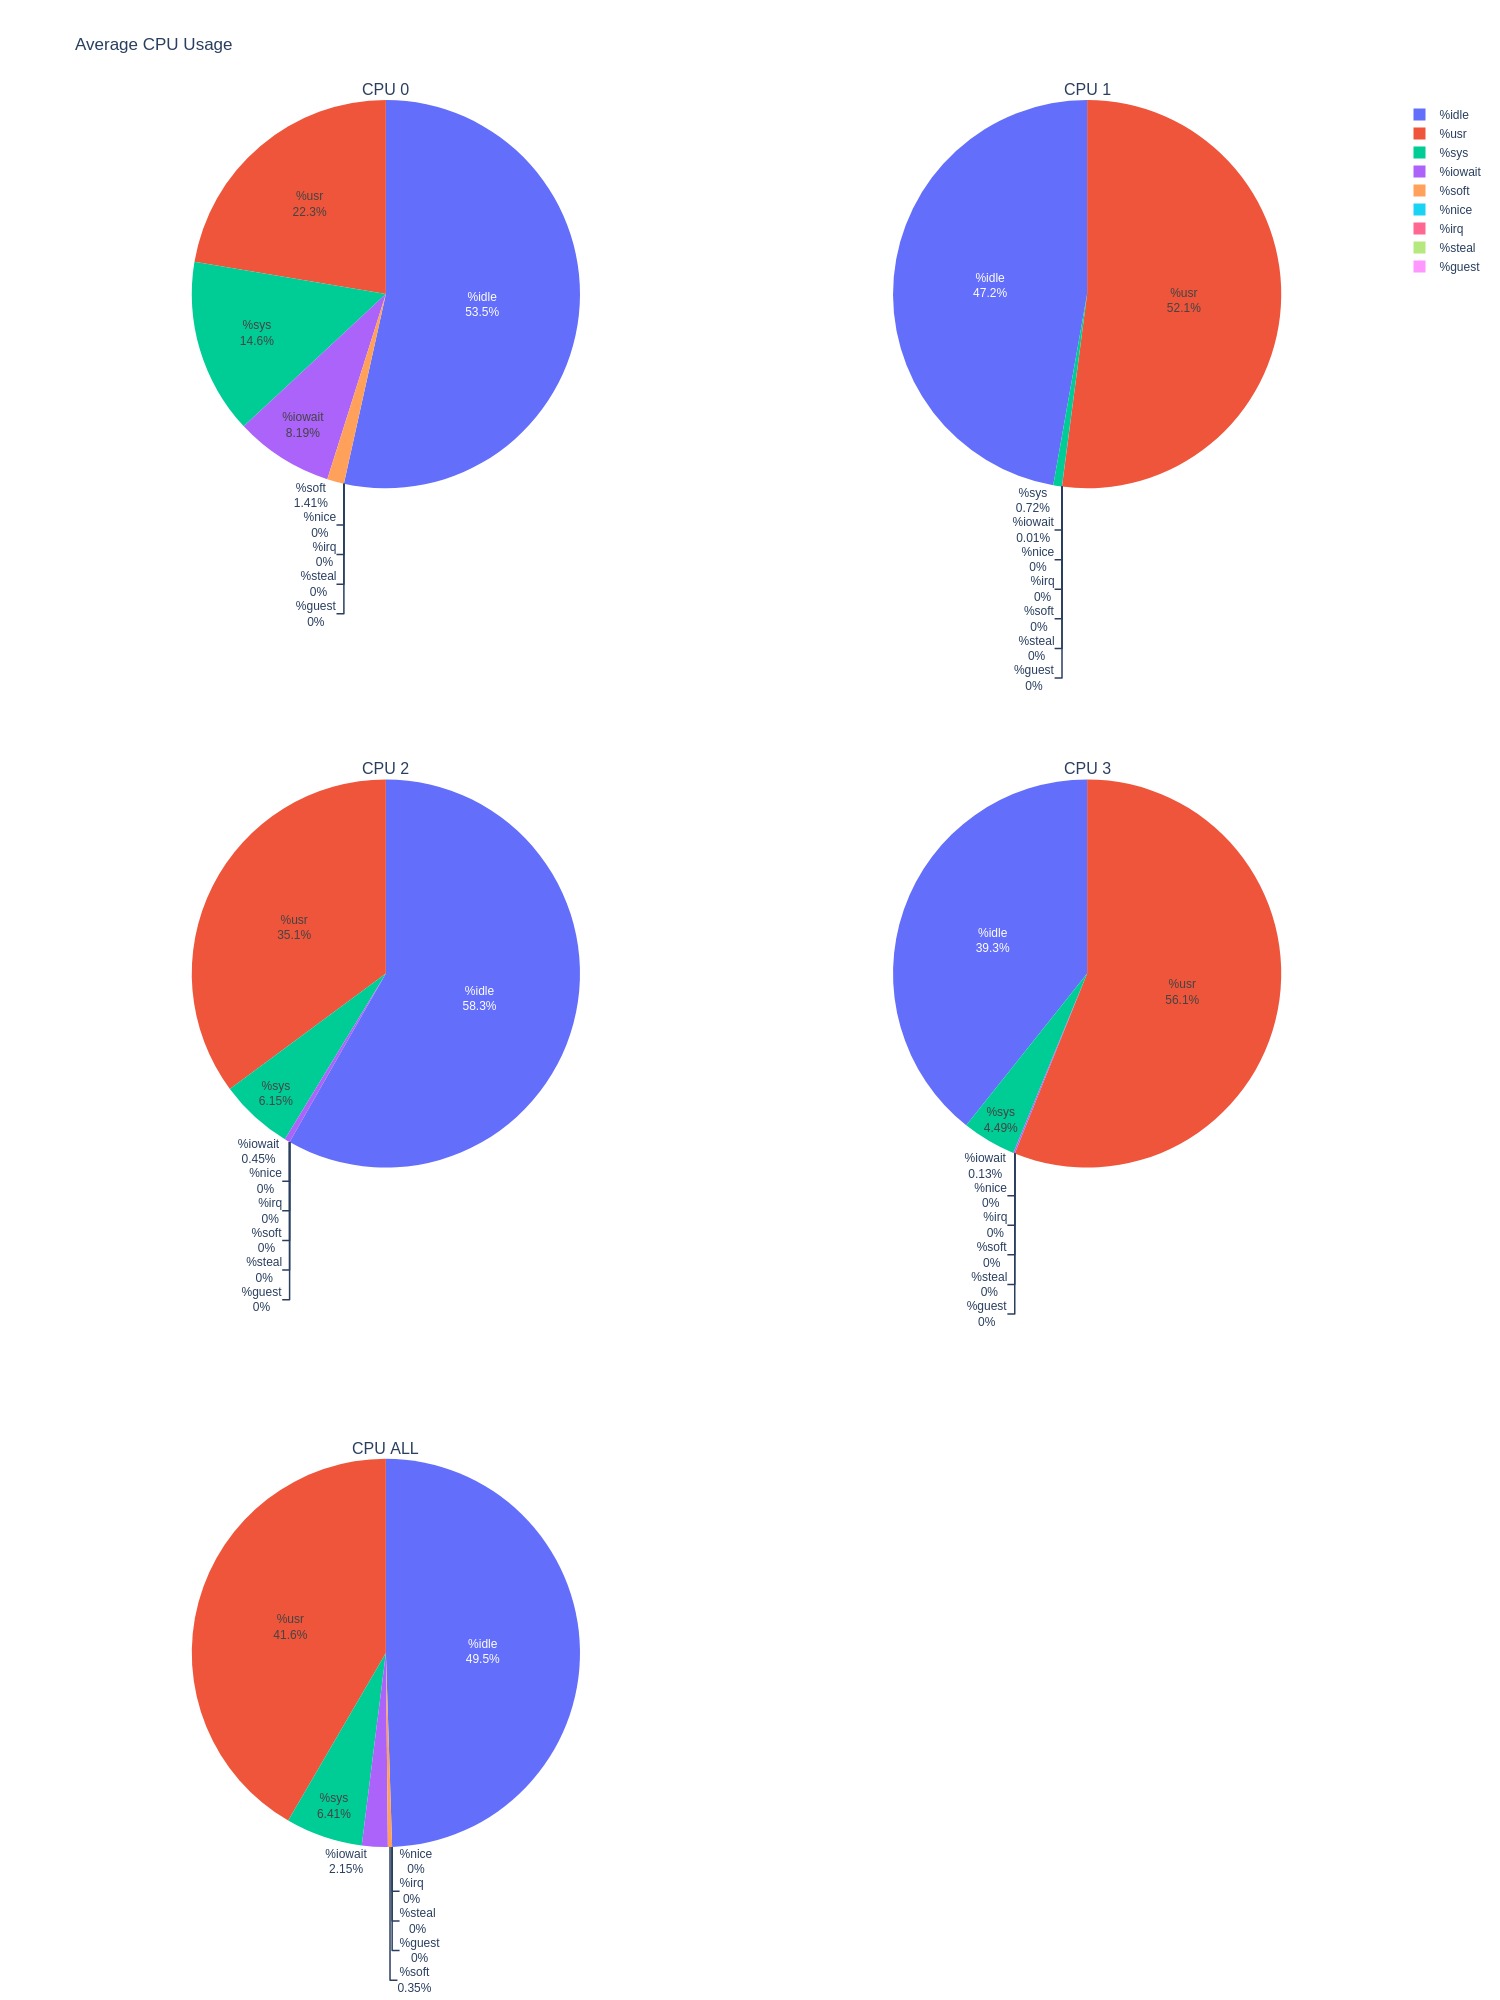
mpstat_pie.html displays the average CPU performance index during this period in the form of a pie chart. The following figure shows the average performance index of each of the four CPU cores, CPU0, CPU1, CPU2, and CPU3. CPU ALL represents the average performance index of the four cores added together.
mpstat.csv is the cleaned data.
The log recording of vmstat can use the following commands:
vmstat 5 360 > vmstat.log // Output every 5s, a total of 360 records, that is, half an hour of log recording
run:
python sclean.py -v example/log/vmstat.log
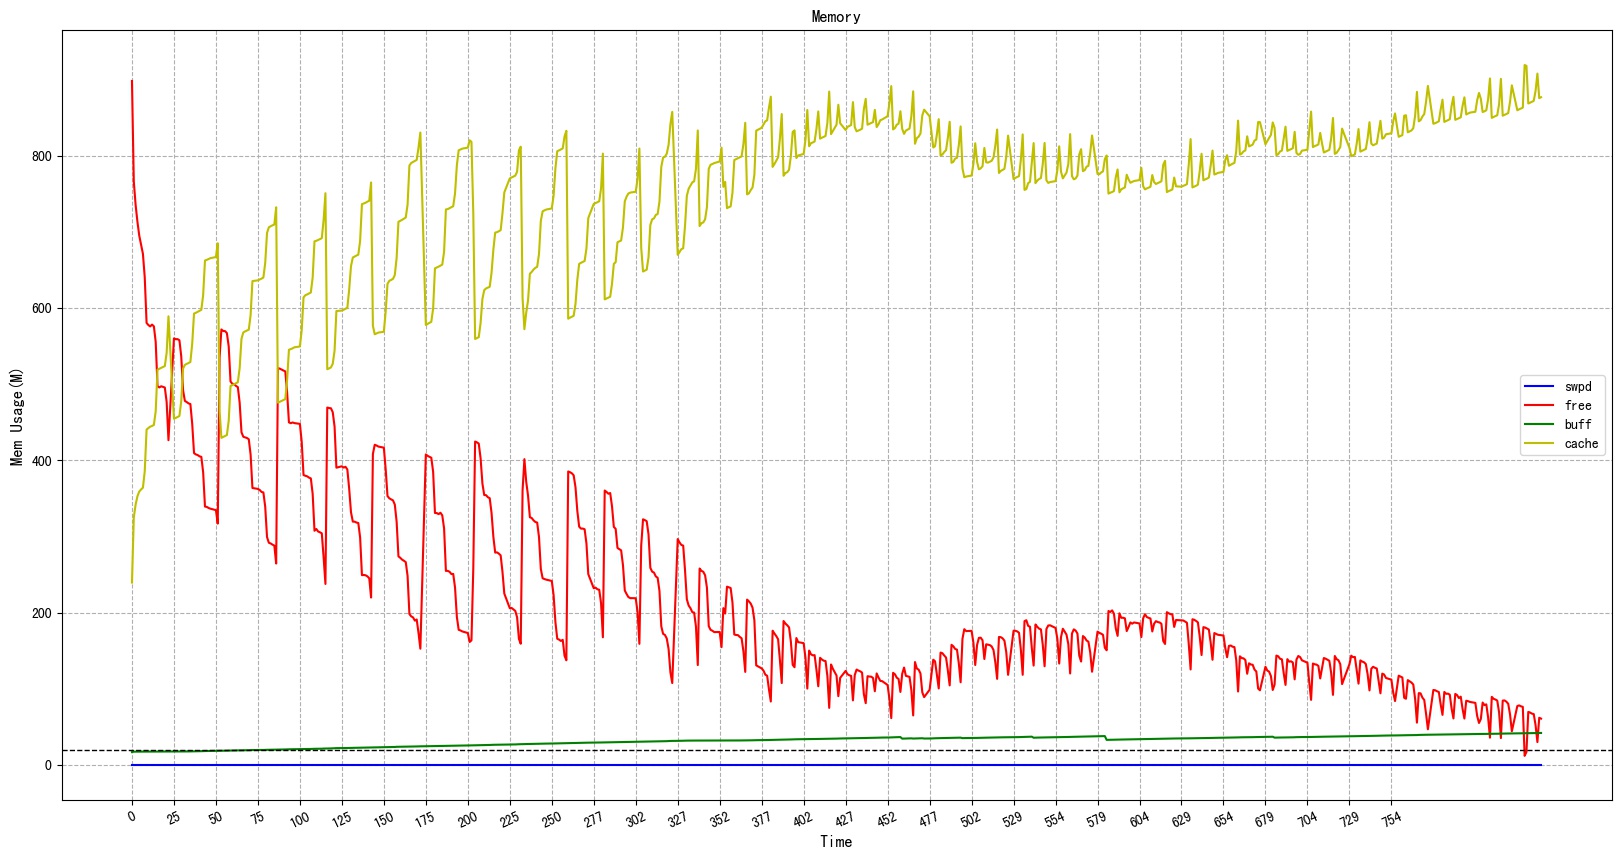
This command will generate two files: vmstat_line.jpg and vmstat.csv. We mainly focus on vmstat_line.jpg , which shows the memory usage during this period in the form of a line graph. There is a dotted line in the figure below, and the set value is 20 M, which can help to see if the curve touches this line.
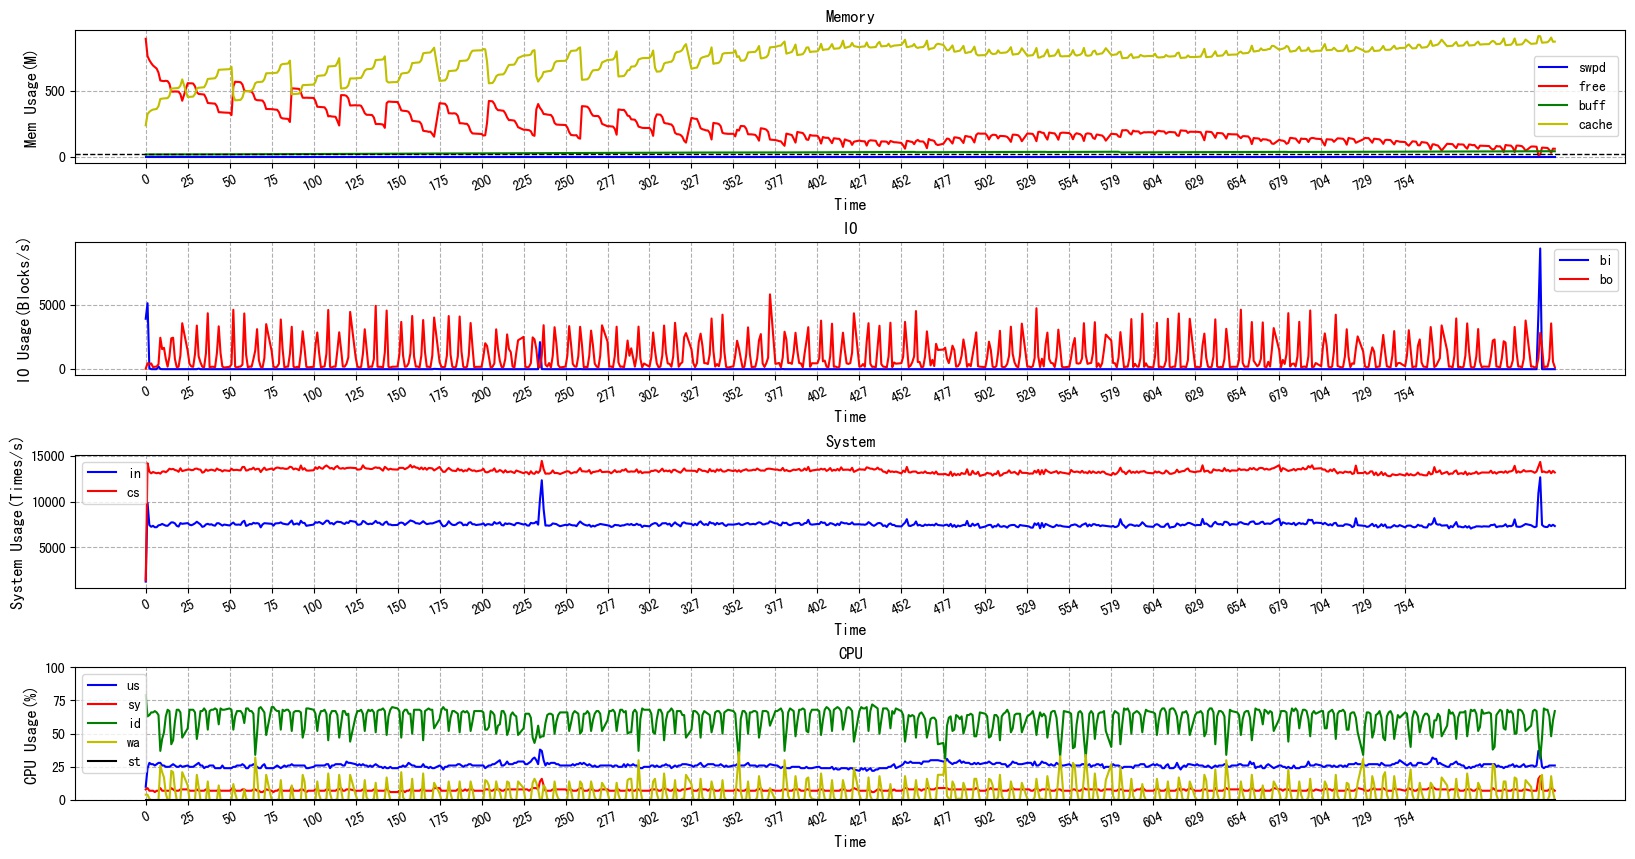
Of course, all indicators on vmstat can display:
python sclean.py -v example/log/vmstat.log -vm -vi -vs -vc
This command displays the usage status of Memory, IO, System, and CPU during this period.
- The "-o" parameter specifies the path of the output file.
- The "-pic" parameter specifies to save as jpg format.
