The troll is a C-language source-level debugger for ARM Cortex-M systems, accessed with the excellent blackmagic hardware debug probe, and a customized variant of the blackmagic - the vx/blackstrike (or blackstrike for short). The troll only supports source-level debugging of source code programs written in the C programming language, compiled to executable files in the ELF format, containig DWARF debug information.
Note that this is a very special case of a debugger:
- it only targets ARM Cortex-M based systems
- only the C language is supported for source-level debugging
- only the blackmagic and blackstrike hardware debug probes are supported
- tre troll itself is written in C++
- the troll itself heavily relies on the Qt framework
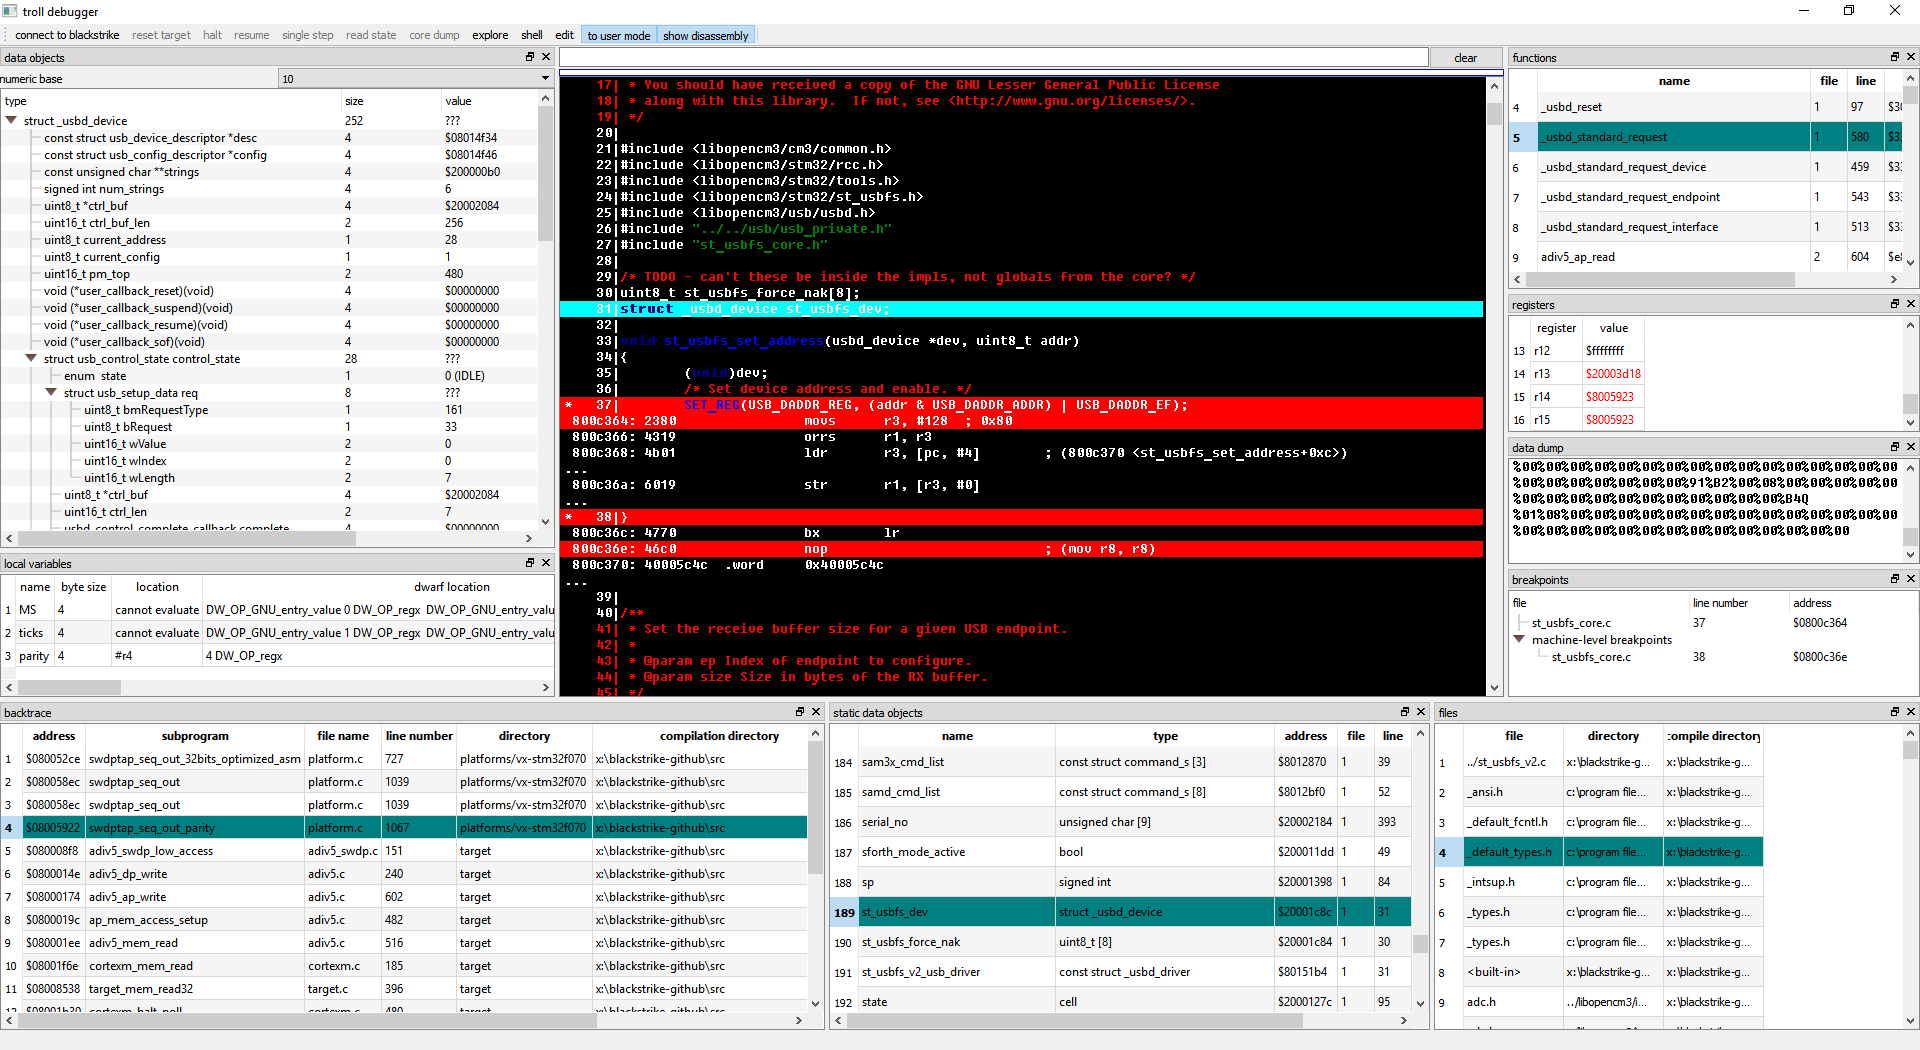
Here is a screenshot of the troll's graphical user interface, as of 28022017:
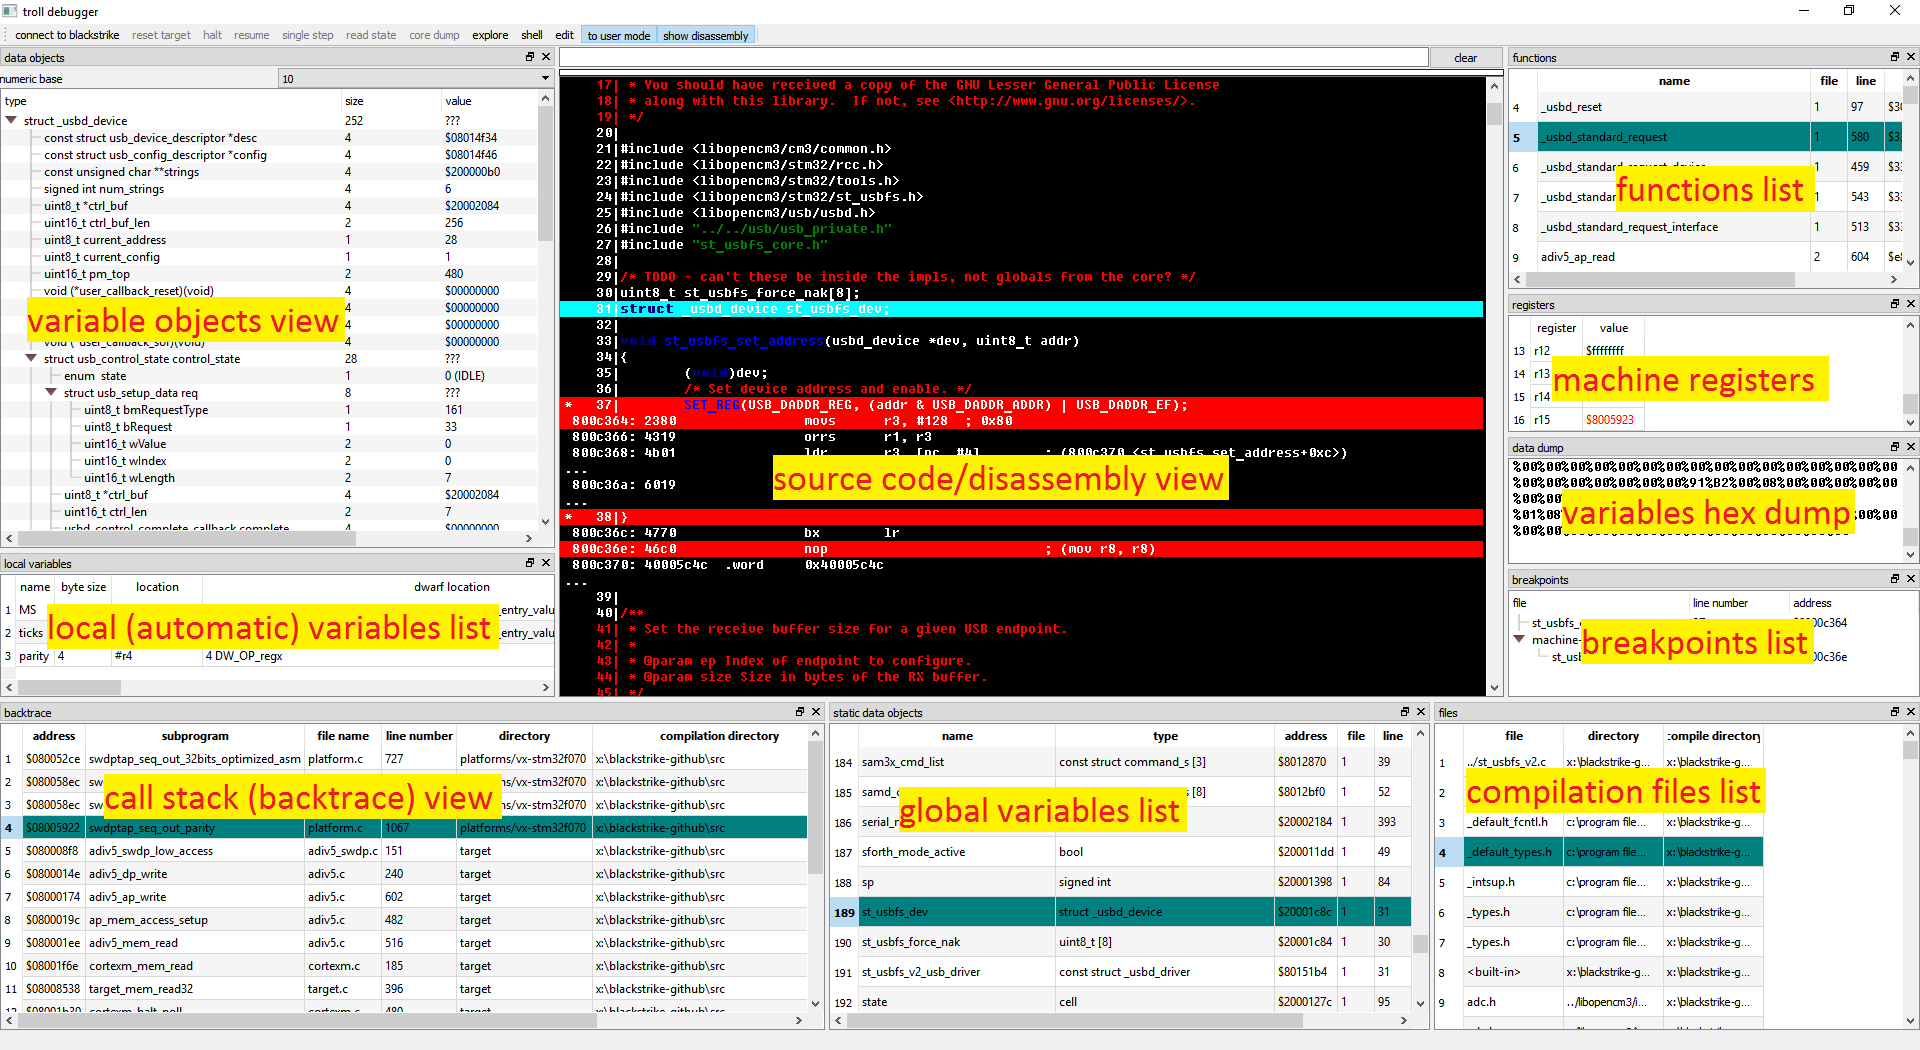
This is an annotated version of the screenshot above, showing the various display views of the troll:
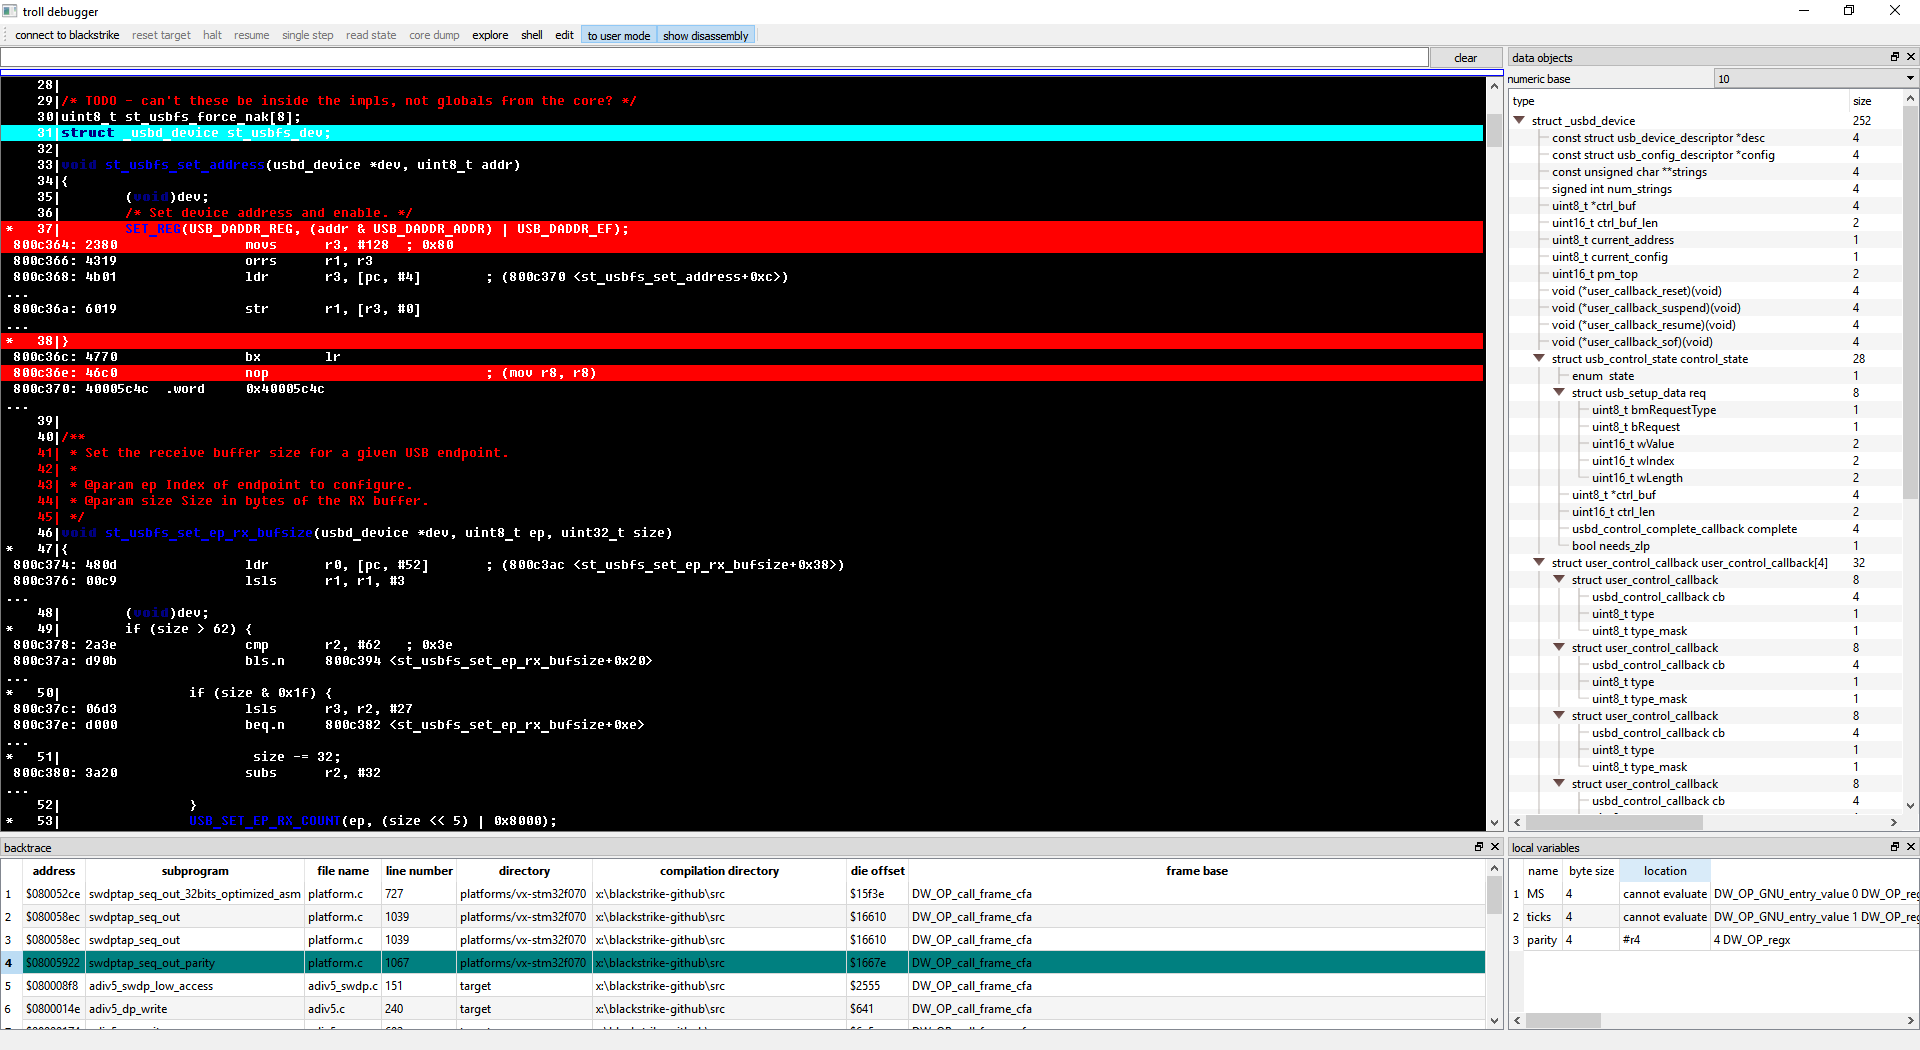
Here is a simplified, more realistic in everyday usage, view, as of 28022017::
It is simple and easy to give the troll a try! For debugging and evaluation purposes, the troll supports operation in a so-called static test-drive mode. In this mode, no connection to a live target system is established, and instead the troll reads the contents of target memory and registers from files. In this mode, the troll does not invoke any external tools it otherwise relies upon, and all necessary data for the troll's operation is being fetched from files with hard-coded names. This static test-drive mode of operation is intended for troll rapid prototyping and debugging, and demonstration of the capabilities of the troll.
To give the troll a try, first clone it from github, and initialize and update submodules:
git clone https://github.com/stoyan-shopov/troll.git
cd troll
git submodule init
git submodule update
Next, build the troll. The troll makes use of the Qt framework. I prefer building the troll from within the Qt Creator IDE, but you may also build it by using the qmake and make utilities, directly from the command line.
Finally, do obtain a static test-drive set of test files from here:
https://github.com/stoyan-shopov/troll-test-drive-snapshots
Extract the troll-test-drive-files directory in the troll's working directory.
Now you are all set up, and ready to go - just run the troll.
As of time of writing this (01042017), the troll has been in
intermittent development for roughly six months. This project is
still very experimental and immature, but I (Shopov) believe
it does look promising. The code is currently horrible,
undocumented, and looks evil. Yet, it does have one virtue -
the code is small. The essential troll code is in just
two source code files - these are troll.cxx and libtroll.hxx.
The code in file troll.cxx is the debugger 'front-end' -
it drives the graphical user interface and communicates with
the target device that is being debugged - this file is currenly
roughly 1500 lines of code. The code in file libtroll.hxx
decodes the DWARF debug information and supplies the front-end
with easy-to-use information such as how to unwind the target
call stack, what the data type of a data object is, where
data objects reside in the target, what
address, or addresses, of generated machine code correspond to
a line in the source code - that is useful for operating on breakpoints,
what the local variables in a subprogram are - and much, much more.
This file is currently roughly 2400 lines of code.
Together, the code of the troll debugger front-end (in file troll.cxx),
and the debug information processing engine (in file libtroll.hxx) - in all,
are roughly 4000 lines of code.
Even though in many respects broken and incompletely supported, these 4000 lines of code currently do provide these debugging capabilities:
- target call stack unwinding (including stack unwinding from within interrupt service routines)
- structured data displaying - array displaying, hierarchical displaying of data structures, support for bitfields and decoding of C language enumerator values to symbolic names
- displaying of the current source code location in the program being debugged, with optional disassembling of the source code
- providing a list of subprograms (C functions), global and local (to subprograms) data objects in the source code program, and navigation in the source code to the place of definition of the subprograms and data objects
- target execution control - setting/clearing of breakpoints, instruction-level stepping, resuming, halting and restarting target execution
- target flash memory programming and verification
The code of the troll needs to grow in order to completely and gracefully support all of the features described above, but how is it possible to support all of the features described in a meager 4000 lines of code?
The observations described below have been taken in account in order to keep the code of the troll small and simple:
- the troll does not attempt to support any target architecture other than the ARM Cortex-M, and any target source code language, other than the C language; besides, the troll is written in C++, and makes heavy use of the Qt framework, and of the facilities that the Qt framework provides
- normally, a debugger utilizes some library that provides
structured access to the compiler-generated executable file
(e.g., in the ELF file format), in order to access sections
of debugging information and generated machine code that
resides in the target. Such a library, for example, is the
libbfdlibrary - the Binary File Descriptor library, or thelibelflibrary. The troll does not use such a library. In order to locate the DWARF debug information sections in the compiler-generated executable file in the ELF file format, the troll simply executes theobjdumputility in order to display the locations of the debug information sections, then parses the output of theobjdumputiility, and finally uses the information provided by theobjdumputility to simply read the debug information sections - with simple file access operations. This is a couple of lines of C++ code, instead of incorporating and utilizing a library, such as thelibbfd/libelflibrary. Also, in order to extract the machine code that resides in the target - the troll executes theobjcopyutility in order to generate an s-record file (often used in production for programming target chips) - out of the ELF executable file. Parsing an s-record file is trivial, and just a couple of lines of C++ code, and no library, such aslibbfd/libelf, is needed in order to achieve this - likewise, the troll does not use a disassembler library
(such as, for example, the
libopcodeslibrary) - instead, the troll runs theobjdumputility in order to generate a disassembly listing of the target executable ELF file, and then parses the disassembly output, builds an index for this output, and uses the index for providing disassembly text for target addresses. Such an approach is very simple, and achieves good results with only a few lines of source code, and avoids the need for an external library for performing the disassembly - there exist excellent general-purpose libraries for
accessing DWARF debug information - such is the
libdwarflibrary. A key decision in the troll is TO NOT use such a library, and thelibdwarflibrary in particular. The troll is not my first attempt to write a debugger, it is the third one, and from my previous, already abandoned, attempts, I learned, that - when your goal is to create a very limited, special purpose debugger such as the troll - it is much easier, simpler, and more efficient to just decode and process the DWARF debug information yourself. A graphical debugger front-end really needs simple answers to questions such as:- Where in the program I am now, and how did I get here, so that I can display a call-stack backtrace?
- Where are local and global variables located, so that I can display their values?
- What is the data type of a variable, so that I can nicely display it?
- What target machine address(es) correspond(s) to a line in the source-code, so that I can set a breakpoint there?
- What target machine addresses correspond to a source-code file, so that I can display a disassembly of the source code, if requested?
General-purpose libraries, such as libdwarf, do not readily
provide answers to such simple questions, because, well, they
are general-purpose libraries - they provide you with relatively
low-level access to the DWARF debug information.
Engineering sane answers to the simple questions from above can
be very involved, technically.
If you need to answer these questions by using such a library,
you need to build an additional layer over such a library, which
will provide the answers. In my experience, this may be not
too pretty and pleasant. Decoding DWARF debug information
is surprisingly easy (if you are familiar with DWARF).
Deciding NOT to use a library, such as libdwarf,
for accessing DWARF debug information, eliminates the
need of building a layer around such a library, avoids
the burden of dependencies of such a library, and - avoids
the need of debugging such a library (yes, I had to debug
the libdwarf library on some occasions in the past).
In summary, deciding NOT to use a general-purpose library for accessing the DWARF debug information by the troll, makes the troll code simpler, smaller, more straightforward, more efficient, and, I hope, easier to maintain, understand and modify.
- FORTH. This fifth point is quite technical. Technically, describing the locations of variables in the machine-code program generated by a compiler, and how to unwind the target call stack, can be complicated. Therefore, a form of powerful, yet compact, easy to produce, easy to consume, and easy to debug, encoding of such information is essential. In DWARF, this has been addressed by defining a virtual, stack-oriented machine, and a set of instructions defined for this virtual machine. This, in essence, is FORTH. The computation of data object locations, and call-stack unwinding, in the troll, is written in FORTH, it seemed most natural to do so, but will probably turn down anyone that wishes to study and modify the code of the troll. Most probably, this part of the troll will be rewritten in some popular programming language in the future.


