XKCD #688 is meta -- it includes information about itself. Why not try and recreate it?
Of course, there are certain inaccuracies. I didn't try and make the bars the exact same width and the like. The last panel doesn't accurately portray the comic, as the resolution isn't high enough. All that aside, this script works in general.
It turns out that this is an example of fixed-point iteration. In essence, that's just trying to estimate the original function (which just says this pixel is black, this pixel is white). The core of this algorithm is just a for-loop; the function always returns a correct value for the current estimate! As you might guess (I didn't), this estimate might become unstable.
According to Prof. Jarvis Haupt, this algorithm could possibly become unstable. Because the third panel has an infinite regression, it might be possible to set up a non-contractive map where the sequence grows too much and never converges. I couldn't get my comic to be unstable; I'm guessing I could have made long and painful modifications to the code to change it.
This is abstract and non intuitive; you can't see it in the real world. To see it in the real world, let's instead pretend we have a similar equation:
To implement this equation, we would only do
def f(x): return 3.7 * x * (1 - x)
x = 0.5
while True:
    x = f(x)
This for-loop doesn't appear to be unstable, but after you examine the first
couple values, you can see it clearly is. The first five values of x are
approximately 0.59, 0.89, 0.35, 0.84, 0.48 -- they don't seem to converge to
any particular value.
This problem gets incredibly complex when you consider any
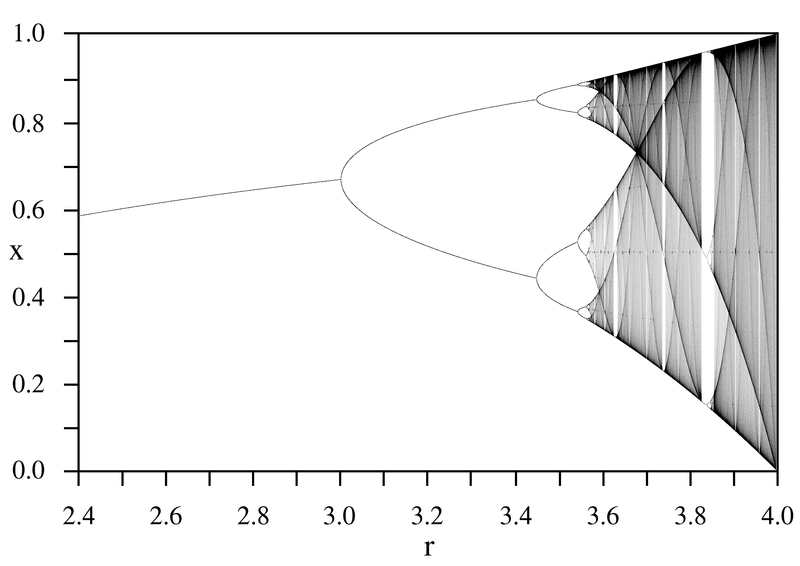
r instead of just 3.7. For this particular and simple function, there's a
graph of values of r and the final settling value:

"LogisticMap BifurcationDiagram" by PAR - Own work. Licensed under Public domain via Wikimedia Commons.
As you can see, for certain values of r, this is unstable. For other values
of r, this algorithm is stable. For some values of r (say r=3.2), this
algorithm oscillates between two values. Of course, there's a whole field of
study behind this. Stability and chaos experts study similar problems in great
depth. I don't know the details to explain the full stability, especially the
reason there are stable regions surrounded by unstable regions.
This is a classic example of the confusion that is found in almost all of mathematics. It's a simple concept (just a for-loop!) that has very deep theory behind it (when is it chaotic?).
There are other implementations available (such as this Mathematica one or this Python one). The purpose of this implementation was not to cover the implementation details; I undertook this project to learn (and share!) some math.


