No matter what type of organization you work in, people working in data science exist on a spectrum of computational skills and background. One of the biggest challenges for computationally-savvy researchers is how to most effectively deliver useful tools to their less-computational colleagues. While Python is an extremely powerful tool for data analysis and visualization, it is not trivial for non-computational researchers to install and run python-based apps on their own computers.
However, recent innovations in WebAssembly have made it possible to run Python code directly inside the web browser. Instead of having to keep a Python server running, you can now just set up a static webpage which performs all of the needed computation directly on the user's machine. In this tutorial I will walk you through a few simple steps for setting up a Python-based web app (using Streamlit) to be launched by users without having to install absolutely anything.
Working as a bioinformatician, I'm always on the lookout for new tools which can help me perform really useful analyses for my collaborators. But the decision to adopt a new tool is not purely based on what it can deliver -- I also have to weigh the difficulty of learning it. For a long time the world of web development felt like it was out of my reach purely from the apparent difficulty of learning JavaScript alongside HTML/CSS.
While it is true that Python (and R) can both be used to set up interactive web apps, those libraries ( Flask, Dash, Streamlit, and Shiny ) are intended to be run on active servers which perform computation on the back-end and then send the results to the front-end on the user's browser. It is inherently much more difficult to run web apps in this way, both because of the expense of keeping a machine constantly running as well as the complexity of providing a protected network connection. There are some wonderful hosted solutions for sharing R and Python based apps, but it's complex enough that I'm not particularly inclined to set up my own version.
The transformational tool which profoundly changed the landscape of software development has been WebAssembly, which makes it possible to compile Python code so that it can be run directly in a web browser. Making code which runs in the web browser is fantastic because you no longer have to ask a user to install any dependencies -- they almost certainly already have a web browser.
The project which has implemented Python in JS is called Pyodide. Using this framework, Yuichiro Tachibana has made a port of the Python GUI library Streamlit called stlite. Using stlite it is possible to write Python code which is run entirely in the web browser, meaning that the user doesn't need to install anything for it to run.
I may not have been as excited by this if I were not already a huge fan of Streamlit. This Python library makes it extremely easy to build a simple GUI which drives any sort of data visualization you like. There is native integration with multiple powerful plotting libraries ( Pyplot, Altair, Vega Lite, Plotly, Bokeh, pydeck, and graphviz ), as well as flexible controls for user input, page layout, and media display.
Most importantly the brainspace-overhead is low -- you don't have to learn much to get up and running. If you are already working in Python and want to quickly prototype and deploy an interactive web app, it is definitely worth your time to explore Streamlit.
And now, those Streamlit apps can be served to users and run directly in the browser.
You can make an effective GUI using Python and stlite as long as you remember that it is being run directly in the user's browser.
- It will take a minute to load -- your users will benefit from patience;
- Operations which require a large amount of memory, CPU, or I/O will likely cause problems -- try to keep the computation as lightweight as possible;
- Any files which you need to read in must also be available to the user's browser, either by (1) hosting them yourself, (2) accessing them at a public URL, or (3) when the user 'uploads' them into the browser;
- Access control matters -- anyone with access to the webpage will be able to run the app and read its source.
This guide will walk you through:
- Copying a template repository on GitHub
- Adding your Streamlit app
- Testing locally
- Deploying publicly to the web with GitHub Pages
To use this guide you should have familiarity with (1) manipulating software repositories on GitHub and (2) running Streamlit locally.
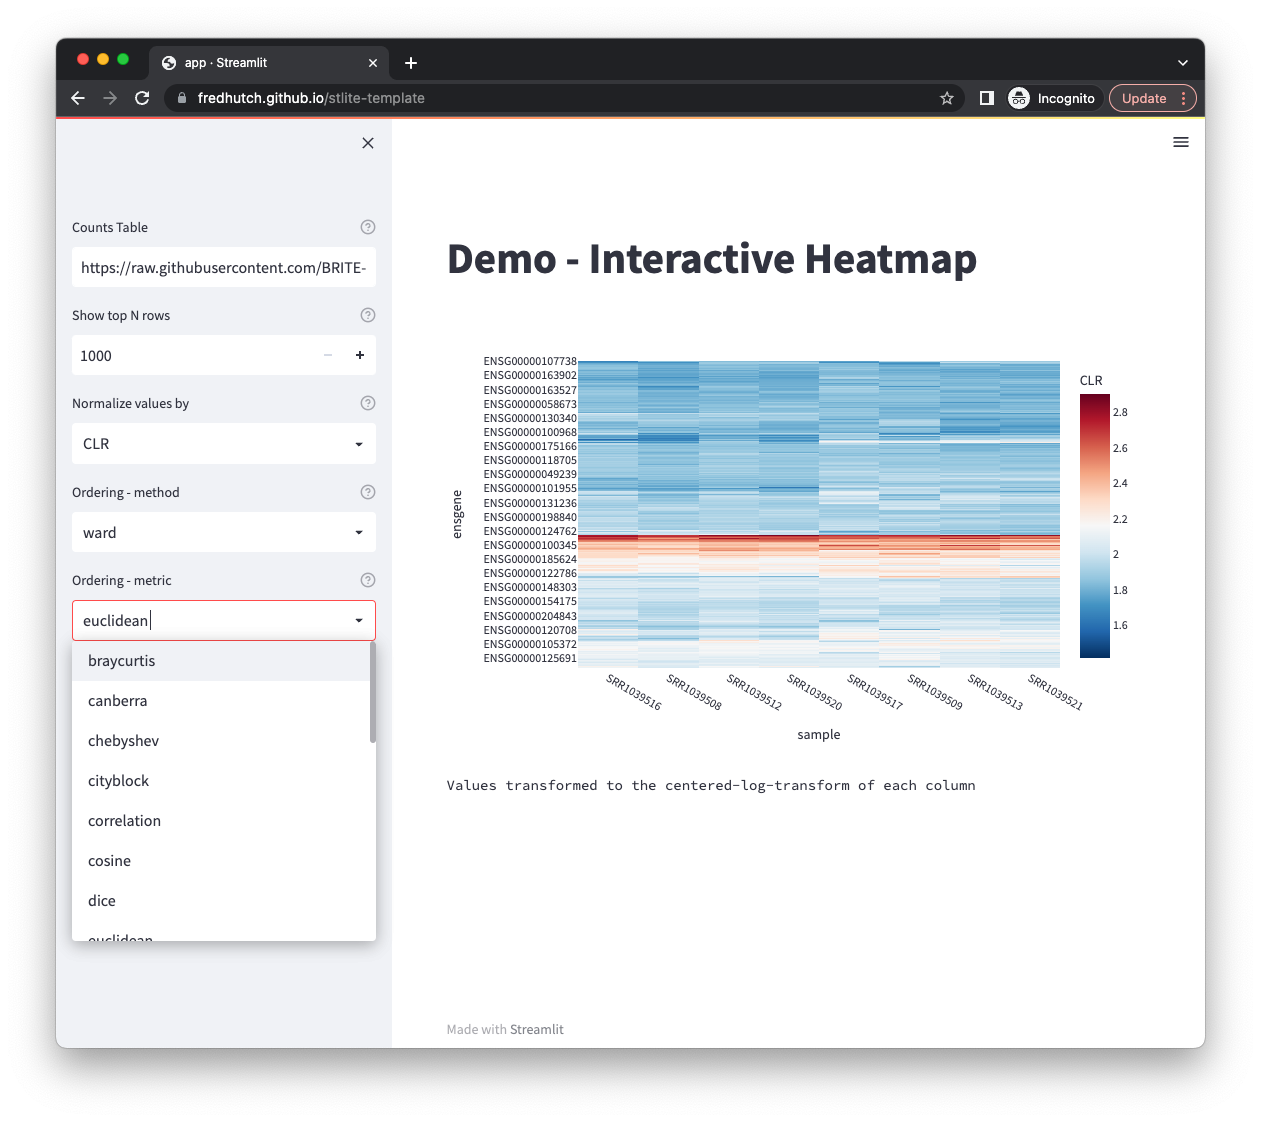
To get an idea of how a GitHub repository can be transformed into an interactive data visualization app, you can see that this template repository (FredHutch/stlite-template) has been hosted at https://fredhutch.github.io/stlite-template/.
The example app in the template reads in a set of RNAseq counts (with data from the BRITE-REU programming workshops), normalizes the data by CLR or proportional abundance, performs linkage clustering on the rows and columns, and displays an interactive heatmap to the user.
Navigate to the FredHutch/stlite-template repository and fork it into your own account or organization. Make sure to change the name and description, since you will be making something entirely new.
All of the code needed to run your app should be placed in the repository. Depending on what your app does, you may also need to take some additional steps:
- Place all of your Python/streamlit code in the file
app.py; - Add any libraries which are imported by the app in line 25 of
index.html(e.g.requirements: ["click", "scipy", "plotly"],); - If you have any
@st.cachedecorators in your streamlit app, add the argumentshow_spinner=False(to account for a known bug in stlite)
The trickiest part of this process that I ran into was how to read in external data sources (e.g. CSV files). Luckily, the solution didn't end up being too complex.
The core issue is that the requests library isn't currently supported
in Pyodide.
This leads to errors when using helpful functions like pd.read_csv,
which use requests behind the scenes.
Instead, the best way to read in remote files from inside the browser
(keeping in mind that all files will be remote for your users, even
any additional files which you set up in your repository) is to use
the pyodide.http library.
However, the pyodide library isn't available when testing locally
inside Python, just as the requests library isn't usable when running
inside the browser.
To account for this, I made a small helper function which reads a CSV from a URL using whichever library is appropriate to the execution context:
import streamlit as st
import importlib
import requests
from io import StringIO
if importlib.util.find_spec("pyodide") is not None:
    from pyodide.http import open_url

@st.cache(show_spinner=False)
def read_url(url:str, **kwargs):
    """Read the CSV content from a URL"""

    # If pyodide is available
    if importlib.util.find_spec("pyodide") is not None:
        url_contents = open_url(url)
    else:
        r = requests.get(url)
        url_contents = StringIO(r.text)

    return pd.read_csv(
        url_contents,
        **kwargs
    )
Feel free to copy or modify this code as needed to read in the data files you may need for your app.
The most interesting and useful apps process and transform data in some way for display and interaction with the user. When considering how to get data into your app, there are three primary options:
- Use data which is available at a public URL (as shown in the example repository);
- Ask the user to upload the file directly using the streamlit file uploader utility;
- Host the data yourself, uploading it to the web in a location which can be accessed by the app.
While hosting the data yourself (option 3) may seem daunting, it is actually made extremely easy using the steps outlined below for publishing your app using GitHub Pages. Once you publish your app to a particular URL, any additional files which you've added to your repository will also be available at that URL and can be read in by the app. So if you want to add some data files which can be read in by the app, follow this tutorial through to the end to figure out what URL it will be available at, and then update your app to read from that URL.
Before deploying your app, it is extremely helpful to test it out locally. First, you can launch the app using your local copy of Python (with streamlit installed) with:
streamlit run app.py
After debugging any errors which you find, the next step is to launch a local web server to test your code directly in the browser with:
python3 -m http.server
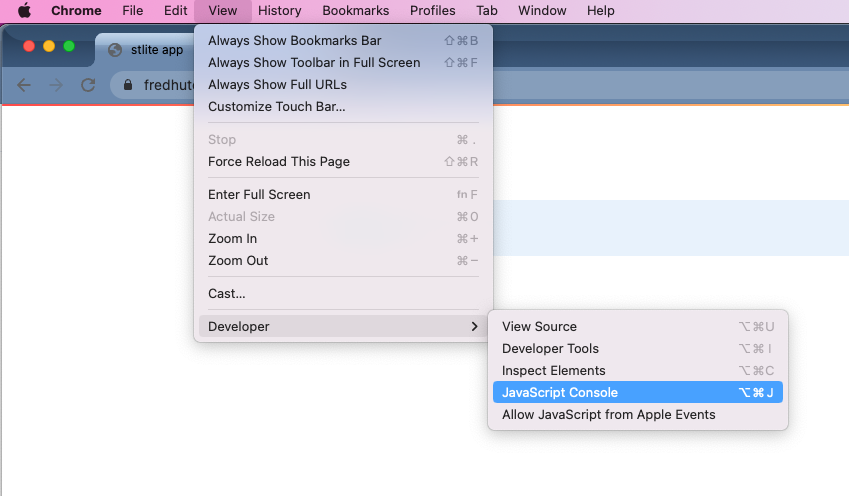
When checking for errors in the browser, it is always good to open up the JavaScript Console (shown here in Chrome):
While there are many ways to deploy a website, I find GitHub Pages to be the easiest way to turn a code repository into a public webpage. Users who pay for Enterprise-level accounts can also create private websites, but anyone can create a public-facing page.
Just to be clear, even if your repository is private the published webpage will still be public -- you have been warned.
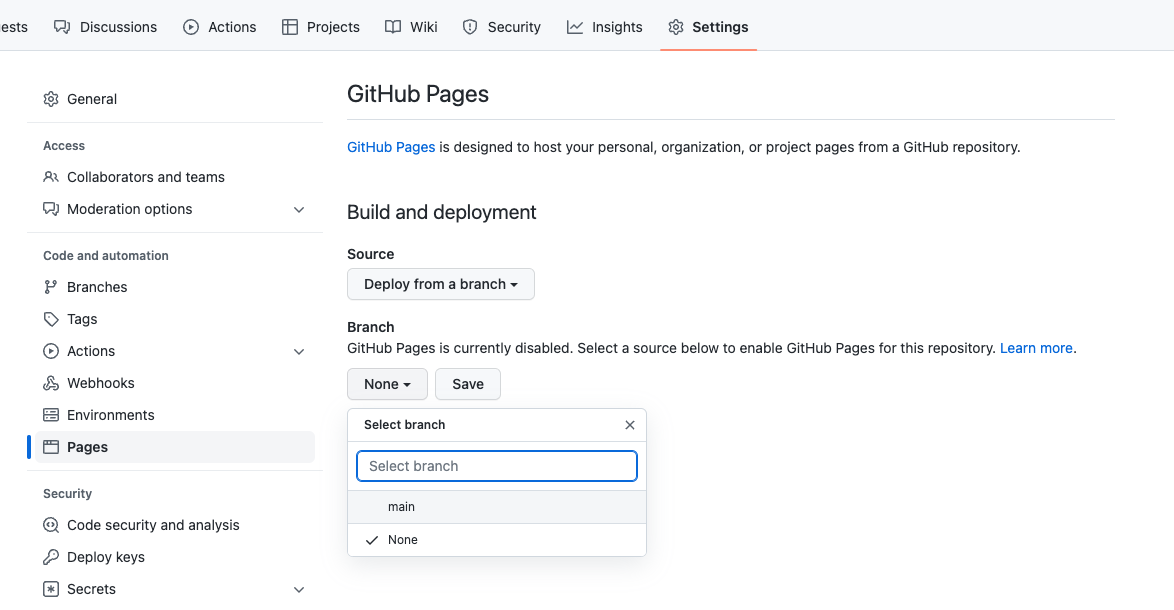
To deploy to the web:
- Navigate to the webpage for your repository (
www.github.com/<ORG>/<REPO>); - Click on "Settings";
- Click on "Pages" (under "Code and automation");
- Under "Branch" select "main" (or whichever branch of the repo you would like to set up);
- That's it!
You will soon be able to find your webpage at a URL which is
based on your organization and repository name (although there
are options to customize the domain name). E.g. https://<ORG>.github.io/<REPO>/.
For example, the template repository https://github.com/FredHutch/stlite-template is hosted as a webpage at https://fredhutch.github.io/stlite-template/.
Getting back to the explanation of uploading static data files, any
files which are added to the template repository could be read by
the app with that URL, e.g. https://fredhutch.github.io/stlite-template/data_file.csv.
Now that you've successfully built your first serverless web app, it may be worth reflecting on what role GUIs may play in your work, if any at all. While it is very appealing to put a tool directly in the hands of your user/customer/collaborator, it is also clear that not all tools should be put in their hands.
Many tasks in data science require large amount of compute resources, which either would take far too long to run on a laptop, or would require access to remote resources with robust authorization and authentication controls. Other tasks are driven by complex parameter inputs which may not be easy to explain to a non-specialist user, or which may return results which are difficult to interpret.
The ideal GUI for a web app will provide responsive and informative visualizations which allow the user to explore and discover in a manner which would not be possible with a static image. It's worth exploring the opportunities for mouseover data, interactive widgets, and any other ways that the rich features and complexities of your data can be exposed. If you're really successful, someone will figure something out from your data which you didn't even realize yourself.
If you found this useful, take a minute to consider all of the people who have worked to support the free and open source software projects it is based on. Also please consider supporting the stlite project to help keep it going. In addition to all of the amazing software projects which were referenced above, I wanted to acknowledge the contribution of Nathan Thorpe, who helped me write my first-ever piece of JavaScript.


