EFKOpenShift
Openshift: Cluster Logging components
The cluster logging components are based upon Elasticsearch, Fluentd, and Kibana (EFK). The collector, Fluentd, is deployed to each node in the OpenShift Container Platform cluster. It collects all node and container logs and writes them to Elasticsearch (ES). Kibana is the centralized, web UI where users and administrators can create rich visualizations and dashboards with the aggregated data.
Pre-Requisites
IBM Cloud Account.
IBM Cloud CLI installtion : - curl -sL https://ibm.biz/idt-installer | bash. Alternatively we will use IBM cloud shell https://shell.cloud.ibm.com
IBM Cloud Openshift cluster previsioned.
openshift login token.
Steps
- Create openshift-operators-redhat namespace
- Create openshift-operators-redhat OperatorGroup
- Create Elastic Search Operator
- Create role name prometheus-k8s to access openshift-operators-redhat namespace
- Create openshift-logging namesapce
- Create openshift-logging operatorGroup
- Change the virtual memory in all worker nodes(Fot elastic search , virtual memory required is 263754 wheras free cluster provisioned have virtual memory set to 253754. So we will change all worker nodes to update memory
- Create Cluster logging operator
- Create cluster logging Instance (This instance will create our reuired pods in openshift-logging namespace)
You can do this lab either on local terminal ot ibmcloud webshell
start your cloud shell
Start with cloning the directory which contain all the required yaml file
````$ git clone https://github.com/shiprajain14/EFKOpenShift.git ```
go to yaml folder
$ cd EFKOpenShift/yaml
you will find few of the yamls which we will use to create our resources
connect you shell to openshift cluster
copy the openshift logging token copied from openshift console
Logged into "https://c100-e.au-syd.containers.cloud.ibm.com:30142" as "IAM#shiprajain.jain@gmail.com" using the token provided.

You have access to 59 projects, the list has been suppressed. You can list all projects with 'oc projects'

Using project "default".
Welcome! See 'oc help' to get started
Create openshift-operators-redhat namespace using below command
$oc create -f 1_elastic-search-operator-namespace.yaml namespace/openshift-operators-redhat configured
Create openshift-operators-redhat OperatorGroup
$ oc create -f 2_elastic-search-operator-group.yaml operatorgroup.operators.coreos.com/openshift-operators-redhat configured
Create Elastic Search Operator
subscription.operators.coreos.com/elasticsearch-operator configured
check if elastic operator is installed
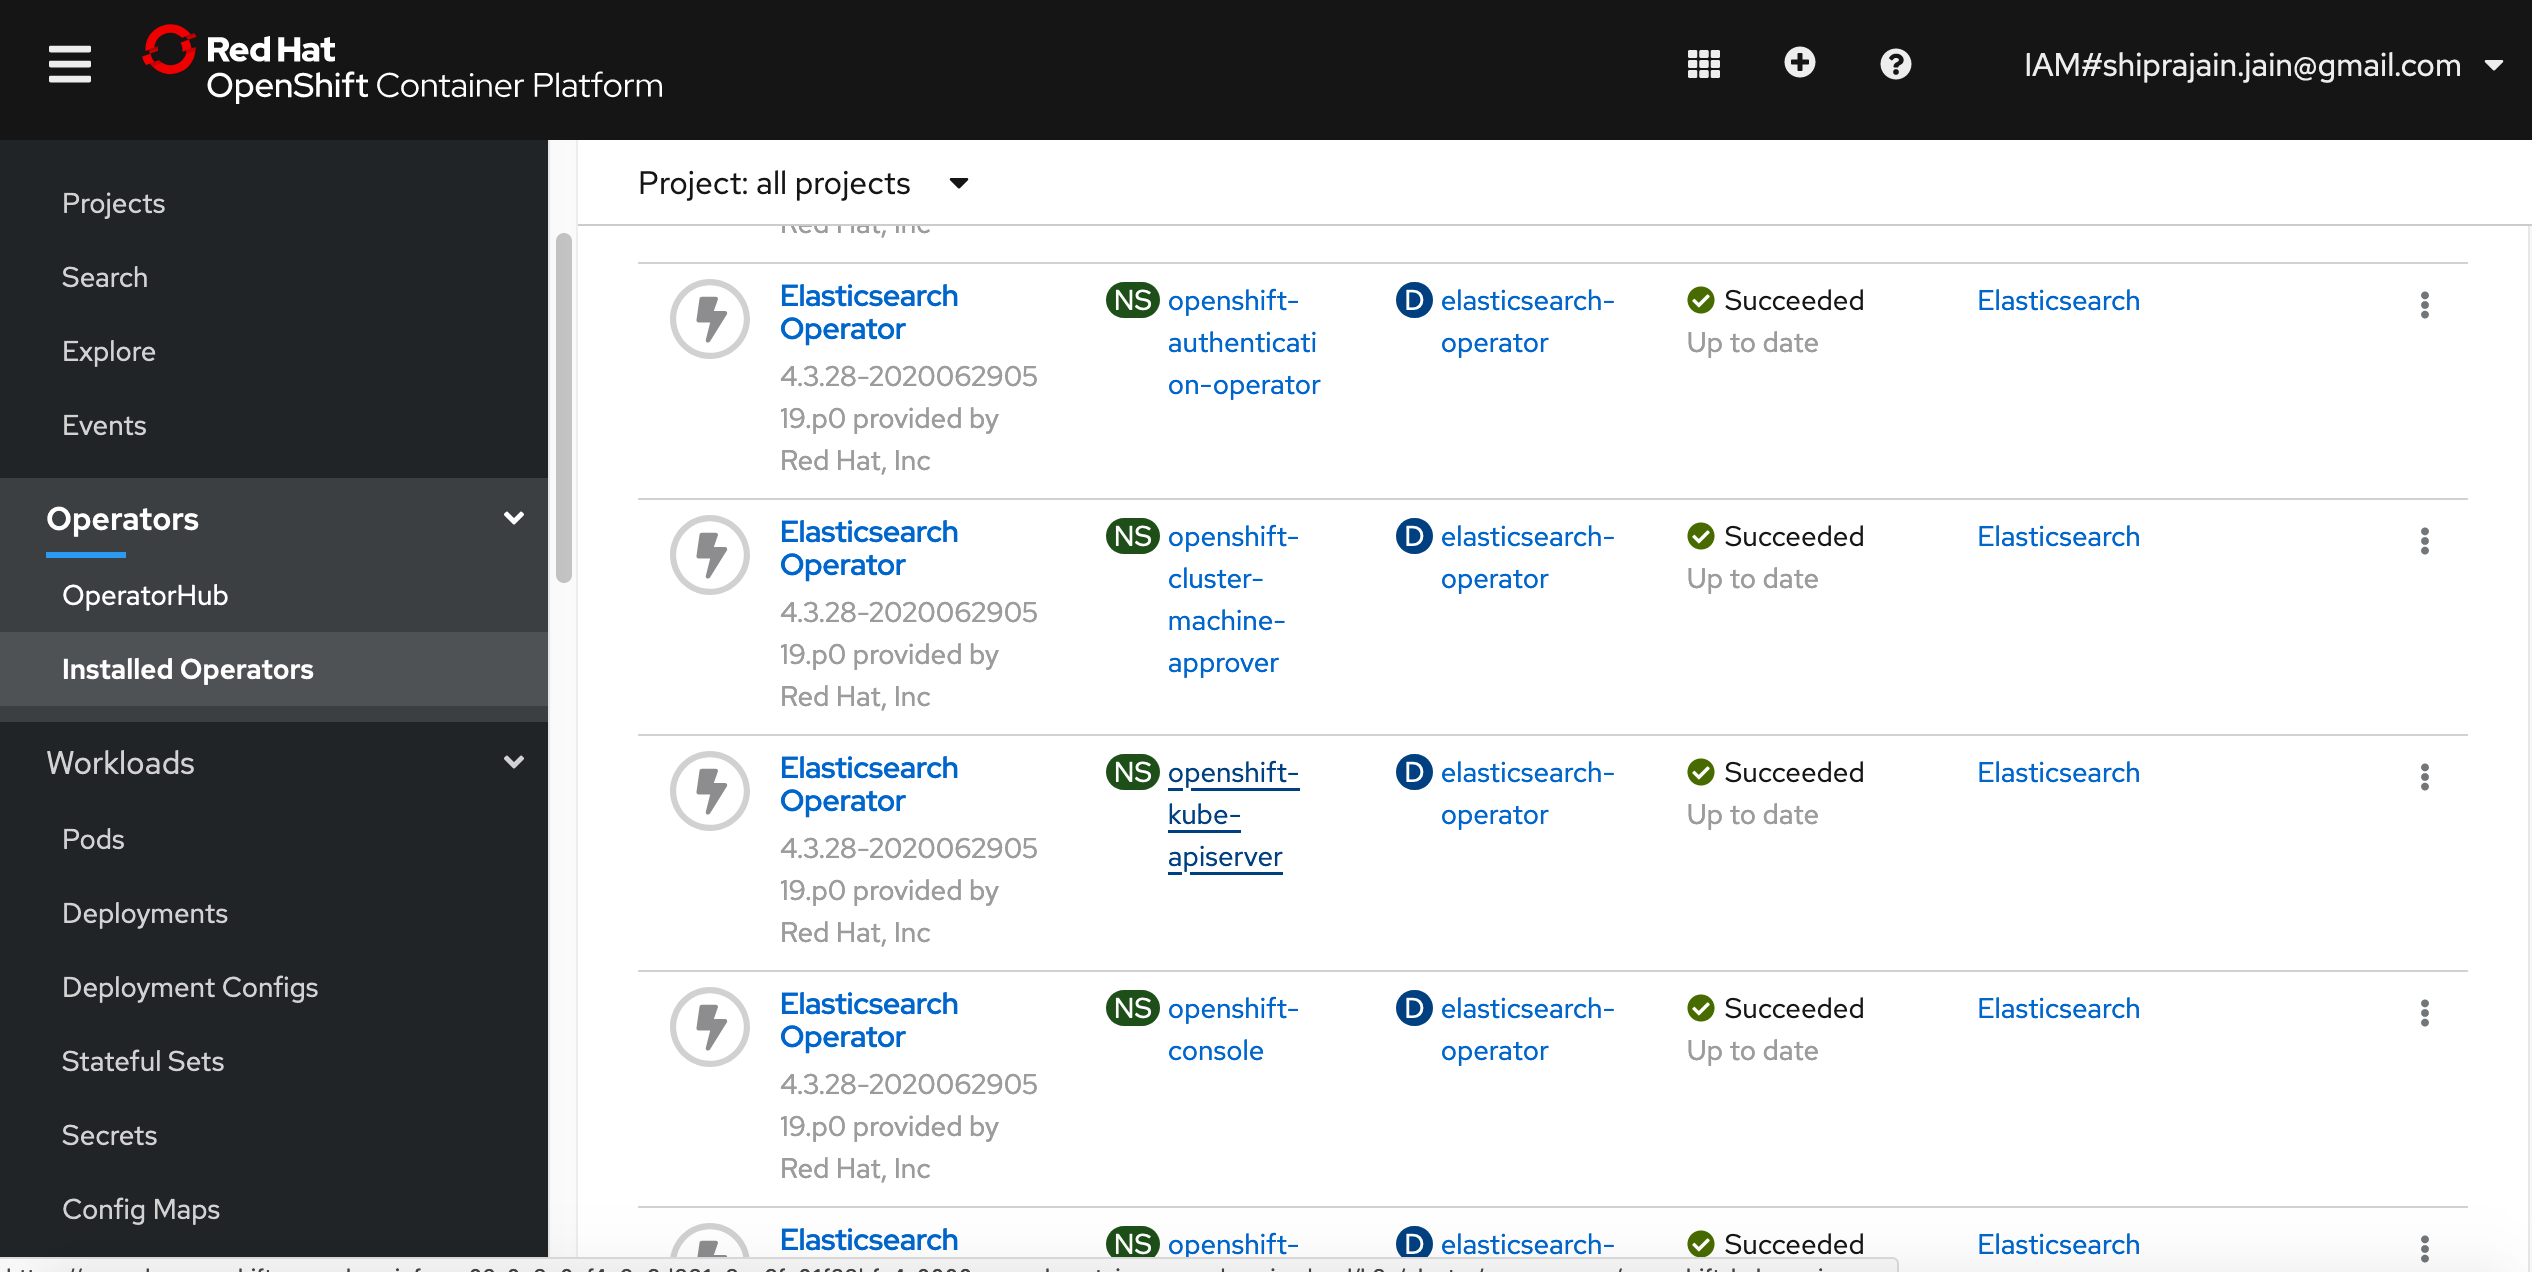
In openshift webconsole got to operators->installaed operators. Slect all projects from the drop down . You should see eastic operator is installed in all the namespaces

Create role name prometheus-k8s to access openshift-operators-redhat namespace
$ oc create -f 4_elastic-search-rbac.yaml
Create openshift-logging namesapce
$ oc create -f -f 5_cluster-logging-namespace.yaml
Create openshift-logging operatorGroup
$ oc create -f 6_cluster-logging-operator-group.yaml
change the VM of worker node
-
check the name of your cluter using command
oc get nodevi worker1.yamlchange the value at last line for key kubernetes.io/hostname: to first worker node name Similarly change worker2.yaml file and worker 3.yaml file with wour worker node name -
use belopw command
oc create -f worker1.yamloc create -f worker2.yamloc create -f worker3.yaml -
Go to openshift webconsole->workloads->pods select kube-system as project , you should see three pods created <img src="./img/workernode.png)
4 click on inspectnode164121 and go to Terminal. type below mentioned commands
sed -i 's/PermitRootLogin no/PermitRootLogin yes/g' /host/etc/ssh/sshd_config
./systemutil -service sshd.service
ssh root@localhost
vi /etc/sysctl.conf
change the value of vm.max_map_count to 263754
follow this step 4 for all inspct node
Create Cluster logging operator
Before creating cluster logging operator we need to do certian pre-requisites
oc project openshift-logging
Every 5.0s: kubectl -n openshift-operator-lifecycle-manager scale --replicas 0 deploy olm-operator                                        Thu Jul  9 08:52:41 2020

deployment.extensions/olm-operator scaled
do a ctrl c to come out delete any existing cluster logging instance
oc delete deployment cluster-logging-operator
Delete any cluster logging operator
oc delete deployment cluster-logging-operator
Create cluster logging operator
oc create clusterloggingOperator_4.3.yaml
Create cluster logging Instance
oc create -f clusterlogginginstanceIBM.yaml
check pods using command
oc get pods
add new volume and volume mount
Update the default value of the container logs in the Fluentd daemon set.
Change your cluster logging instance management state to unmanaged by following By making the cluster logging instance unmanaged, you are able to update component configurations so that they are not overwritten. Do not change the Elasticsearch management state.
oc edit ClusterLogging instance
apiVersion: "logging.openshift.io/v1"
kind: "ClusterLogging"
metadata:
  name: "instance"

....

spec:
  managementState: "Managed"
change Managed to Unmanaged
From the OpenShift console openshift-logging project, click Workloads > Daemon Sets, and click the Fluentd daemon set. go to yaml tab and in the volumeMounts section, add the /var/data container log path to the mount path.
- mountPath: /var/data
   name: vardata
In the volumes section, add the /var/data container log path to the host path.
  - hostPath:
    path: /var/data/
    type: ""
  name: vardata
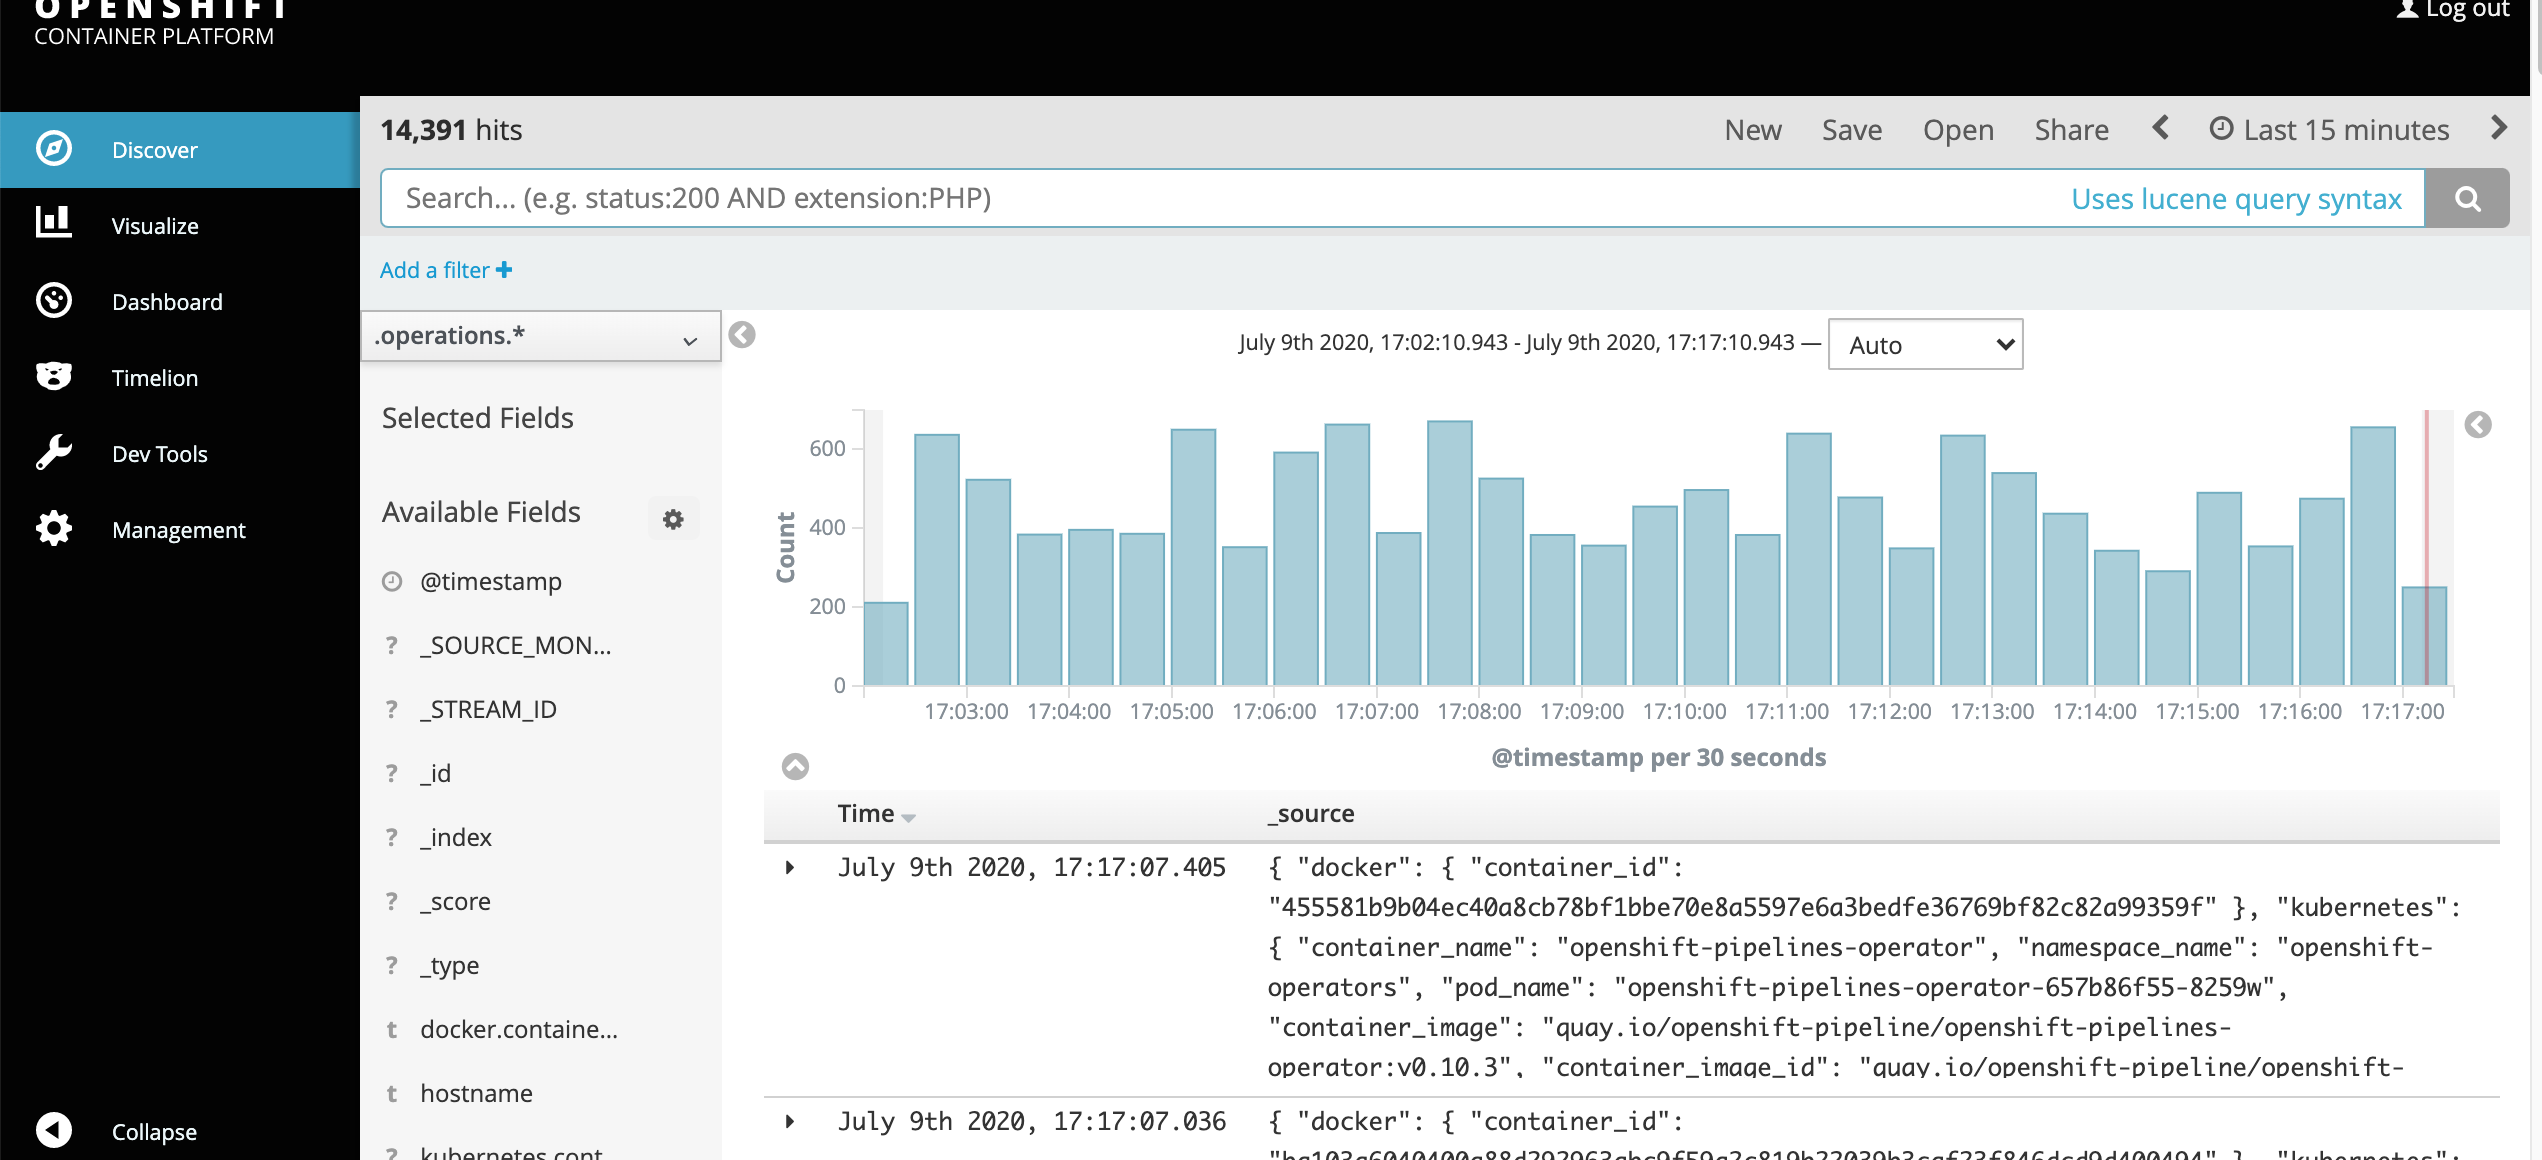
Verify that container logs are sent to Elasticsearch by checking the Kibana console.
In openshift webconsole , under monitoring drop down , click on loging . This will redirect you to kibana dashboard
