Kubernetes has ways to extend its metrics APIs, but they have limitations, especially that they only allow you to use a single observability platform such as Prometheus, Dynatrace or Datadog. The Keptn Metrics Operator solves this problem by providing a single entry point for all your metrics data, regardless of its source, so you can use multiple instances of multiple observability platforms. Recently I tried Keptn Metric Operator and HPA exercise and I thought it would be a good idea to share my experience with the community.
For this exercise, I will use the kind local Kubernetes cluster. You can install it by following the instructions here. After installing kind, create a cluster by running the following command:
kind create cluster You should see output similar to the following:

For this exercise we will be using prometheus as our observability platform. I have provided a command for installing
Prometheus in the Makefile. Navigate to the install directory and run the following command. This will install Prometheus in the monitoring namespace.
make install-prometheusLet's verify that Prometheus is installed and collecting metrics from the cluster. First, port-forward Prometheus to your local machine:
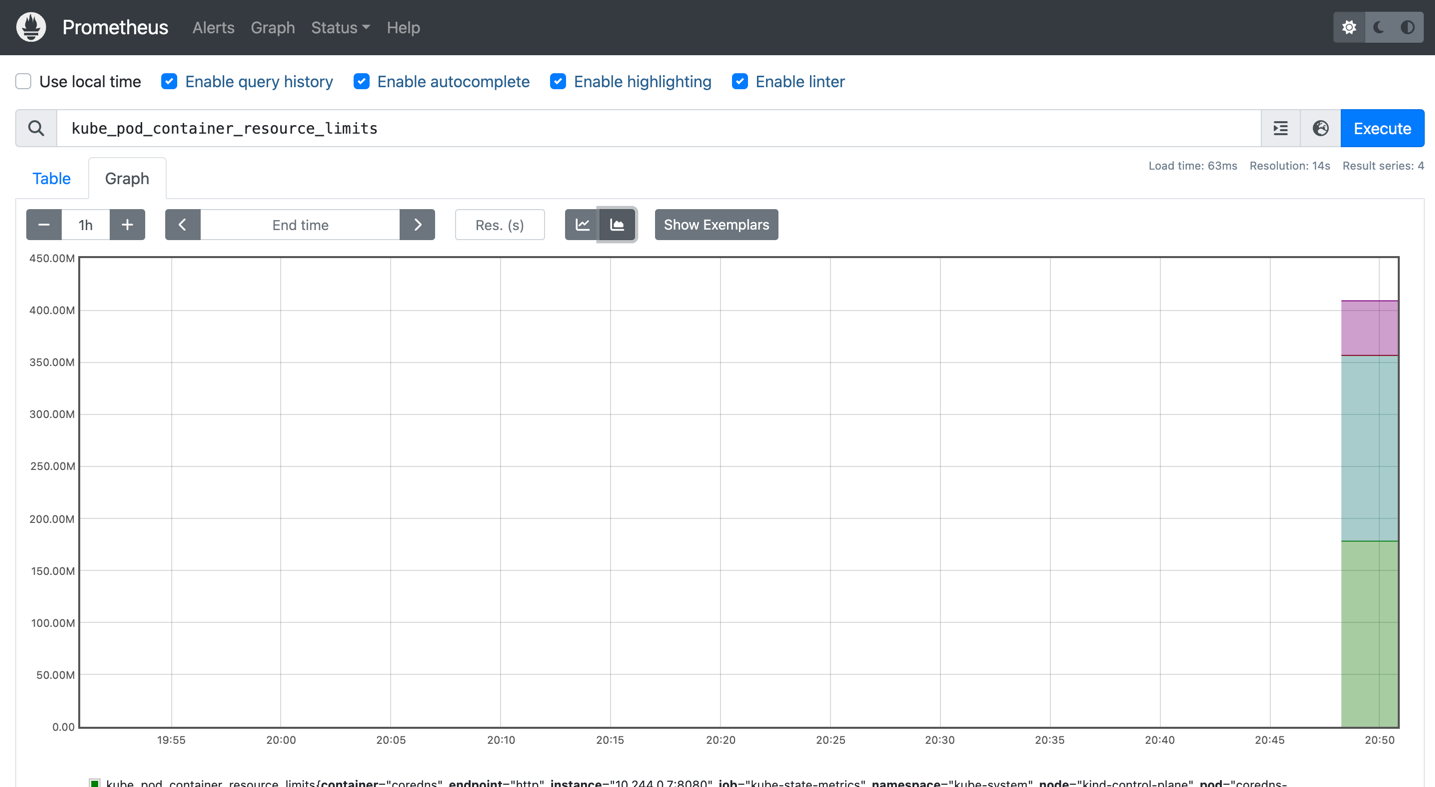
kubectl port-forward svc/prometheus-kube-prometheus-prometheus 9090:9090 -n monitoringNow visit, http://localhost:9090/ in your browser. You should see the Prometheus UI. Click on Graph and enter kube_pod_container_resource_limits in the Expression field and click on Execute. You should see output similar to the following:
Let's deploy the PodtatoHead podtato-head-entry service. We will use this app for our demo. The manifest file for PodtatoHead is provided in the demo directory. Navigate to the demo directory and run the following command:
kubectl apply -f podtato-head-entry.yamlAfter applying, please ensure that the application is up and running:
kubectl get pods -n podtato-kubectlYou can also port-forward the PodtatoHead service to your local machine:
kubectl port-forward svc/podtato-head-entry 9000:9000 -n podtato-kubectlNow, visit http://localhost:9000/ in your browser, and you should see the PodtatoHead app.
Navigate to the install directory and run the following command:
make install-keptnNow apply keptn-metrics.yaml and keptn-metrics-provider.yaml from the demo directory:
kubectl apply -f keptn-metrics.yaml
kubectl apply -f keptn-metrics-provider.yaml
View metrics by running the following command:
kubectl get KeptnMetric -n podtato-kubectl You should see output similar to the following:

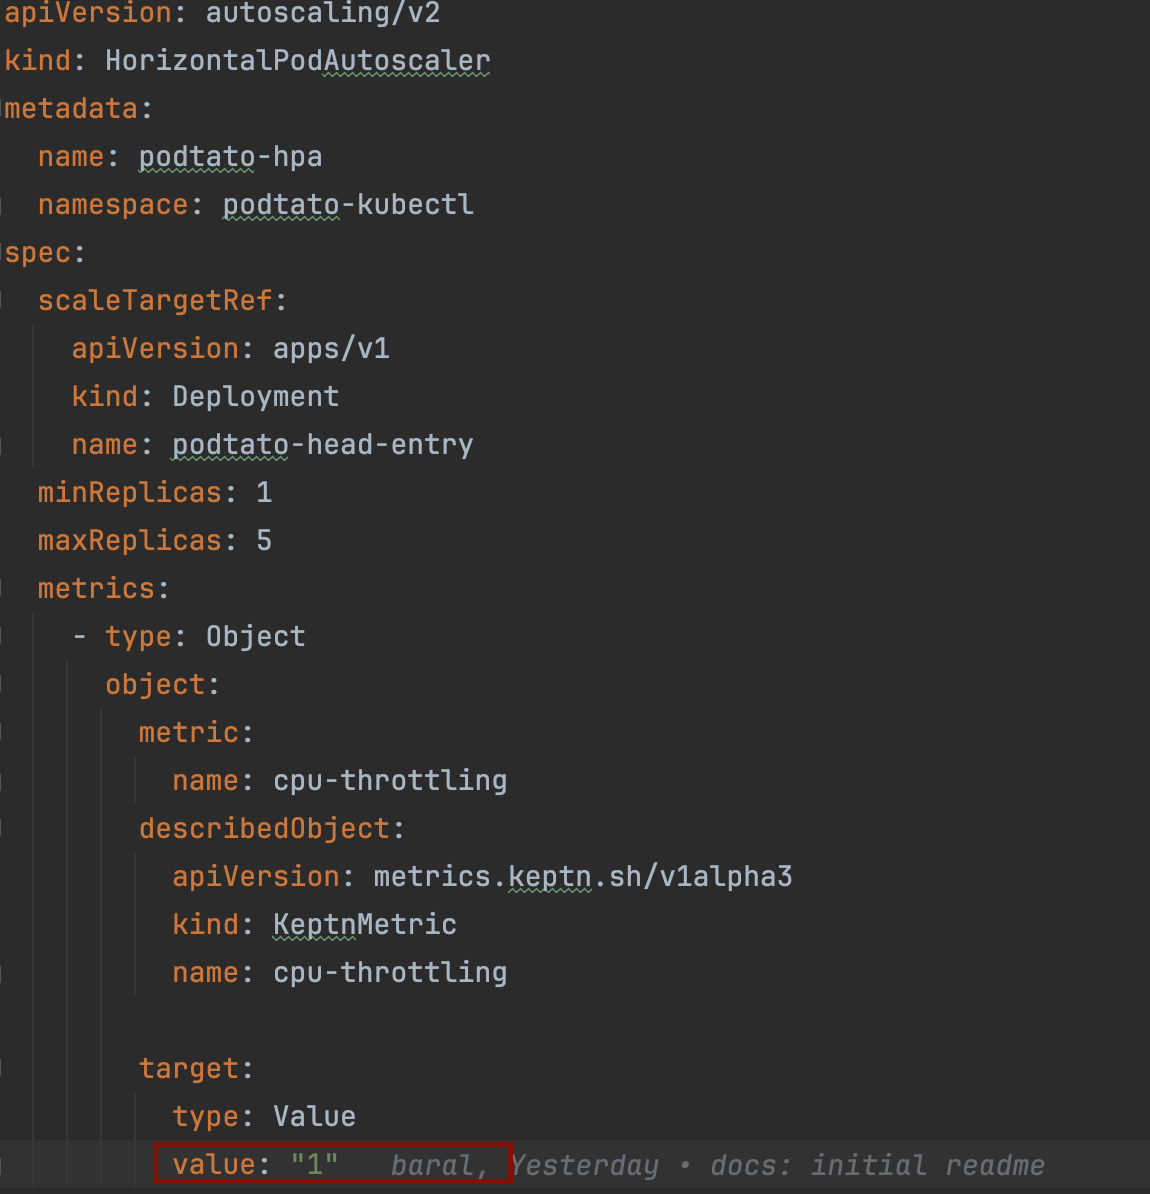
Now that we are able to retrieve the value of our metric and have it stored in our cluster in the status of our KeptnMetric custom resource, we can configure a HorizontalPodAutoscaler to make use of this information and scale our application automatically:
kubectl apply -f hpa.yamlIn our HPA configuration, we specified the target to scale our deployment when we get metric value greater that 1.
 Sometimes it takes a while for the pods to scale up. If you don't see the pods scaling up, please wait for a while until the metrics value reaches greater than
 1.
After a while, you should see the pods scaling up:
kubectl get pods -n podtato-kubectl- keptn metric docs https://keptn.sh/latest/docs/reference/crd-reference/metricsprovider/#files
- Keptn + HPA example https://keptn.sh/latest/docs/use-cases/hpa/#set-up-the-horizontalpodautoscaler


