KAFQA
Kafka quality analyser, measuring data loss, ops, latency
Features
- You can run as producer and consumer to verify kafka cluster doesn't have issues
- You can run as producer and consumer separately to another kafka cluster where data is being mirrored and verify latency
- Easy to increase throughput as it affects latency of cluster
- Consume an existing topic from kafka cluster and measure latency
- Live metrics for latencies, ack, throughput and easy to setup alerts on latency threshold breach
- Deployable with helm chart, scalable with kubernetes
Getting Started
These instruction will help you run kafqa locally against a kafka cluster
Prerequisites
- running kafka cluster
- Go >= version 1.12
Steps
- ensure go modules is enabled GO111MODULES=on if part of GOPATH and having old go version.
- ensure kafka broker mentioned in config is up.
source kafkqa.env && go build && ./kafkqa
Running tests
- run
maketo run tests including linting
Dashboard
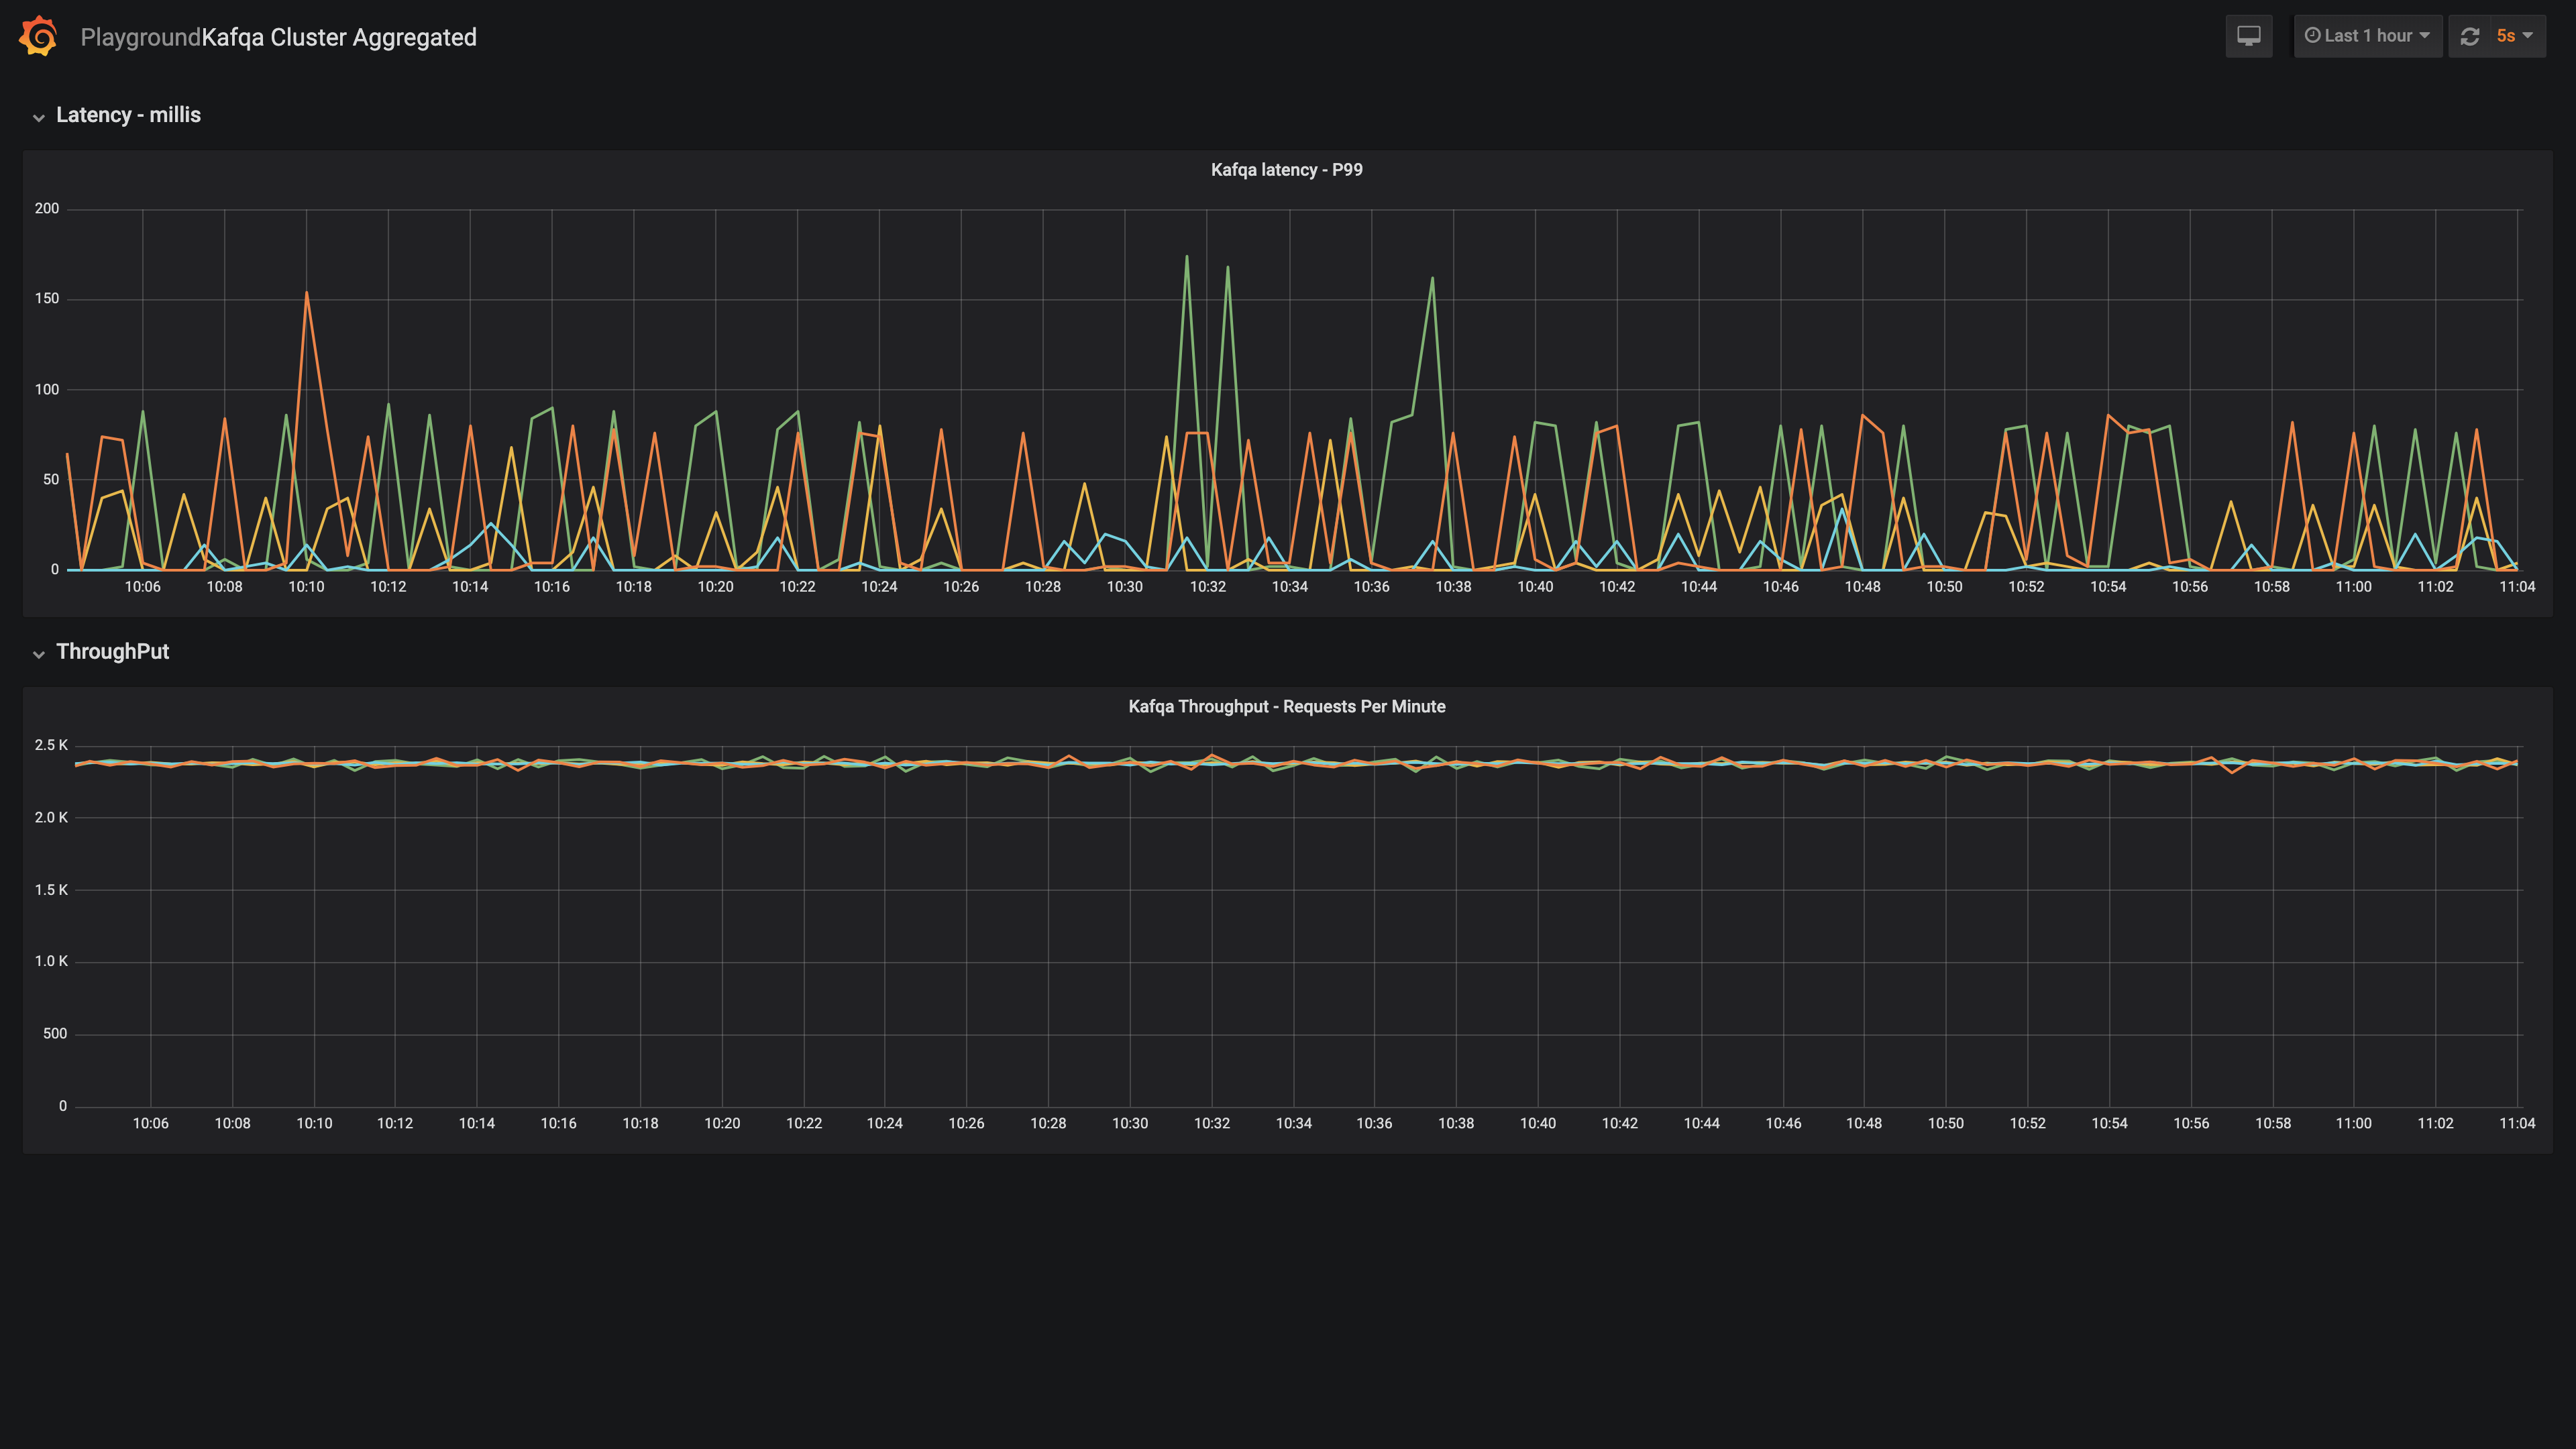
prometheus metrics can be viewed in grafana by importing the dashboard in scripts/dasbhoard
The screenshot below shows setup for multiple cluster being tracked and we've alerts on that. 90,50 percentile could be added if required.
- First pane have
99 %lee2e latency from produce till consume of a kafka message - Second pane shows the throughput
Report
Tool generates report which contains the following information.
- latency: average, min, max of latency (consumption till msg received)
- Total messages sent, received and lost
- App run time
+---+--------------------------------+--------------+
|   |          DESCRIPTION           |    VALUE     |
+---+--------------------------------+--------------+
| 1 | Messages Lost                  |        49995 |
| 2 | Messages Sent                  |        50000 |
| 3 | Messages Received              |            5 |
| 3 | Min Consumption Latency Millis |         7446 |
| 3 | Max Consumption Latency Millis |         7461 |
| 3 | App Run Time                   | 8.801455502s |
+---+--------------------------------+--------------+
This is a static report which helps do quick test. We also have metrics being published runtime, where we've our alerts/dashboards configured on multiple cluster.
Data
Message format sent over kafka
message {
    sequence id
    id (unique) UUID
    timestamp
    random (size s/m/l)
}
Running separate consumer and producers
CONSUMER_ENABLED, PRODUCER_ENABLEDcan be set to only run specific component- setting
PRODUCER_TOTAL_MESSAGES=-1will produce the messages infinitely.
# run only consumer
CONSUMER_ENABLED="true"
PRODUCER_ENABLED="false"
- If you want to consume message produce in proto format from non kafqa producer
- The latency will be measured from the consumed time to the timestamp given in the proto.
export PROTO_PARSER_ENABLED="true"
export PROTO_PARSER_MESSAGE_NAME="com.test.user.UserLocationLogMessage"
export PROTO_PARSER_FILE_PATH=/proto/test.proto
export PROTO_PARSER_TIMESTAMP_INDEX=3
- Requires
redisstore to track and ack messages
STORE_TYPE="redis"
STORE_REDIS_HOST="127.0.0.1:6379"
STORE_RUN_ID="run-$CONSUMER_GROUP_ID"
SSL Setup
Producer and consumer supports SSL, set the following env configuration
CONSUMER_SECURITY_PROTOCOL="ssl"
CONSUMER_CA_LOCATION="/certs/ca/rootCA.crt" # Public root ca certificate
CONSUMER_CERTIFICATE_LOCATION="/certs/client/client.crt" # certificate signed by ICA / root CA
CONSUMER_KEY_LOCATION="/certs/client/client.key" # private key
Disable consumer Auto commit
if consumer is restarted, some messages could be not tracked, as it's committed before processing.
To disable and commit after processing the messages (This increases the run time though) set CONSUMER_ENABLE_AUTO_COMMIT="false"
Configuration of application is customisable with kafkq.env eg: tweak the concurrency of producers/consumers.
Deployment
You can install kafqa on kubernetes with helm chart with sample values file
helm install gojektech-incubator/kafqa --name kafqa-producer-001 --values=kafqa-producer.yaml
Contributing
- Raise an issue to clarify scope/questions, followed by PR
- Follow go guidelines for development
- Ensure
makesucceeds
Thanks for all the Contributors.
License
Licensed under the Apache License, Version 2.0
