In this essay, we discuss how to use sensor data acquisition technologies to create a voting system. The idea is to create a system where a push of a button counts as one vote, and the total votes are analysed on a graphical interface in real-time. The final product consists of 2 physical buttons pertaining to 2 candidates to vote for and a user interface accessible online. So, each time a button is pushed, one vote is counted for the corresponding candidate. Every vote is stored in a database as a string value. The data is pulled to create a dashboard with graphical information about the votes winner and datetime.
Technologies used to acquire the data include two buttons, a breadboard and an Arduino. Software used to capture and store the data include Arduino Studio, Processing and MySQL(RDS in AWS). Finally, to present the data we use Google Data Studio. In this paper, we will include all of our code in Arduino, Processing and MySQL. We will also talk about how we connect our database to Google Data Studio using Amazon Web Services (AWS). This allows us to view the data online and share our results.
In this section, we will cover how to capture the input data from the push buttons and get the computer to read the corresponding string values representing the candidates in the Arduino Studio Serial Monitor. First, we setup our push buttons on the breadboard and connect our Arduino like the diagram shown below.
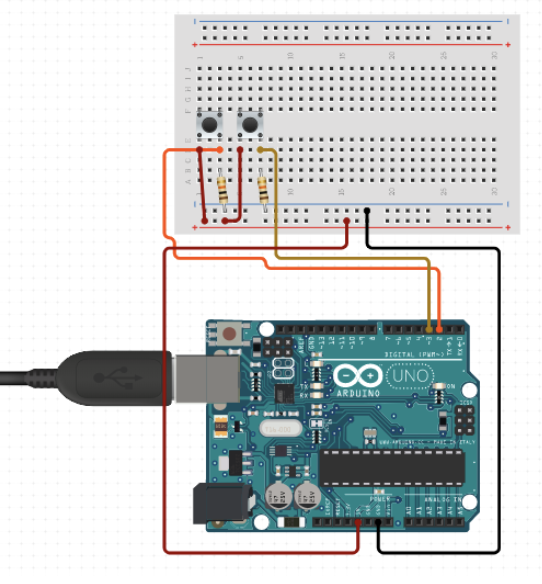
The buttons are connected to a 5v power supply (red wire), Ground (black wire), and digital inputs 2 and 3 (orange and yellow wires). When the button is pressed, the power circuit is closed and energy can flow through the corresponding digital input wire. This acts as a signal that the Arduino can pick up. Next, we capture the signal with the Arduino code in Figure 2 and convert it to a string datatype. First we indicate the digital inputs from which we take out the data: pushButton1 from the digital input 2 and pushButton2 from the digital input 3. We initialize the serial communication and set the pushbuttons as an input values in our void setup() fucntion. Then, in the void loop() function the code reads the states of the pushbuttons and saves these states in values buttonState1 and buttonState2. If the pushbutton is pressed, it is in state 1 meaning “on”. State 0 means off. The code checks the button states in an if(Buttonstate == 1) statement. If the buttonState1 == 1, the Serial Monitor prints "Margi.". If the buttonState2 == 1, the Serial Monitor prints "Konrad.". The " . " in our inputs will be explained in the processing part. To recap, this means that if the push button from the digital input 2 (yellow wire in Figure 2.1) is pressed the Serial Monitor reads “Margi”, and if the push button from digital input 3 (orange wire in Figure 2.1) is pressed it reads “Konrad”. If nothing is pressed, nothing gets printed. The void loop() function repeats itself every 800 milliseconds, so it is constantly checking if any of the button states equals 1. To see the Serial Monitor in Arduino Studio, go to Tools -> Serial Monitor.
We have successfully captured the data from our buttons. Now, we clean and store the data in a database using Processing and MySQL in the next section.
When we capture our data in Processing, we send it to a Database. For this, we need to create a MySQL database that stores information about the candidate and date for each vote. We use an Amazon Relational cloud database which is very easy to set up. Amazon provides six different database engines: Amazon Aurora, PostgreSQL, MySQL, MariaDB, Oracle Database, and SQL Server. For our project we are using MySQL for the simplicity and familiarity.
When setting up our database we first select the time zone as eu-central-1a which is located in Frankfurt. The Database instance class is db.t2.micro with an allocated storage of 20 GiB. Since our project is for school purposes the security is open to any IP address.
For our project we need to store 2 important inputs, name and date. Since our inputs from Arduino are only the names of the candidates, in Processing we also log the date when the vote was performed. In addition, we include an id for every vote which will be created every time we push something to the database. For example if we insert Value 1 and Date 1 the database will include a auto increment id so the row would be id 1, value 1 , date 1.
To build the database tables we use simple MySQL query that creates the table vote. The table should have an integer id that should not be null and should be auto incremented every time something is added. It also should have a Name column that is a varchar and cant be null and a Date column with datetime values and cannot be null. We define our primary key as the id.
### Creating Table votes
CREATE TABLE votes (
    id int NOT NULL AUTO_INCREMENT,
    Name varchar(255) NOT NULL,
    Date DATE NOT NULL,
    primary key (id)
);
After we run our code in Arduino Studio, we use Processing to access the Arduino Serial Monitor and capture the printed values as string data. Then, we pass the data to a MySQL database to store.
To be able to connect processing to Arduino we used the porcessing.serial library. This library reads and writes data to and from external devices. By defining what is the Arduino serial port we are able to communicate with the device and capture whatever input this device is pushing.
To do this we first defined a variable called myString , which is the inputs we are trying to capture from Arduino. In our void setup() function, we defined a myPort variable with the Arduino serial port,“COM25” in this case and the rate we want. In our void draw() function we created a while loop that checks if the port available is bigger than 0, read the string until “.”. We had to add a . at the end our our strings because initially we set it to read until '\n' but it was creating a line break in our database and all the lines were having issues. After this we create and if statement that says, if the string passed does not equal to null, then print our string and push the string to our MySQL database.
After we capture our Strings with processing, the next step we wanted was to push it to a MySQL database. To do this we used the Processing Bezier SQL library that we call by doing import de.bezier.data.sql.*; MySQL db;
In our void setup() function we create the connecting credentials of our database. We defined 4 strings server, user, pass and database}. In our void draw() function once we verified that the string was not equal to null, we then make a connection using our credentials from our void function, and then we created a MySQL query that Inserts the string into the table votes and add in columns Name and Date the values that MyString has and CURRENT_DATE() which will return the current date in ‘YYYY-MM-DD' format.
So any time somebody pushes the button in our Arduino device it will push the value to our database. Our MySQL vote table would look something like this Table 4.1 .
| id | Name | Date |
|---|---|---|
| 1 | Konrad. | 2019-12-01 |
| 2 | Margi. | 2019-12-01 |
| 3 | Konrad. | 2019-12-01 |
Data Studio is Google’s reporting solution for power users who want to go beyond the data and dashboards of Google Analytics. The data widgets in Data Studio are notable for their variety, customization options, live data and interactive controls (such as column sorting and table pagination). Data sources include Google products (Analytics, AdWords, Search Console, Sheets, YouTube, etc.), database connectors, file upload, and “community” connectors to popular marketing services.
To visualize our information in Data Studio, the first step we need to do is to connect our report to the data we want to use. For this we created a new Data source and use the MySQL connector.
In the MySQL connector we need to the Authentication of our database and pass the following variables: \code{Host Name or IP , Port(Optional), Database , Username and Password}. Once we connect we can select view the tables and the columns of them or we can use a custom Query to select specifically what we want.
In our case, since the names(votes) were in one column, we needed to create a custom Query that counted each of the votes but separate them into 2 different columns and group them by date. The query we used to do this was the following:
select count(*) as count,
 Date_Format(Date(Date),'%Y/%m/%d') as Date,
 sum(Name = 'Konrad.') As KB,
 sum(Name='Margi.') as Margi
 from votes
 Group by Date(Date)
The custom query would generate the following table:
| count | Date | KB | Margi |
|---|---|---|---|
| 4 | 2019/11/27 | 1 | 3 |
| 3 | 2019/11/28 | 2 | 1 |
| 2 | 2019/11/29 | 0 | 2 |
| 6 | 2019/11/30 | 1 | 5 |
| 6 | 2019/12/01 | 4 | 2 |
| 4 | 2019/12/02 | 2 | 2 |
| 6 | 2019/12/03 | 3 | 3 |
| 22 | 2019/12/04 | 13 | 9 |
Once we were able to connect our database to data studio and create a data source, we start designing our lay out of the report. For this the goal was to show how the voting happens in live time. Our report includes the following
- ScorreCard: Simple Scorecard with overal results and results by participant.
- Column Chart: Display the vote count day by day for each candidate
- Table:The columns show the date, the percentage of votes for each candidate that day, and the vote counts for each candidate.
- Time Series Chart: The time series chart shows the the breakdown of percentage of votes for each candidate day-by-day.
- Combo Chart: Includes the Percentage of the total and the votes per date separated by candidates