This project shows you how to get the electric prices for your home automation project.
Data for Europe is available from this site: https://transparency.entsoe.eu/usrm/user/myAccountSettings where you have to sign up for a security token to get access.
The documentation for the API is here: https://transparency.entsoe.eu/content/static_content/Static%20content/web%20api/Guide.html
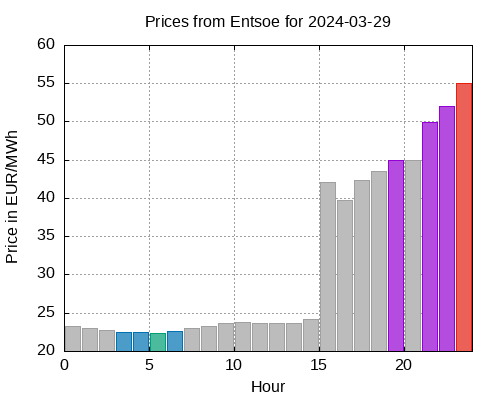
This project shows how you can let your home automation decide what to do when the electric price is high or low. And also how to plot a daily diagram as well, like this:
The data returned from the API is in XML, and to do fun stuff with it, the data is converted to a JSON data structure.
Like this, where price is an array where the elements are price at that hour. Example, array element [0] contains the price between 0:00 and 1:00, and element [23] contains the price between 23:00 and 24:00
{"date":"2024-03-29",
  "area":"Trondheim",
  "units":"EUR/MWH",
  "price":[23.31,22.95,22.68,22.49,22.45,22.37,22.66,23.04,23.3,23.65,23.82,23.62,23.61,23.66,24.19,42.15,39.73,42.35,43.59,45.03,44.95,49.94,51.99,55.01],
  "sortedHour":[23,22,21,19,20,18,17,15,16,14,10,13,9,11,12,0,8,7,1,2,6,3,4,5]}
Time is shown as hours in Norway. The parameters for the script are:
- Security token
- Date, any legal value you can feed to the "date" command
- Norwegian area, like Oslo/Bergen/Trondheim/Tromsø/Kristiansand or Finland
- Output file for plot (if omitted, no plot is generated)
Since 1 July 2022, there is now differentiated prices on power.
Daytime price 06-22, nighttime 22-06. For Tensio NT ( 21.75 øre/kWh and 10.875 øre/kWh )
The usage pattern is a crontab like this (NB, prices are updated at 14:00):
0 14 * * * cd /home/directory/ElectricPrices/src/main/sh; ./getDataFromEntsoe.sh security-token tomorrow Trondheim > result.jsonThen the JSON output can be converted to input for gnuplot
cd /home/directory/ElectricPrices/src/main/sh; ./generatePlotData.sh result.json > result.pltAnd then finally plotted with
cd /home/directory/ElectricPrices/src/main/sh; gnuplot -c ../plot/plotPrices.gp result.plt 2024-03-29 EUR MWh plot.plotThe project depends on bash scripting, gnuplot, jq and xq, they are installed with:
- sudo apt install curl
- sudo apt install gnuplot
- sudo apt install jq
- sudo pip install xq
curl -s https://www.hvakosterstrommen.no/strompris-api is also an alternative to fetch electric prices.
Get today's exchange rate, from Norges Bank curl -s "https://data.norges-bank.no/api/data/EXR/B.EUR.NOK.SP?format=sdmx-json&startPeriod=2022-11-27&endPeriod=2022-11-27&locale=no" | jq '.data.dataSets[0].series' | sed "s/0:0:0:0/testing/" | jq .testing.observations | sed 's/"0"/"test"/g' | jq -r .test[0]