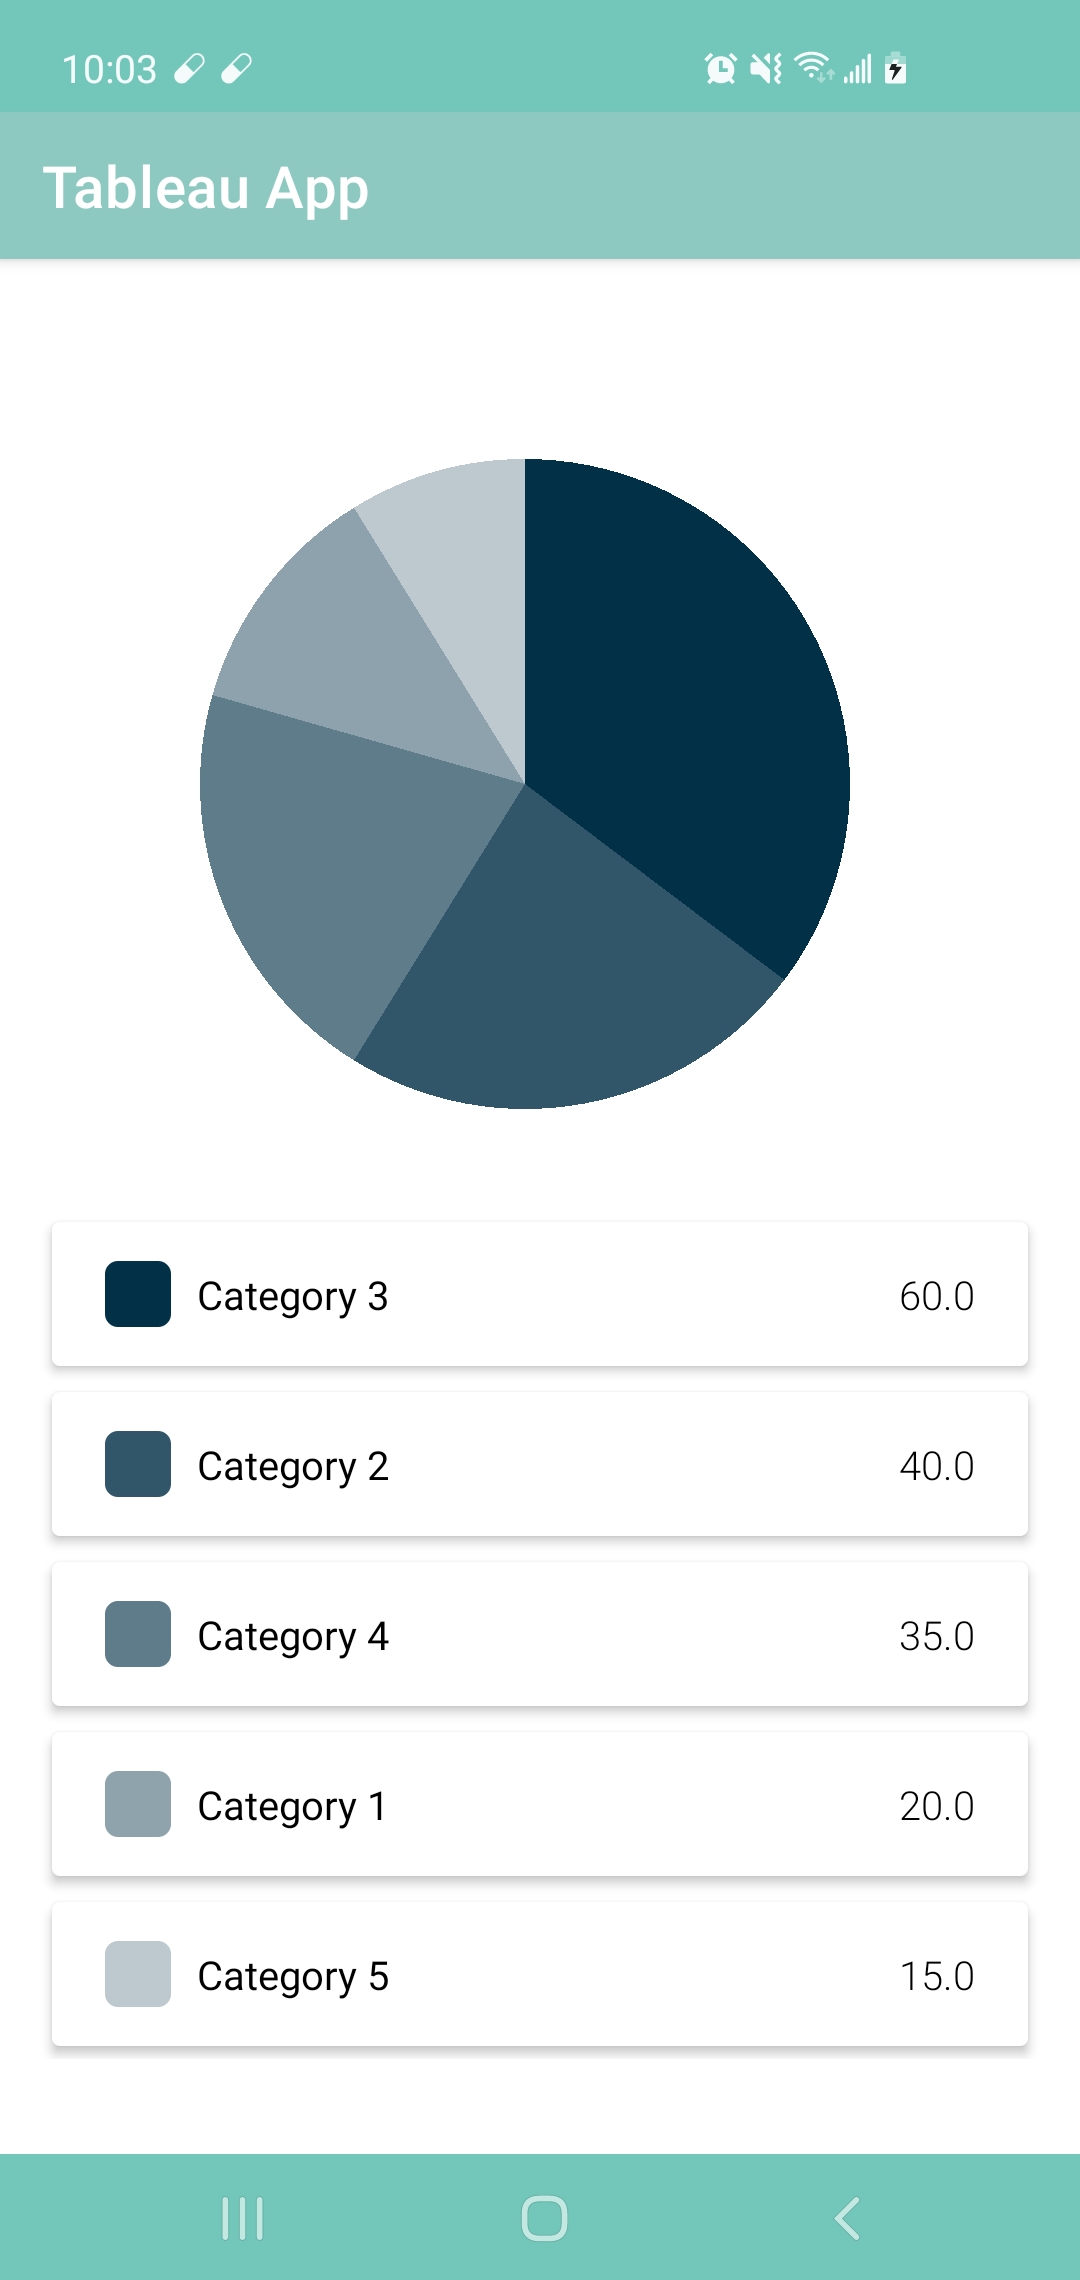
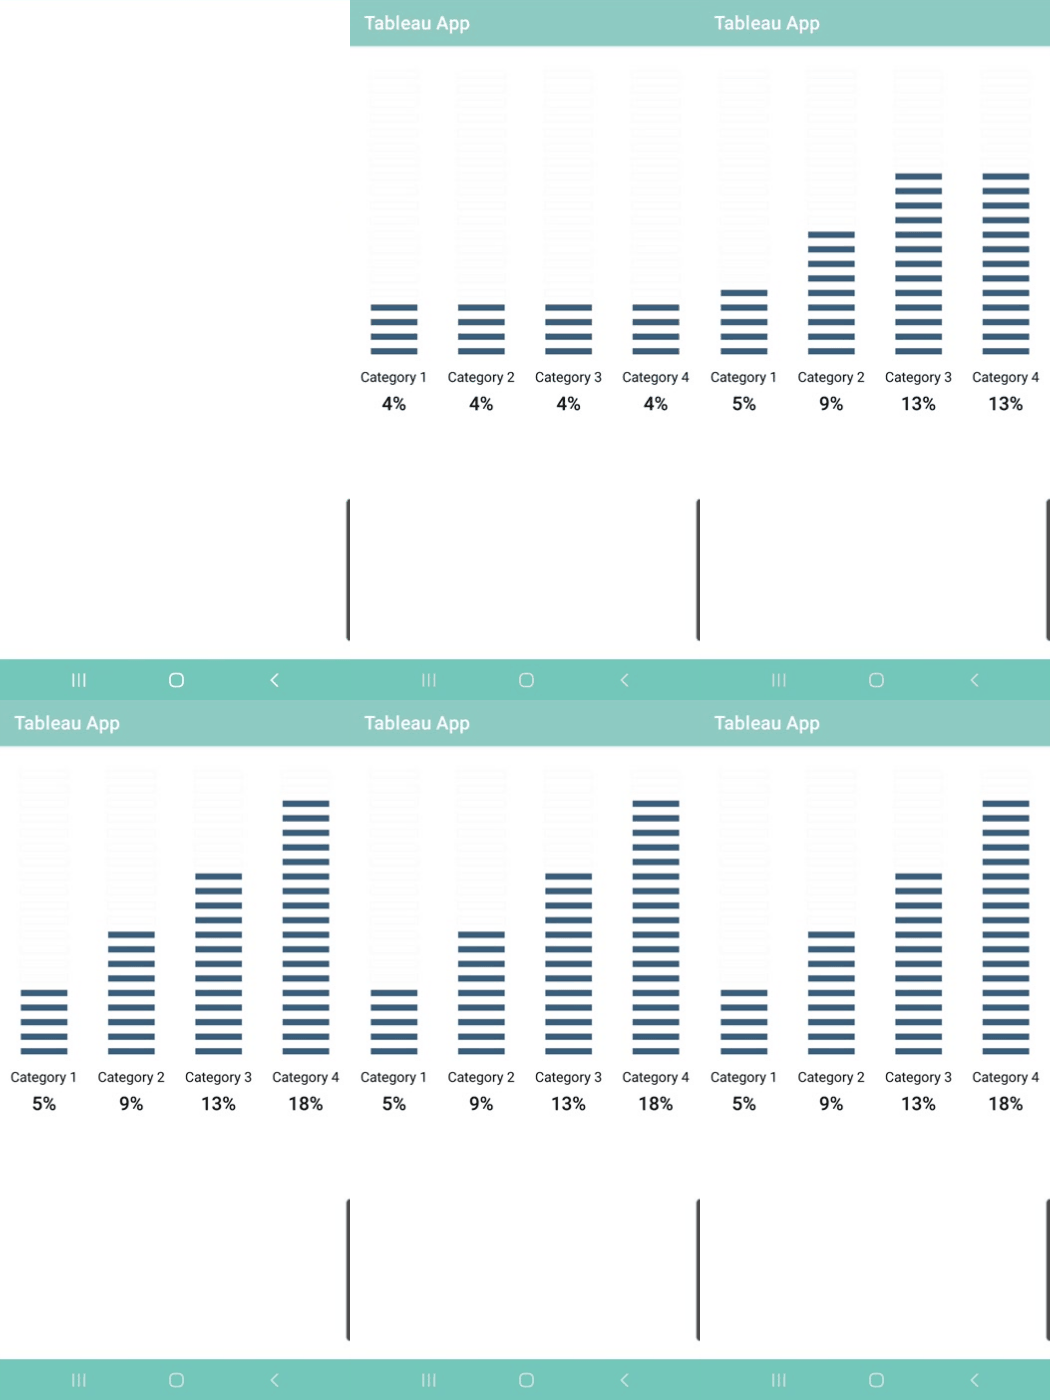
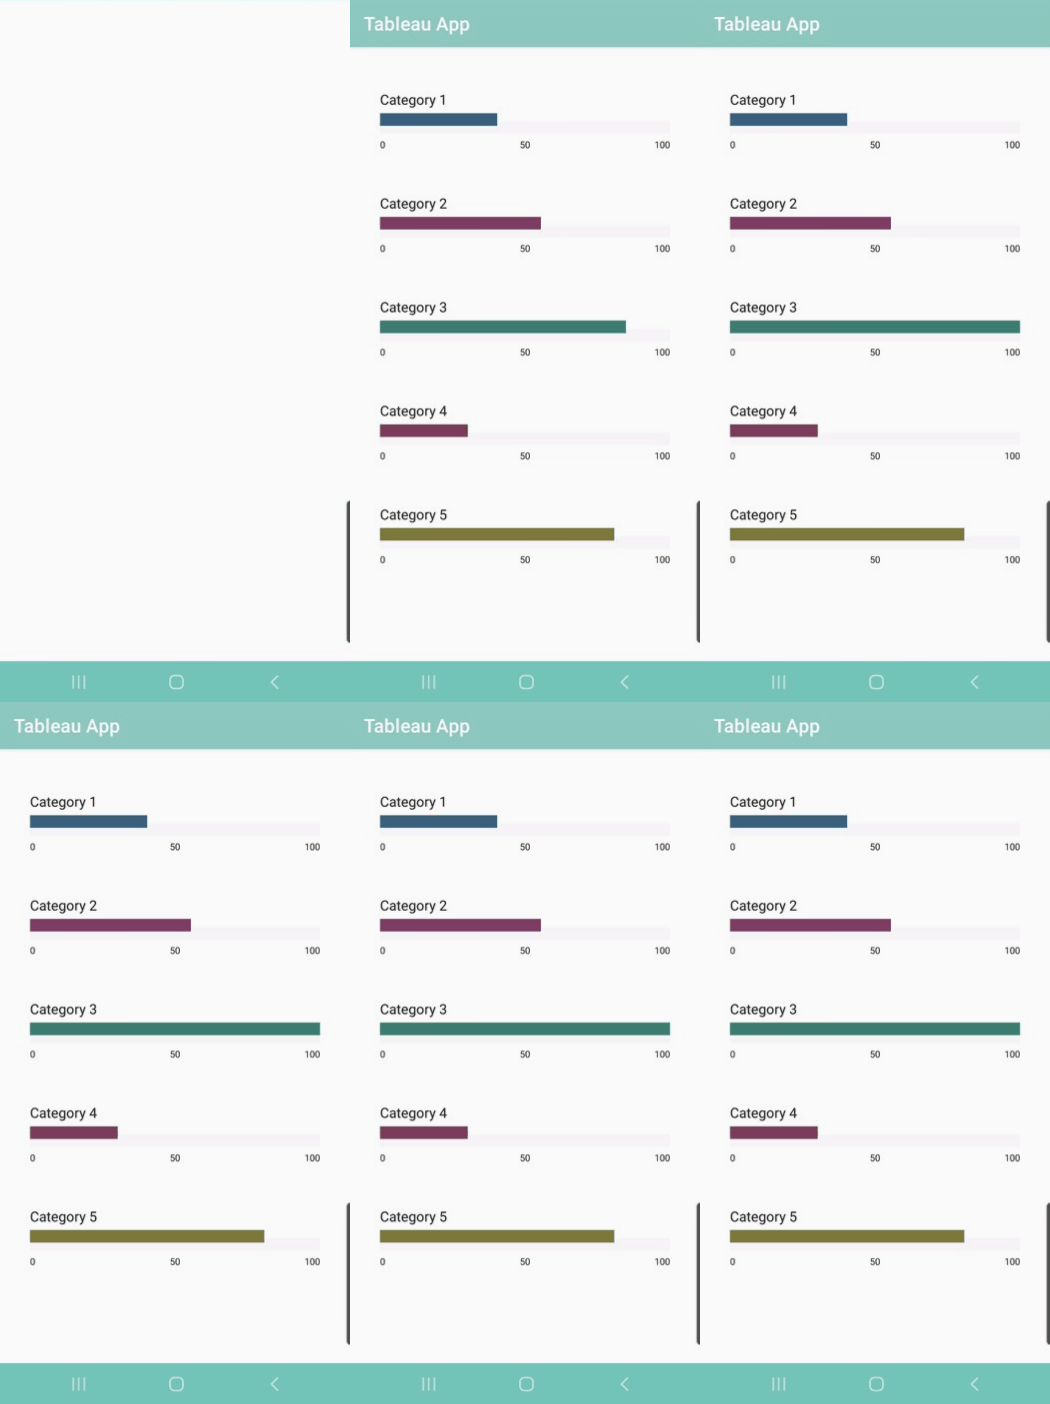
Android Tableau library supports variety of graphs which developers simply integrate visualization reports on Android application.
Android Tableau library updates regularly. Your valueable sponsorship helps me contributing more features and maintaining the library. Support me for building more interesting projects! 💜
Updated on May 19th 2021
- NEW: PieGraphView, DotProgressView, and LinearProgressView are released! ✨
Updated on May 20th 2021
- Improve codes from v1.0-rc-1
1. Setup your Android project setting
Minimum SDK Version: 21 or greater (Update in your app level build.gradle)
Supported Programming Language: Kotlin
Add following snippet code in your project level build.gradle.
android {
    compileOptions {
        sourceCompatibility JavaVersion.VERSION_1_8
        targetCompatibility JavaVersion.VERSION_1_8
    }
}
2. Add required library
First, include following jitpack url inside maven block in your project level build.gradle.
allprojects {
    repositories {
        ...
        maven { url 'https://jitpack.io' }
    }
}
Next, add the TableauViews and required libraries in app level build.gradle and sync the gradle file.
implementation 'com.github.sung2063:AndroidTableauLibrary:1.0-rc-2'
implementation 'com.google.android.material:material:1.3.0'
Now you are ready to use Tableau Library. You can start creating graph and progress views.
First, create a PieGraphView in your xml file.
<com.sung2063.tableau_library.graph.PieGraphView
        android:id="@+id/pie_graph_view"
        android:layout_width="match_parent"
        android:layout_height="match_parent" />
Next, in your onCreate() method in Activity, create an arrrylist that holds PieGraphModel objects, pass list to new PieGraphHandler object, and set this to pieGraphView handler.
val pieGraphView: PieGraphView = findViewById(R.id.pie_graph_view)

// Create ArrayList<PieGraphModel> object...

val handler = PieGraphHandler(dataList)
pieGraphView.setHandler(handler)
Your pie graph with list of data is displayed on your app! 👏
First, create a DotProgressView in your xml file.
<com.sung2063.tableau_library.progress.DotProgressView
        android:id="@+id/dot_progress_view"
        android:layout_width="match_parent"
        android:layout_height="match_parent" />
Next, in your onCreate() method in Activity, create an mutableList that holds DotProgressModel objects, pass list to new DotProgressHandler object, and set this to dotProgressView handler.
val dotProgressView: DotProgressView = findViewById(R.id.dot_progress_view)

// Create MutableList<DotProgressModel> object...

val handler = DotProgressHandler(dataList)
dotProgressView.setHandler(handler)
Your dot progress graph with list of data is displayed on your app! 👏
First, create a LinearProgressView in your xml file.
<com.sung2063.tableau_library.progress.LinearProgressView
        android:id="@+id/linear_progress_view"
        android:layout_width="match_parent"
        android:layout_height="match_parent" />
Next, in your onCreate() method in Activity, create an mutableList that holds LinearProgressModel objects, pass list to new LinearProgressHandler object, and set this to linearProgressView handler.
val linearProgressView: LinearProgressView = findViewById(R.id.linear_progress_view)

// Create MutableList<LinearProgressModel> object...

val handler = LinearProgressHandler(dataList)
linearProgressView.setHandler(handler)
Your linear progress graph with list of data is displayed on your app! 👏
Here are available attributions you can use to customize your tableau views.
| Attribution | Value | Description |
|---|---|---|
| useArcColor | boolean | Use each object's arc color if the value true, otherwise use default color. |
| graphColor | string | User choose default graph color. This applies only when useArcColor attribution is false. |
| Attribution | Value | Description |
|---|---|---|
| useCommonColor | boolean | Use all progress same color if the value true, otherwise use own progress color which set on each objects. |
| filledColor | string | Hex color code for progress. This applies only when useCommonColor attribution is true. |
| unfilledColor | string | Hex color code for scale line. |
| maxValue | integer | The maximum value for progress. |
Developer: Sung Hyun Back (@sung2063)
Designer: Da Eun Park
The code is licensed under the MIT License.


