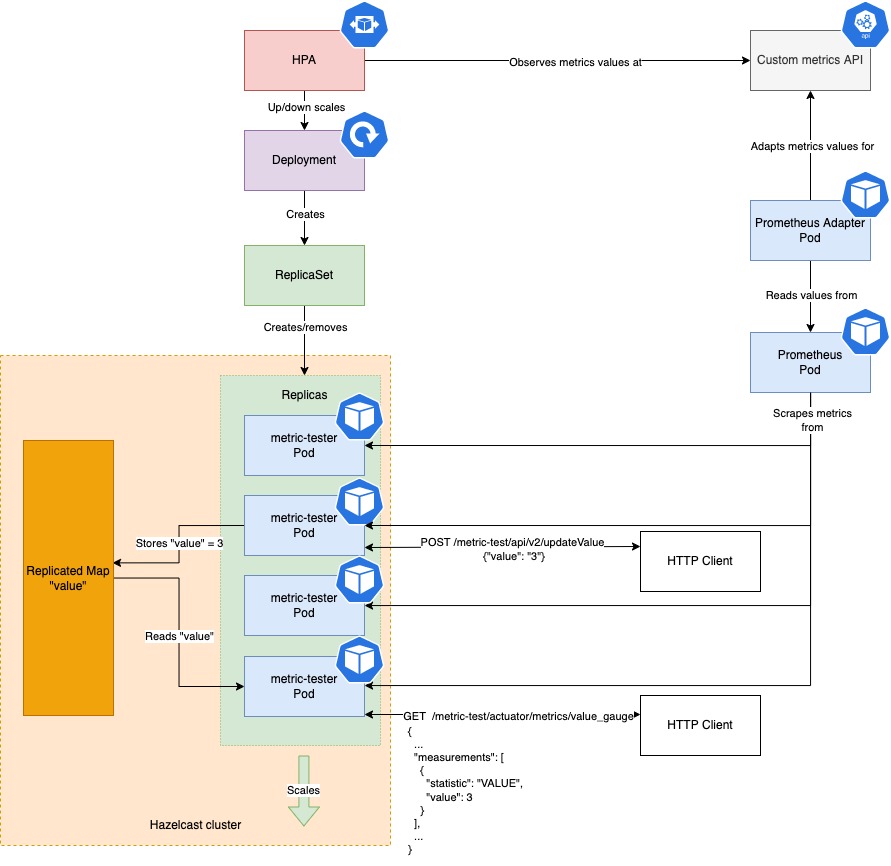
A test-bed application that lets you update a custom metric to test your horizontal scaling logic on top of Kubernetes
In the resources we have a application.properties file were we configure context route, logs and port for the app and management settings for Prometheus.
This particular line can be customized to include what will appear in the monitoring page of Prometheus:
management.endpoints.web.exposure.include=*
This line, instead, is used to set of the initial value of the variable that control the scaling system:
meter.initial.value=0
In the config directory we create two classes: MicrometerConf and SwaggerConf. In the first one we add configuration to customize the logs and graph we will be receiving in Prometheus different monitoring views and the second class is to configure our Swagger page for the application.
Go to your localhost:
http://localhost:8102/metric-test/actuator/prometheus
You should see various paramenters monitored by Prometheus.
http://localhost:8102/metric-test/actuator/metrics
or to see a specific metric just add after metrics the specific metric name, for example:
http://localhost:8102/metric-test/actuator/metrics/value_gauge
http://localhost:8102/metric-test/swagger-ui/
$ curl -vvv \
    -X POST \
    -H "Content-Type: application/json" \
    --data '{"value":"5"}' \
    localhost:8102/metric-test/api/v2/updateValue