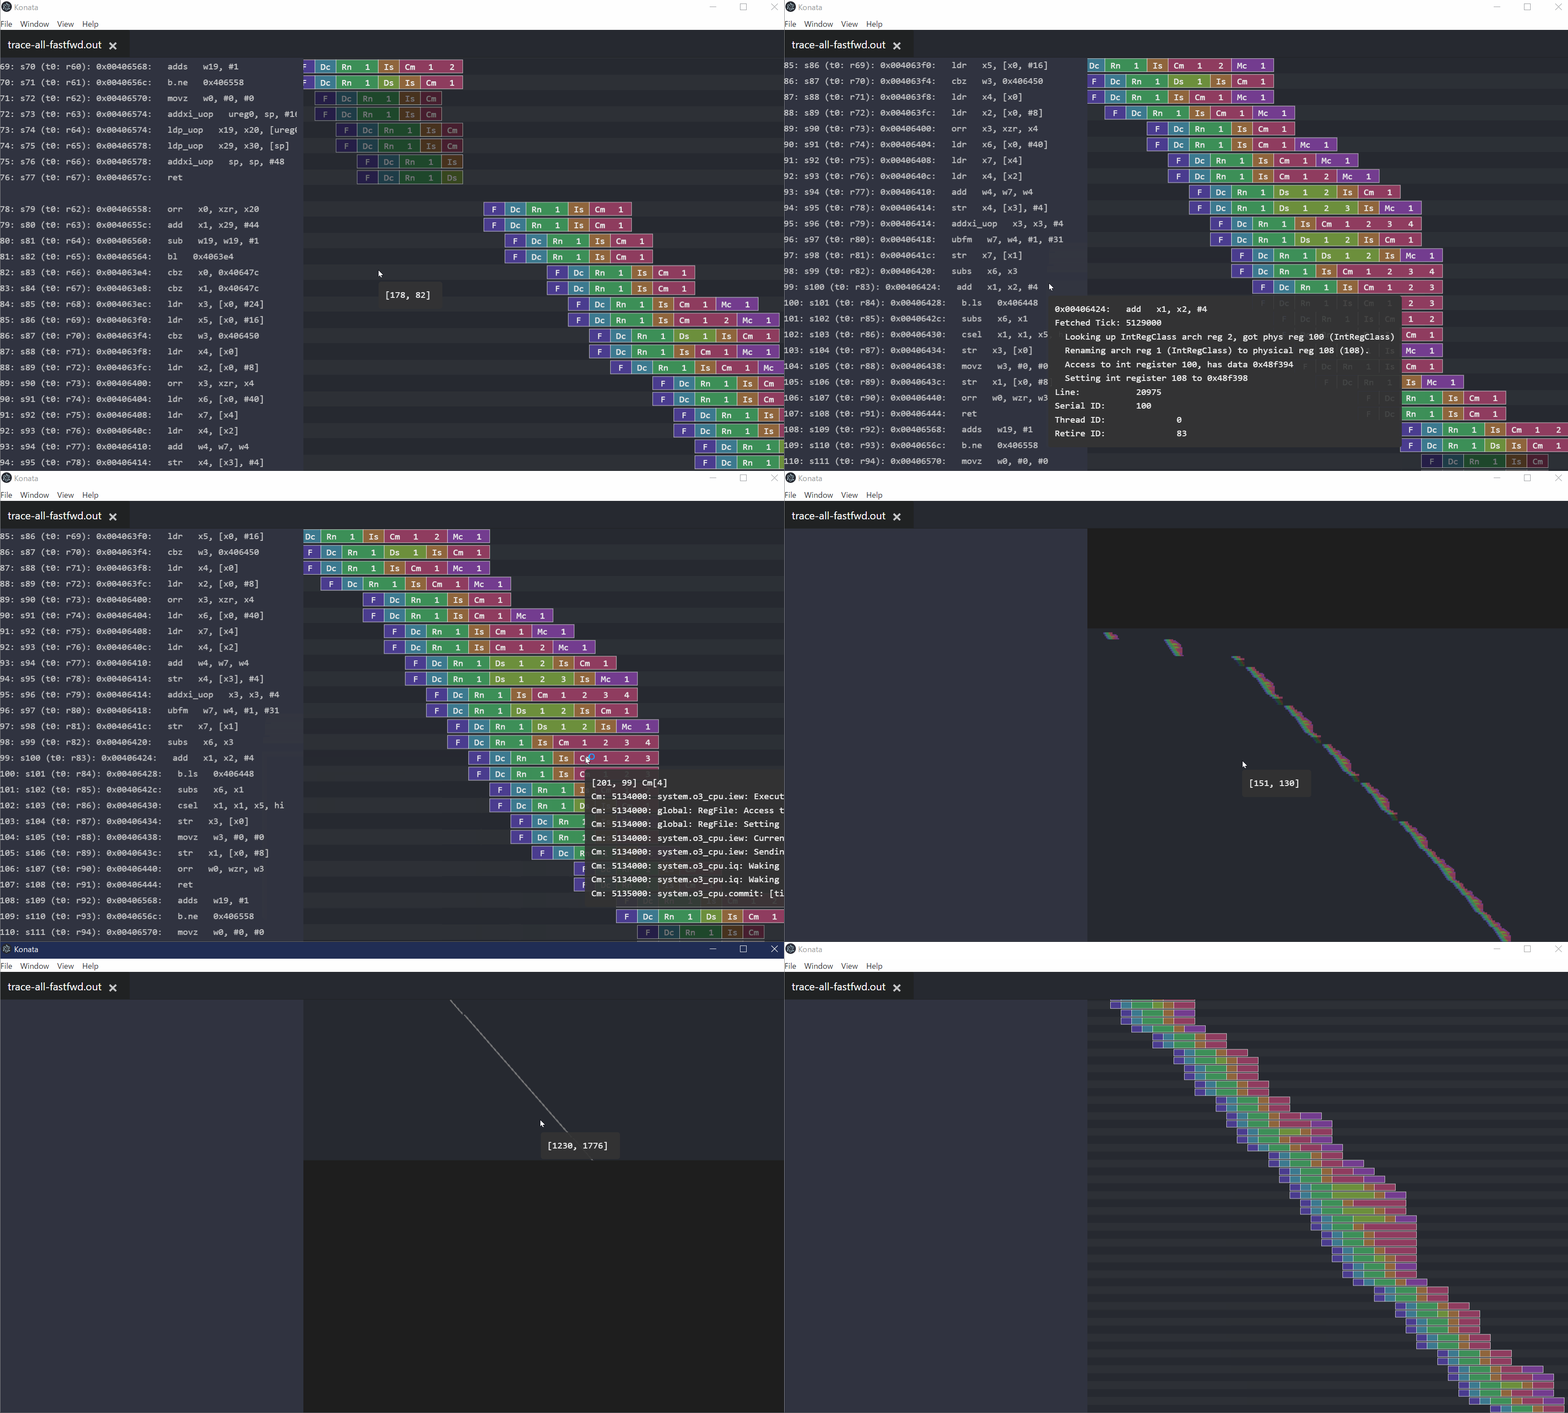
- Konata is an instruction pipeline visualizer for Onikiri2-Kanata/Gem5-O3PipeView formats.
- ASPLOS 2018 learning gem5 tutorial presentation is here
- The Onikiri2-Kanata format is described in here. It can represent a more detailed pipeline behavior than Gem5-O3PipeView.
There are two ways to launch Konata. If you fail to launch a pre-built binary, please try the second way.
- Extract an archive and launch an executable file (konata.exe or konata).
- Pre-built binaries are available from here.
- Launch from this repository.
- Install node.js from https://nodejs.org
- Clone this repository.
- Launch install.bat (Windows) or install.sh (Linux/MacOS).
- Launch Konata from konata.vbs (Windows) or konata.sh (Linux/MacOS).
- Generate a trace log from gem5 with the O3 CPU model
- Execute gem5 with the following flags
- This example is from http://www.m5sim.org/Visualization
$ ./build/ARM/gem5.opt \ --debug-flags=O3PipeView \ --debug-start=<first tick of interest> \ --debug-file=trace.out \ configs/example/se.py \ --cpu-type=detailed \ --caches -c <path to binary> \ -m <last cycle of interest> - Load a generated "trace.out" to Konata
- from a menu in a window or using drag&drop
- If you use
O3CPUAllas well asO3PipeViewas follows, Konata shows more detailed CPU log and visualizes dependency between instructions.--debug-flags=O3PipeView,O3CPUAll
- mouse wheel up, key up: scroll up
- mouse wheel down, key down: scroll down
- ctrl + mouse wheel up, key "+", ctrl+key up: zoom in
- ctrl + mouse wheel down, key "-", ctrl+key down: zoom out
- ctrl + f, F3, shift+F3: find a string
- F1, ctrl+shift+p: open a command palette
- If you miss pipelines in a right pane, you can move to pipelines by click "Adjust position" in a right-click menu.
- You can visually compare two traces as follows:
- Load two trace files
- Right-click and select "Synchronized school" & "Transparent mode"
- Right-click and select a color scheme
- Move to another tab and adjust a position with the transparent mode
- If you cannot launch Konata, try to install the following runtimes (or try to install the latest Google Chrome, because it uses the same runtimes).
sudo apt install \ libgconf2-4 libgtk-3-0 \ libxss1 \ libgconf2-4 \ libnss3 \ libasound2 \ libX11-xcb1 \ libcanberra-gtk3-module - In
O3CPUAllmode, Konata associates each line in trace.out with each instruction by tracking[sn:<serial number>]. If you output custom log with the above serial information, Konata shows your custom log.
- Install dependent runtimes as follows or use Dockerfile included in a source tree
# Install node.js/npm
sudo apt install nodejs

# Install electron/electron-packager
# Since electron is huge, they are installed globally.
npm -g install electron
npm -g install electron-packager

# Run and build
make init   # Setup libraries
make        # Run Konata
make pack   # Build & pack Konata for Windows/Linux/Mac
Copyright (C) 2016-2022 Ryota Shioya shioya@ci.i.u-tokyo.ac.jp
This application is released under the 3-Clause BSD License, see LICENSE.md. This application bundles ELECTRON and many third-party packages in accordance with the licenses presented in THIRD-PARTY-LICENSES.md.
