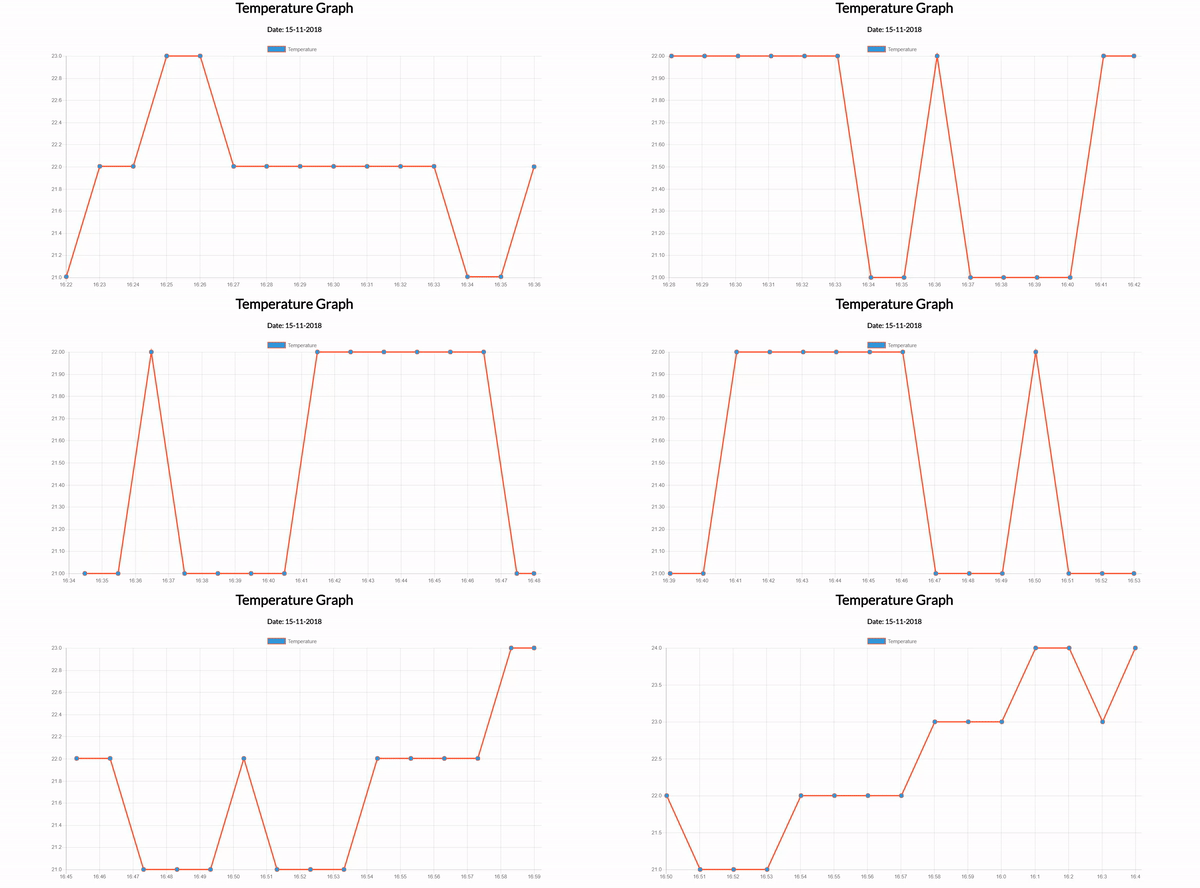
Real-time Temperature Graph using Node.js, Socket.io, Chart.js, Arduino UNO and LM-35 Temperature sensor.
Install Arduino IDE. Open temperature.ino file in IDE, connect Arduino board to your PC. In Arduino IDE -> Tools -> Port, see the port name and update it in index.js, Now compile and upload the ino code into Arduino and start Express Server.
To install dependencies:
npm install
To run:
node index
Go to http://localhost:4000 to see the graph. Or you can open index.html to see the graph. To publically host index.html, host it on any static hosting service.
Feel free to fork!
