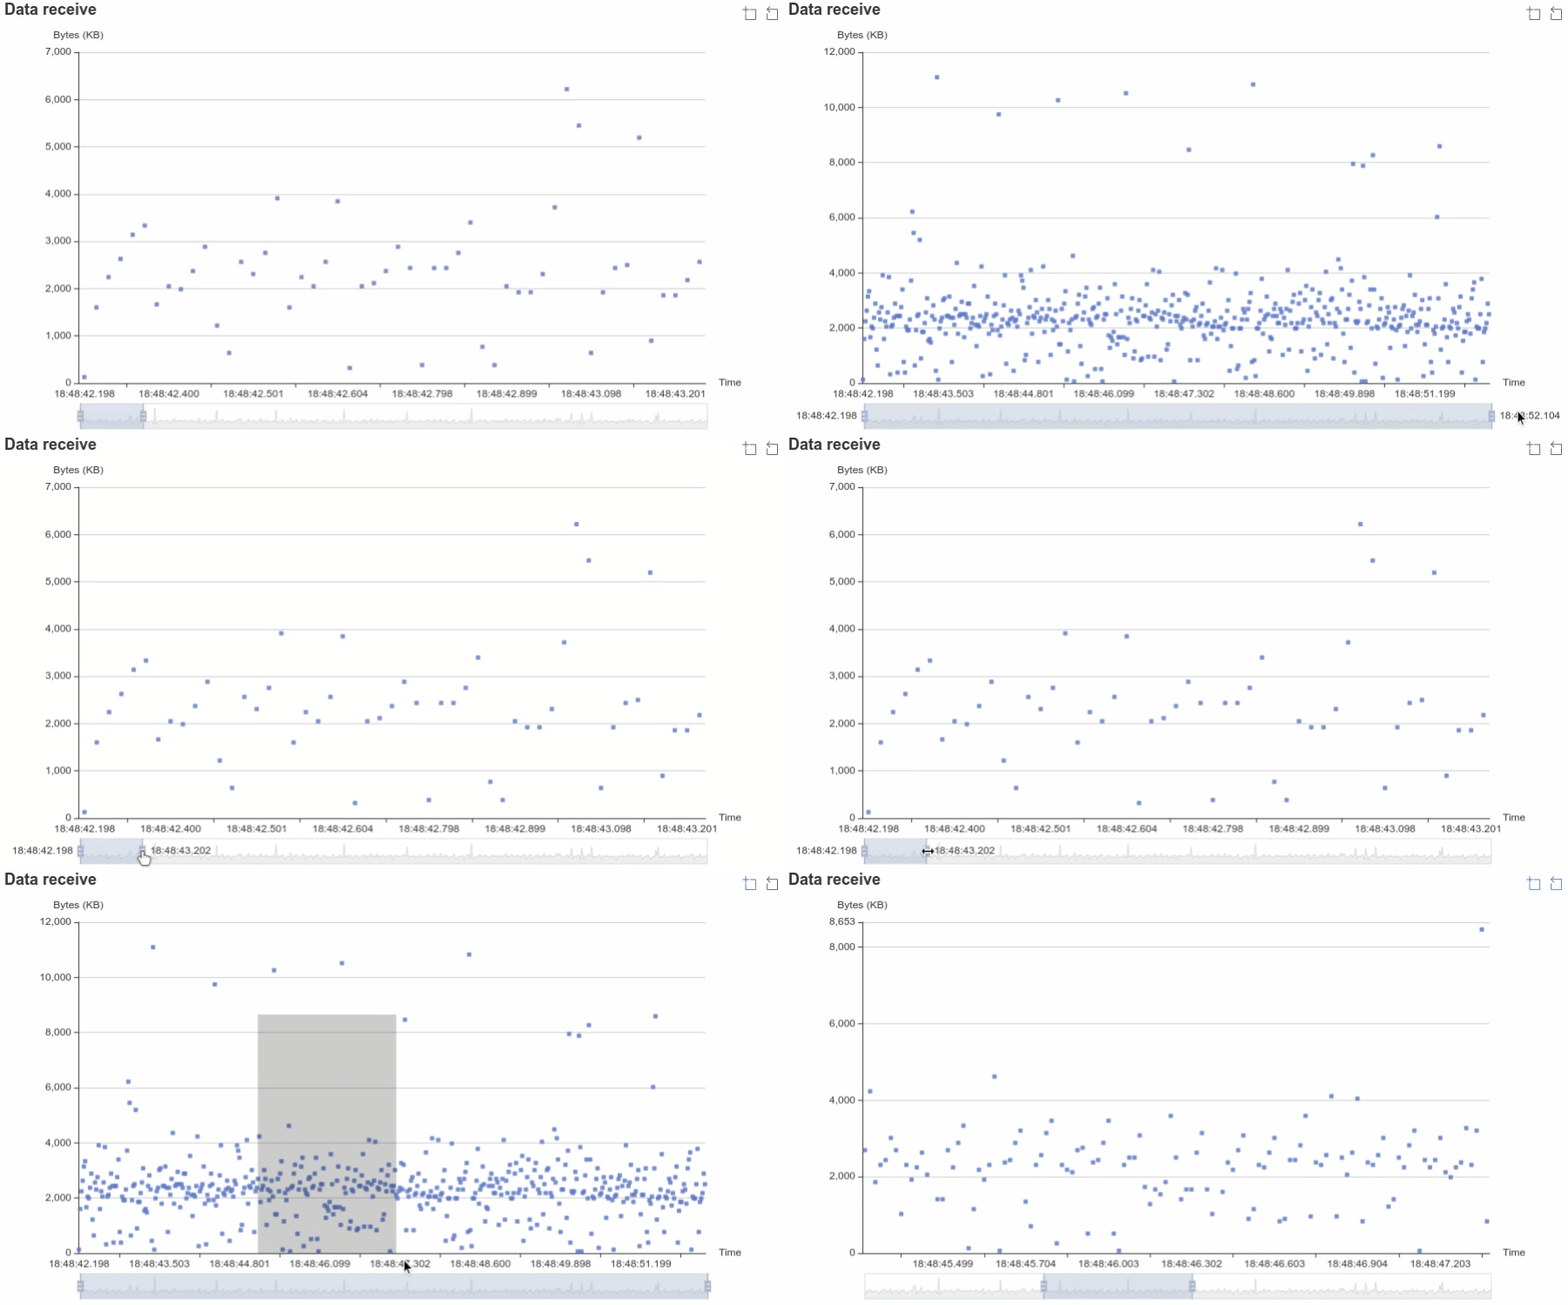
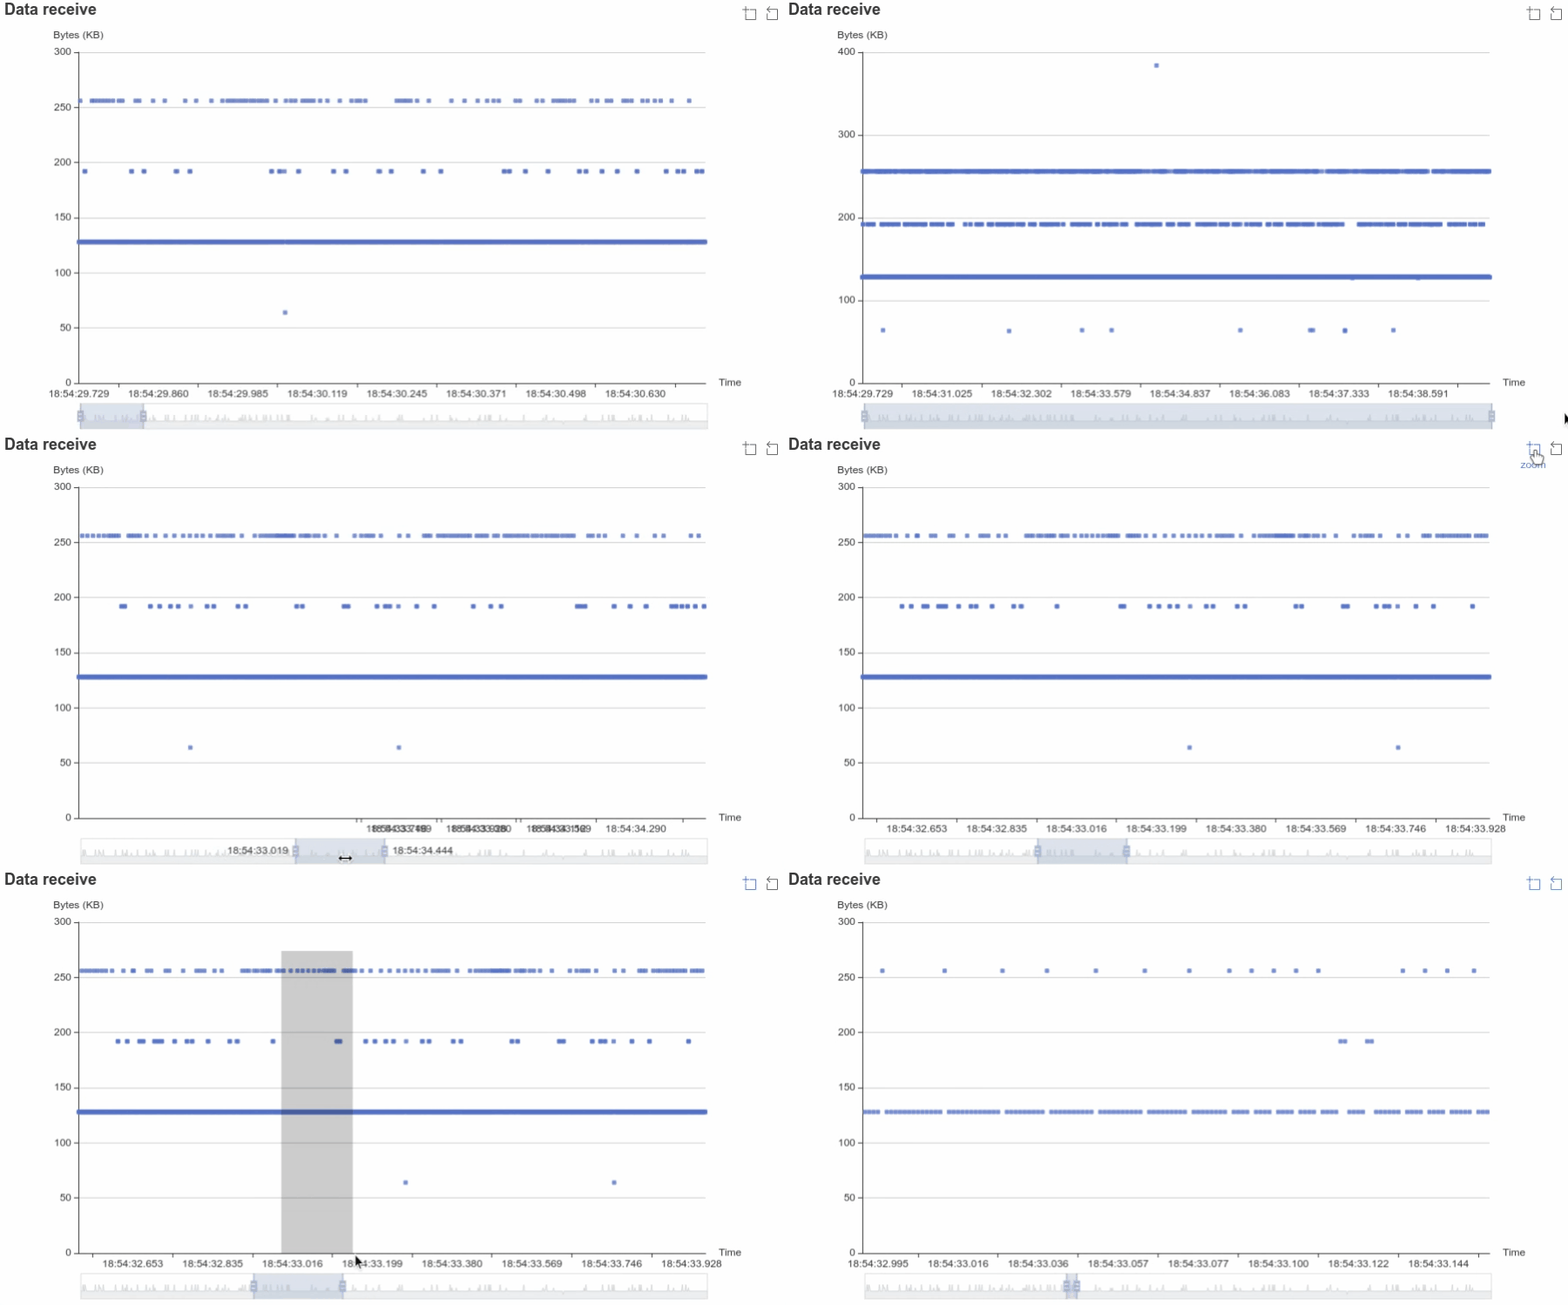
A utility to measure/track network microbursts.
Microbursts can trigger various kinds of issues, especially in cloud environments like in AWS where a given guranteed baseline bandwidth per second may not be allowed to be bursty (like can't send all data in few milliseconds, it will have to be sent by spreading over entire 1000ms etc)
This utility measures the microbursts efficiently using eBPF (i.e., no packet captures) using given aggregation window and displays them either realtime in TUI graph and/or HTML graphs for offline analysis:
How this works:
- Traces network receives/transmits using eBPF and stores the count in per cpu array
- Using a periodic timer (either perf timer or userspace timer, configurable), calcuates the rates
- A userspace component to receive and display live graph
Console output with chart:
$ sudo ./network-microburst --burst-window 1ms
Transitioning from no traffic to smooth traffic to bursy traffic:

Console output with chart disabled:
$ sudo ./network-microburst --burst-window 1ms --show-graph=false
...
19:21:29.470: rx: 13 MB      tx: 13 MB
19:21:29.471: rx: 12 MB      tx: 12 MB
19:21:29.472: rx: 12 MB      tx: 12 MB
19:21:29.473: rx: 12 MB      tx: 12 MB
19:21:29.475: rx: 12 MB      tx: 12 MB
19:21:29.476: rx: 11 MB      tx: 11 MB
19:21:29.477: rx: 13 MB      tx: 13 MB
19:21:29.478: rx: 12 MB      tx: 12 MB
19:21:29.479: rx: 12 MB      tx: 12 MB
19:21:29.480: rx: 2.4 MB     tx: 2.4 MB
19:21:30.464: rx: 394 kB     tx: 394 kB
19:21:30.465: rx: 2.1 MB     tx: 2.1 MB
19:21:30.466: rx: 2.5 MB     tx: 2.5 MB
19:21:30.468: rx: 2.6 MB     tx: 2.6 MB
19:21:30.469: rx: 3.2 MB     tx: 3.2 MB
19:21:30.470: rx: 9.9 MB     tx: 9.9 MB
19:21:30.471: rx: 12 MB      tx: 12 MB
19:21:30.472: rx: 13 MB      tx: 13 MB
19:21:30.473: rx: 14 MB      tx: 14 MB
19:21:30.475: rx: 13 MB      tx: 13 MB
19:21:30.476: rx: 13 MB      tx: 12 MB
19:21:30.477: rx: 13 MB      tx: 13 MB
19:21:30.478: rx: 13 MB      tx: 13 MB
19:21:30.479: rx: 12 MB      tx: 13 MB
...
Charts for offline analysis:
sudo ./network-microburst --burst-window 1ms --save-graph-html test.html
You can download from the Release
Alternatively, to compile from source, there are two options:
-
Building on the host.
- Install prerequisites:
clang,gcc,go - Build
make
- Install prerequisites:
-
Building using docker (no dependencies required on the host, other than docker)
make releaseThis will produce two static binaries under
releasedirectory:network-microburst-arm64andnetwork-microburst-x86_64
We use timer to caluate the rate, so granularity of the burst window and accuracy of the rate entirely depends on the timer accuracy. There are two timers available to use:
-
Perf timer (default)
This uses PERF_COUNT_SW_CPU_CLOCK. This allows the burst window to be as low as 10µs. Generally has better accuracy as well.
This timer can be enabled (this is the default though) by using
network-microburst --timer=perf ...option. -
Go timer
This uses Go's time.Sleep(), so accuracy of this is as good as the timer being provided by Go runtime.
This timer can be enabled by using
network-microburst --timer=go ...option. This likely needs to be run with chrt to be reliable, example:chrt --rr 99 network-microburst --timer=go ..
To improve the timer reliability (especially when granularity is very low, like 10us etc), it is recommended to provide dedicated cpus:
-
Isolate certain CPUs for timer/work
We can isolate certain CPUs (by using
isolcpuskernel boot parameter, for exampleisolcpus=6-11to isolate cpus 6 to 11) and then ask this tool to use that cpu for the work (see next point). Verify that the cpus isolated by checking kernel commandline/proc/cmdlineand/sys/devices/system/cpu/isolated.Note that you can use
lstopotool to find the cpu core(s) to isolate. Remember to isolate entire core(s), including the hyperthreads in it. -
Configure this to tool use the reserved CPUs
Depending on the timer being used, the options vary.
perftimer:sudo network-microburst --timer=perf --perf-cpu=8 ...runs the perf timer on cpu 8gotimer:sudo taskset -c 6-11 chrt --rr 99 network-microburst --timer=go ...runs the tool on cpu cores 6-11 (assuming they are isolated) with high priority
Checking for timer accuracy:
Run with --show-graph=false flag, it will track timer accuracy metrics and display at the end:
Example run with perf timer:
# Even though we ask for 1us, perf timer granularity seems to be 10us

$ sudo chrt --rr 99 ./network-microburst --burst-window 1us --show-graph=false --timer=perf
...
...

Timer accuracy:
Mean: 10µs StdDev: 195ns Min: 1.906µs Max: 20.161µs
Histogram:
        1.906µs [         1]    |
        2.818µs [         4]    |
         3.73µs [         2]    |
        4.642µs [         4]    |
        5.554µs [        32]    |
        6.466µs [        31]    |
        7.378µs [        39]    |
         8.29µs [       178]    |
        9.202µs [      8266]    |
       10.114µs [    838038]    |■■■■■■■■■■■■■■■■■■■■■■■■■■■■■■■■■■■■■■■■
       11.026µs [     34504]    |■■
       11.938µs [       594]    |
        12.85µs [       122]    |
       13.762µs [        13]    |
       14.674µs [        88]    |
       15.586µs [         6]    |
       16.498µs [         2]    |
        17.41µs [         5]    |
       18.322µs [         1]    |
       20.161µs [         3]    |
Example run with go timer:
$ sudo chrt --rr 99 ./network-microburst --burst-window 1us --show-graph=false --timer=go
...
...

Timer accuracy:
Mean: 23.863µs StdDev: 127.556µs Min: 2.871µs Max: 1.130983ms
Histogram:
        2.871µs [         1]    |
       59.276µs [    300378]    |■■■■■■■■■■■■■■■■■■■■■■■■■■■■■■■■■■■■■■■■
      115.681µs [        57]    |
      172.086µs [        26]    |
      228.491µs [        37]    |
      284.896µs [        38]    |
      341.301µs [        28]    |
      397.706µs [        34]    |
      454.111µs [        40]    |
      510.516µs [        43]    |
      566.921µs [        46]    |
      623.326µs [        54]    |
      679.731µs [        59]    |
      736.136µs [        54]    |
      792.541µs [        87]    |
      848.946µs [       103]    |
      905.351µs [       217]    |
      961.756µs [       569]    |
     1.018161ms [      2394]    |
     1.074566ms [      1645]    |
     1.130983ms [        81]    |
NOTE: To simulate network microbursts, we can use iperf3:
On the server side:
iperf3 -sOn client side (which can be in same machine for trying out this tool)
To trigger microburst (this sends 1GB on each second starting):
iperf3 -c 127.0.0.1 -b 1G --pacing-timer 1000000 -t 10To smoothly send traffic (this sends 1GB, splits and sends data every 100us):
iperf3 -c 127.0.0.1 -b 1G --pacing-timer 100 -t 10
To track network transfers (tx/rx) at 1ms interval and show the graph:
sudo ./network-microburst --burst-window 1ms
To track network transfers (tx/rx) at 1ms interval and but just print them on the stdout:
sudo ./network-microburst --burst-window 1ms --show-graph=false
To track network transfers at 1ms interval, but only include measurements above 5000 bytes:
sudo ./network-microburst --burst-window 1ms \
   --rx-threshold 5000 --tx-threshold 5000
To track network transfers at 1ms interval, with 5000 bytes threshold, generate/save chart to disk:
sudo ./network-microburst --burst-window 1ms \
   --rx-threshold 5000 --tx-threshold 5000 \
   --save-graph-html /tmp/graph.html
To track network transfers at 1ms interval, but only certain interfaces:
sudo ./network-microburst --burst-window 1ms \
   -filter-interface eth0
To track only network rx:
sudo ./network-microburst --burst-window 1ms \
   --track-tx=false
To print a histogram at the end:
sudo ./network-microburst --burst-window 1ms \
   --print-histogram

