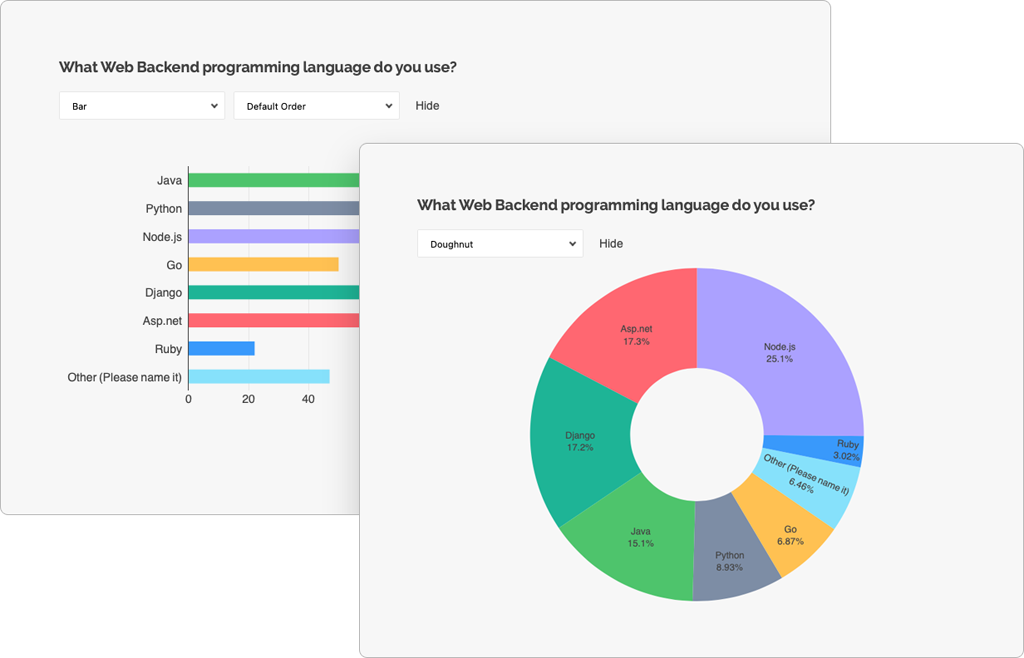
dashboard.mp4
The SurveyJS Dashboard library lets you build survey data dashboards and simplify survey data analysis with interactive and customizable charts and tables. Visualize your insights and analyze survey results in one view.
- Supported chart and graph types:
- Bar chart
- Donut graph
- Pie chart
- Gauge chart
- Bullet graph
- Word cloud
- Interactive value filtering ordering
- Customizable colors
- Dynamic layout
- Drag-and-drop chart reordering
-
Clone the repo
git clone https://github.com/surveyjs/survey-analytics.git cd survey-analytics -
Install dependencies
Make sure that you have Node.js v6.0.0 or later and npm v2.7.0 or later installed.npm install -
Build the library
npm run build:prodYou can find the built scripts and style sheets in the
packagesfolder. -
Run test examples
npm startThis command runs a local HTTP server at http://localhost:8080/.
-
Run unit tests
npm test
SurveyJS Dashboard is not available for free commercial usage. If you want to integrate it into your application, you must purchase a commercial license(s) for software developer(s) who will be working with the SurveyJS product's APIs and implementing their integration.


