The Zaptec logic is documented here.
For real. Install Appdaemon and take the time to understand it. A fully working Py environment is so much better to work with than Yaml templating. In all aspects.
https://appdaemon.readthedocs.io/en/latest/index.html
https://github.com/jjwbruijn/OpenEPaperLink
https://github.com/jjwbruijn/OpenEPaperLink/wiki
German river data:
These examples don't need the Epaper integration to be installed, they are pushing images directly to the Epaper access point.
-
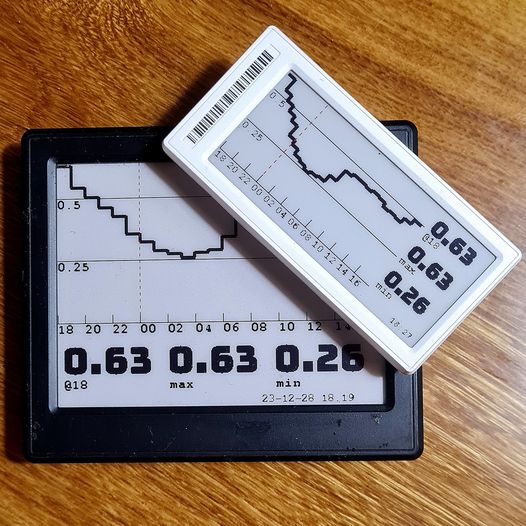
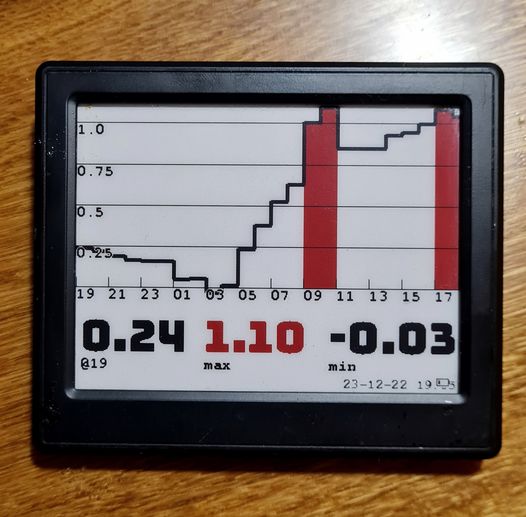
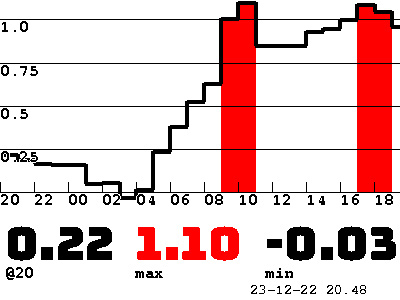
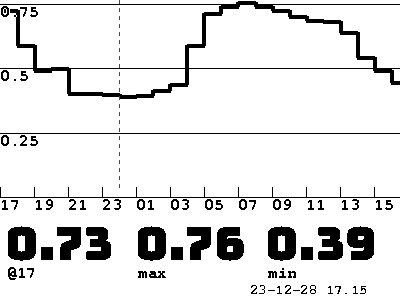
epaper_big_display.py, renders an image from sensor data to a 400x300 ink display
-
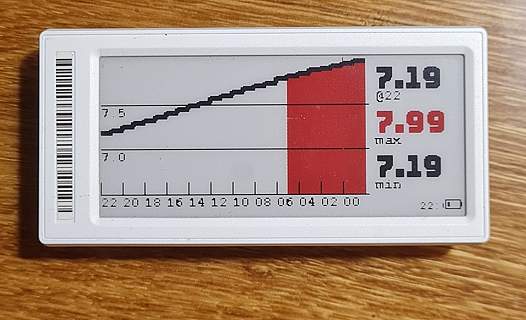
epaper_small_display.py, renders an image from sensor data to a 296x128 ink display
-
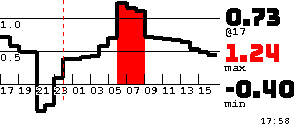
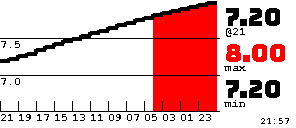
epaper_small_display_wsv_wasser.py, renders HISTORICAL DATA with a WSV Rest API call to a 296x128 display. It also optionally creates a sensor that can be used for normal operations inside HA
German river water levels
You need to have the Nordpool integration installed.
Your AppDaemon instance needs following extra dependencies:
Pillowrequestsdatetime
You need the config in the apps.yaml file and the two TTF font files. They should all be placed in the apps folder of your Appdaemon setup. Change the config in the head of the classes to match your AP and display MAC.
In the top of the class you want to use, you need to adjust these settings to match your own setup:
AP_IP = '192.168.3.130'
MAC = '000002B3353A3413'
SENSOR = 'sensor.nordpool_kwh_se3_sek_3_10_025'
If you want to manually trigger a re-render, it is easily made with a script in HA that can be executed in the Developer tools Events sections. Add this to scripts.yaml:
alias: Generate small chart to epaper display
sequence:
  - event: EPAPER_GENERATE_CHART_SMALL

alias: Generate large chart to epaper display
sequence:
  - event: EPAPER_GENERATE_CHART_LARGE
Reload the scripts and then the events can be fired in the Events section.
Please note that the epaper AP is not fast and don't like parallel posts! Make sure to run updates in sequence and not in parallel to avoid corrupt images.
The two classes initialize an hourly update but with a small difference in scheduled time to not interfere with each other. With this small time difference the AP has time to load the images in a safe manner.
Nordpool displays fetch data from the Nordpool Integration and your specified Nordpool sensor. Data presented is future prices. The data presented is stored in an attribute of the sensor as raw value arrays (i.e. [0.93, 1.01, 1.10, 1.15, 1.07]) in 24 h cycles. If you want to customise a display that lists future data, these classes are your best choice.
You need to set all the config values in the header of the epaper_small_display_wsv_wasser.py class. Default is Köln/Rhein and it will create a sensor in HA.
Add this in apps.yaml:
epaper_small_chart_wsv_wasser:
  module: epaper_small_display_wsv_wasser
  class: SmallDisplayChartWsvWasser
For manual triggering add a script that fires the event EPAPER_GENERATE_CHART_WSV_WASSER. See above or add it via the HA UI.
If you let the class update HA with a sensor, the sensor is easily found as "Water Level".
The WSV display renders historical data. The class fetches the measurements from a REST API and reduces the result from quarterly updates to hour updates (every fourth value). It also cuts everything under a "normal level" to make the chart more readable on high numbers.
You can choose with changing the config CHART_LATEST_TO_RIGHT if the chart should be rendered from the left or right.
