This analysis is a mock-commission from our client, a potential playwright in the UK. In this analysis, we look at eight years of raw campaign data scraped from Kickstarter to draw conclusions regarding the most favorable conditions (campaign goals, duration, start date) to set up a future campaign under.
Our first question was "Is there a visible trend between the outcomes of Kickstarter campaigns with respect to their launch dates?". To this end, I needed to sort the various outcomes of Kickstarter campaigns and plot them against the year the campaign was launched. The raw data from Kickstarter requires some conversion to a human readable format before it can be worked with. It's originally stored in a Unix format which plots the current time as the number of seconds elapsed since the epoch, or January 1, 1970. To this end, I used the following formula:
=((($K522/60)/60)/24)+DATE(1970,1,1)
Where $K522 represents the original Unix date (in seconds), which is then divided by 60 to return the number of minutes elapsed, and then 60 again to return the number hours elapsed, and then 24 to return the number of days elapsed. This is then added to the Unix epoch, passed into Excel using the DATE() function. Each parameter of the date is an argument in this function. Finally, the column where the new, converted date is stored in the Date Created Conversion column, formatted as a Date. Using the default General formatting will return a number instead.
To get the year of these records alone, I used the YEAR() function and pass in the cell references from the Date Created Conversion column, and ensured the created colum, Years, was formatted as General.
NOTE: Formatting this column as a Date returns a date equal to the year + January 1st, 1900, which is the standard method of calculating dates from integers in Excel.
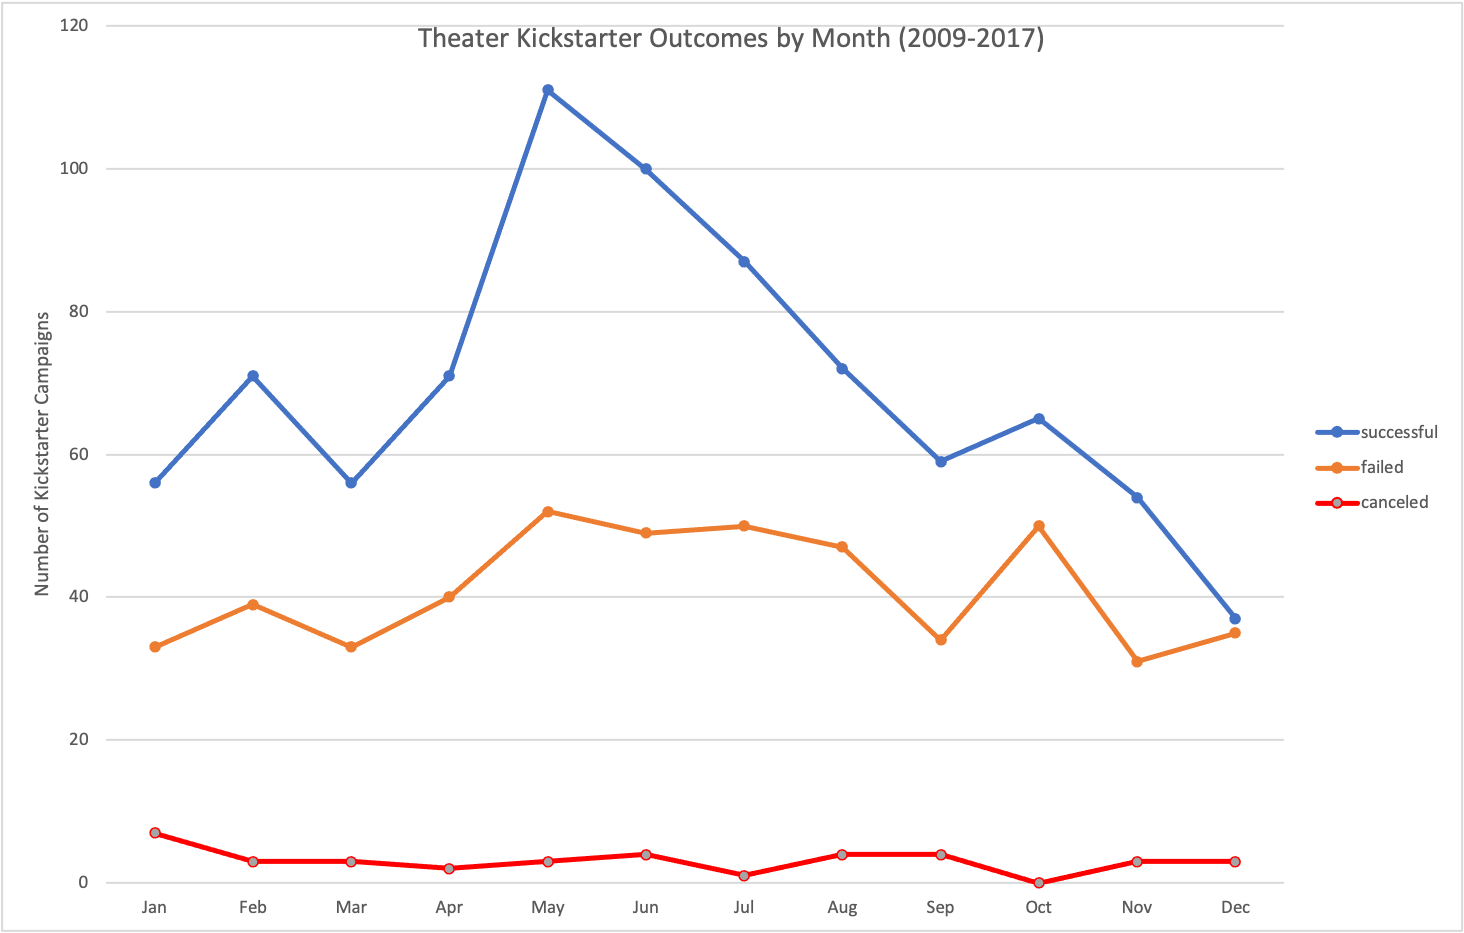
From here, I made a PivotTable, including the newly created Years column. The resulting PivotTable plots the Date Created Conversion column against the Outcomes column. I filtered this by Years and the Parent Category and only included the Theater category to help focus our output. If our client wanted, they could look at any individual year's data to see if any global economic events, for example, were influencing a given year's outcomes.
For ease of use, I also created a line graph as a PivotChart to visualize any trends in the data.
The second analysis our client requested was one that looked for trends in Kickstarter-backed plays' outcomes based off their campaign's initial funding goals.
To start, I created 12 arbitrary brackets, 10 in increments of five thousand and two to cover those cases where campaigns required less than 1,000 or more than 50,000. I then used the COUNTIFS() function in Excel, which uses AND conditional logic and takes a set of arguments and the criteria to search for them. It then returns an integer count of the number of instances found that fulfil the specified criteria.
For example, the full function used to count the number of successful plays between 5,000 and 9,999 was:
=COUNTIFS(Kickstarter!$P:$P,"plays",Kickstarter!$G:$G,"successful",Kickstarter!$D:$D,">=5000",Kickstarter!$D:$D,"<=9999")
From the above code snippet, we can see that the COUNTIFS() function first searches for the P:P array in the Kickstarter spreadsheet and counts any records containing only the string plays . It then follows the formula and looks at the remaining three conditions, specifying to count only successful campaigns whose goals were between 5,000 and 9,999. The output of this function is the number of records that satisfy all four criteria.
I used the above methodology to work through the remaining possibilities of data across the failed and canceled outcomes, across all 12 goal brackets.
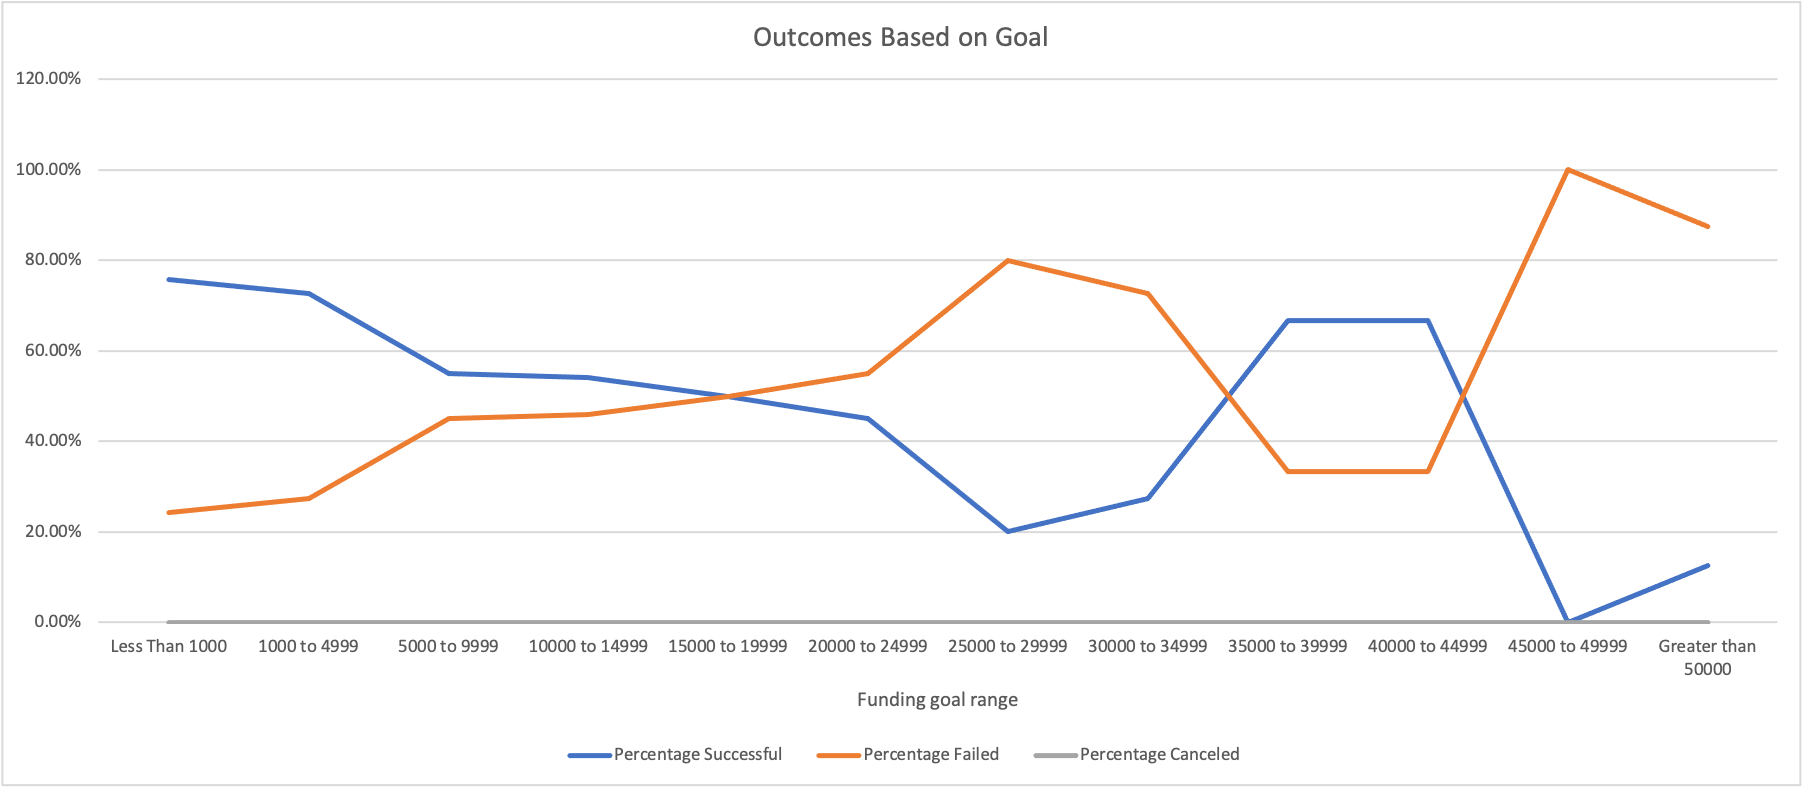
I also reported these values as proportions of the total number of campaigns in each bracket. I plotted them in the following chart:
The most prominent difficulty I experienced conducting this analysis was understanding how Excel handled Dates versus its internal conversion of Numbers into Dates. Paying close attention to the formats of values in the columns is key here; while the Date Created Conversion column is formatted as a date, calling the YEAR() function on this range will return a value that should be handled in the General format.
In the Outcomes Based on Goals analysis, attention to detail would be the most important skill to have to overcome potential difficulty, as the COUNTIFS() function is very sensitive to typos or incorrectly passed values. Ensuring that the strings and arrays referenced are correctly typed is paramount to avoiding any errors in reference. Additionally, misspelling string values will not throw an error to the user, but may not count the expected number of records.
From the results of the Outcomes by Campaign Launch Date analysis, we can conclude the following:
- Between 2009 and 2017, there was a greater number of ultimately successful campaigns launched in May, June, and July than any other months.
- Between 2009 and 2017, December had the lowest number of successfully funded campaigns (n=37), almost equal to the number of failed campaigns (n=35)
From the results of the Outcomes Based on Goals analysis, we can conclude the following:
- Plays with funding goals under 1,000 units of the local currency (as currency wasn't standardized in this analysis) had the highest proportion of successful campaigns.
Some limitations of this dataset are:
- The dataset does not standardize currencies or provide historic conversion rates, thereby complicating any analyses comparing goals or amounts pledged, as the figures would be different amounts in absolute terms.
- Due to the fact that Kickstarter is a relativly new platform, the eight years of available data increase in resolution; that is, there is much less data available in 2008 than there is in 2017. Additionally, if this analysis was being done in 2020, we're missing two years of data as well which could reflect shifting consumer trends.
This analysis could be taken further by doing the following:
-
Plotting the proportion of successful/failed theater outcomes as a fraction of the Grand Total of campaigns in a given month to determine whether there was a statistically significant proportion of successful campaigns in a given month compared to others. This could, in theory, provide us the evidence-based best month to launch a campaign.
-
We could standardize the currencies to USD by using available historic exchange rate data and converting the various currencies accordingly. This would add more credibility to our Outcomes Based on Goals analysis, instead of comparing Goals across currencies.
-
We could potentially compare launch months to campaign goals to see whether campaigns launched in a specific month had higher or lower goals. For example, we could answer the question "Do campaigns launched in December have higher goals than those launched in June?". This could help shed light on expected consumer trends, such as the hypothesis that people are generally more charitable around Christmas.

