xk6-dashboard
A k6 extension that enables creating web based metrics dashboard for k6.
By using xk6-dashboard output extension you can access metrics from k6 process via Server-sent events (SSE). All custom k6 metrics (Counter,Gauge,Rate,Trend) and build-in metrics will be accessible in the event stream.
Screenshots
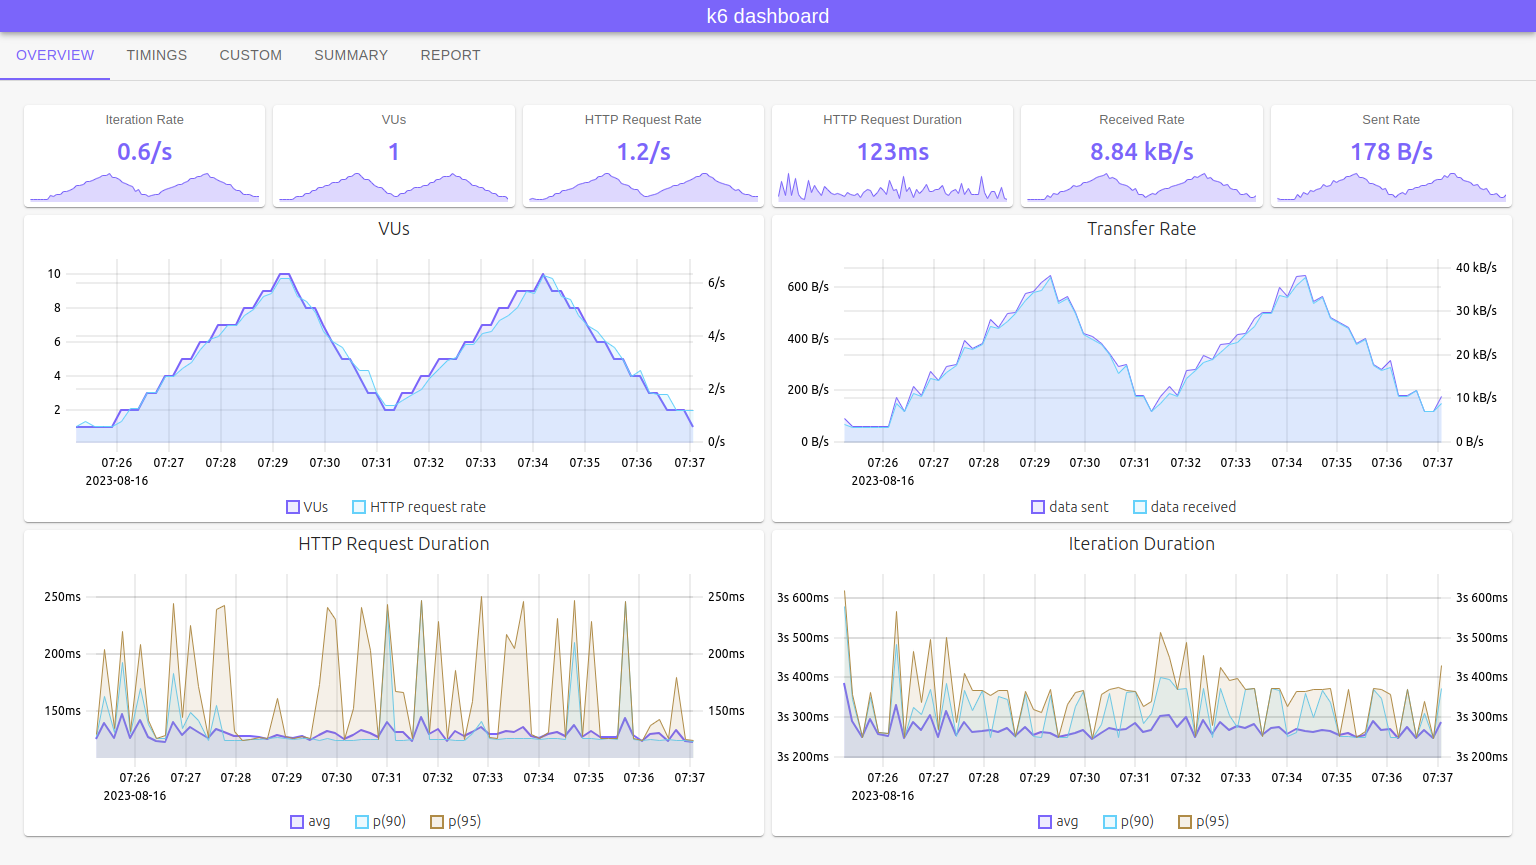
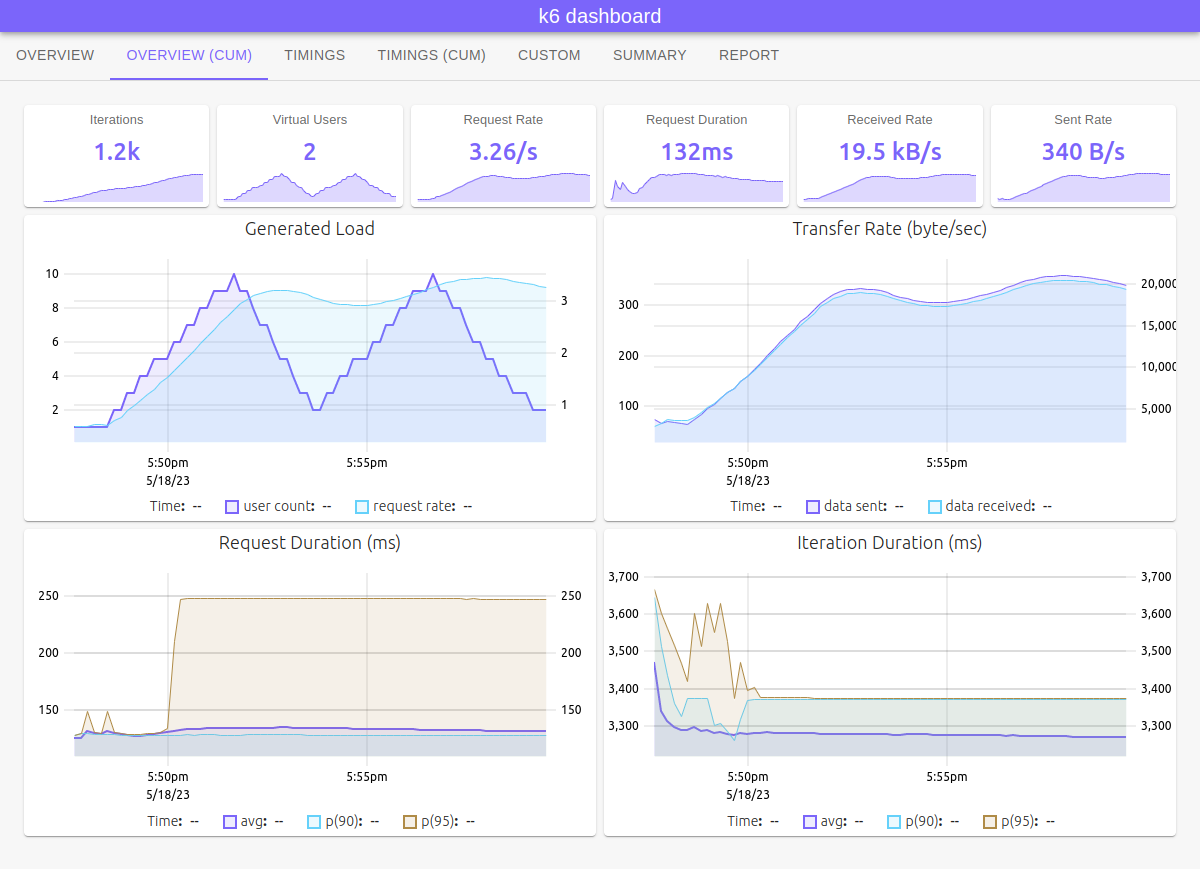
Overview
The overview tabs provides an overview of the most important metrics of the test run. Graphs plot the value of metrics over time.
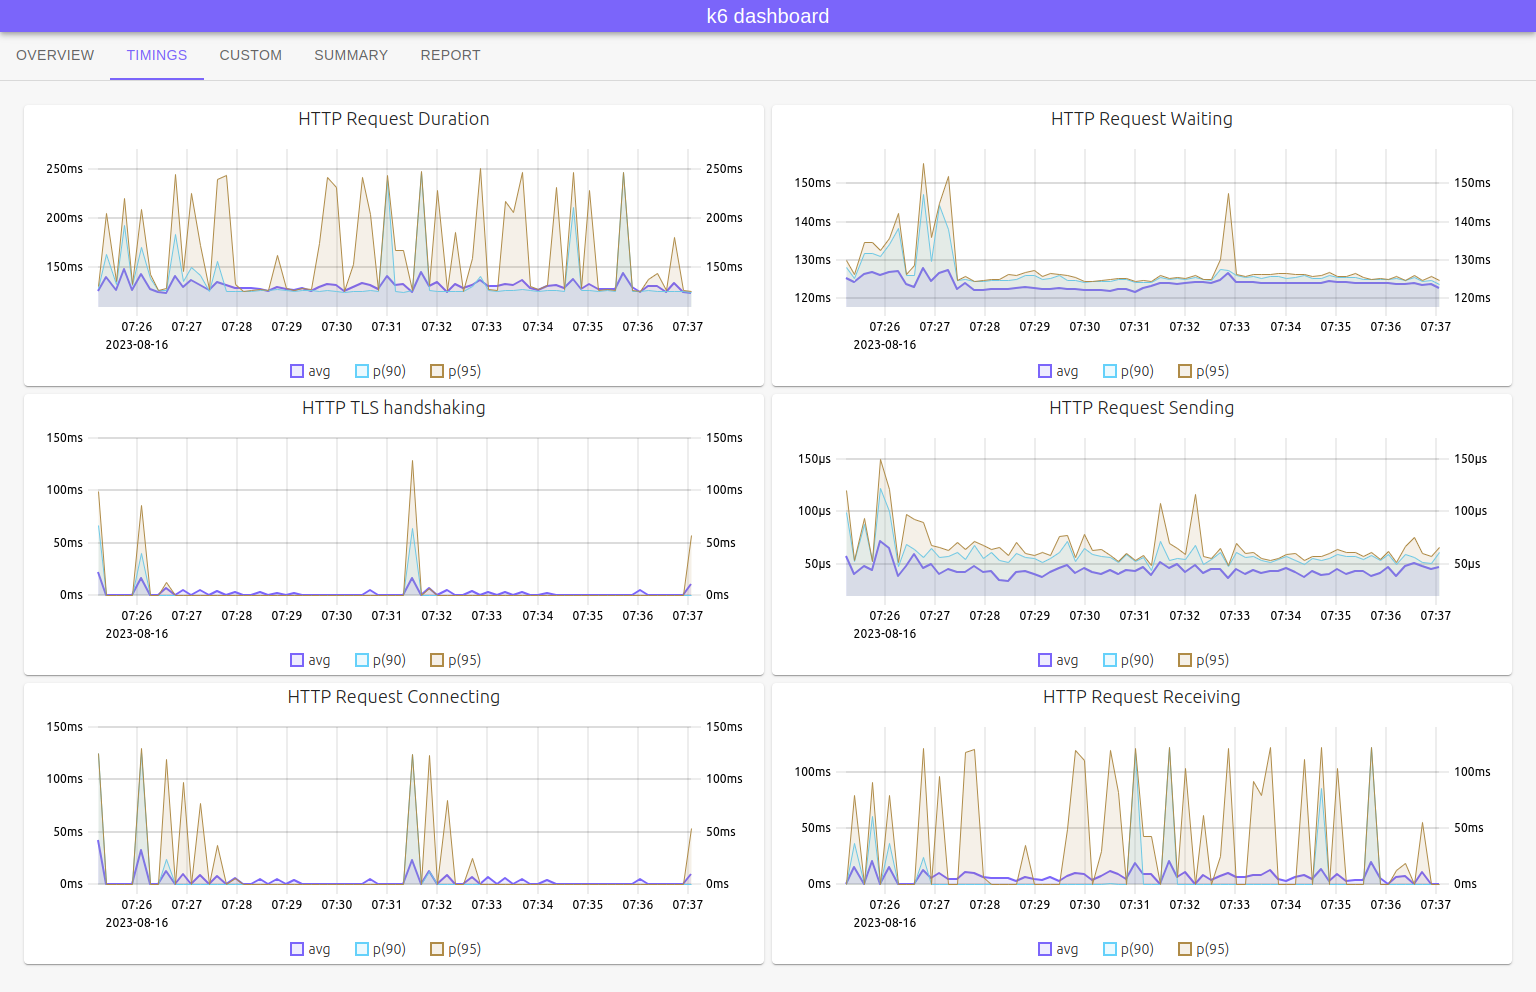
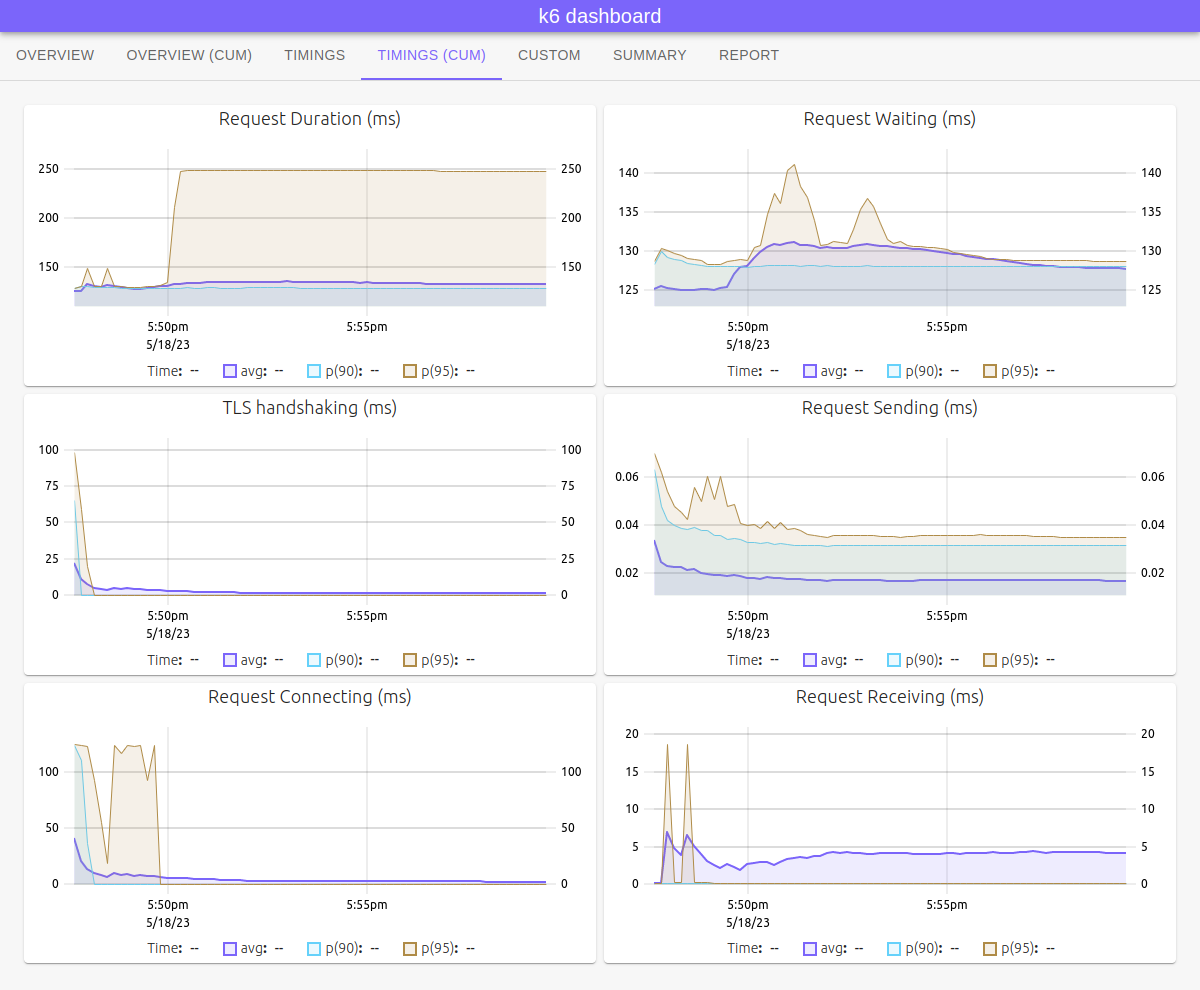
Timings
The timings tabs provides an overview of test run HTTP timing metrics. Graphs plot the value of metrics over time.
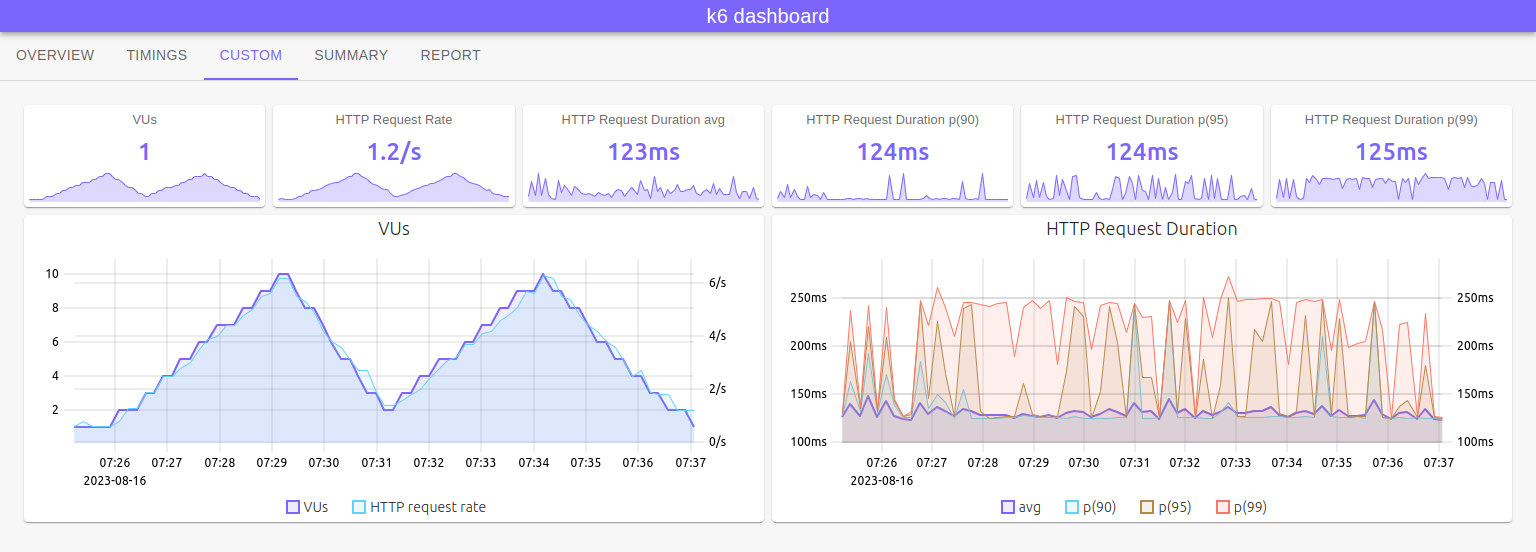
Custom Tab
Example of customizing the display of metrics.
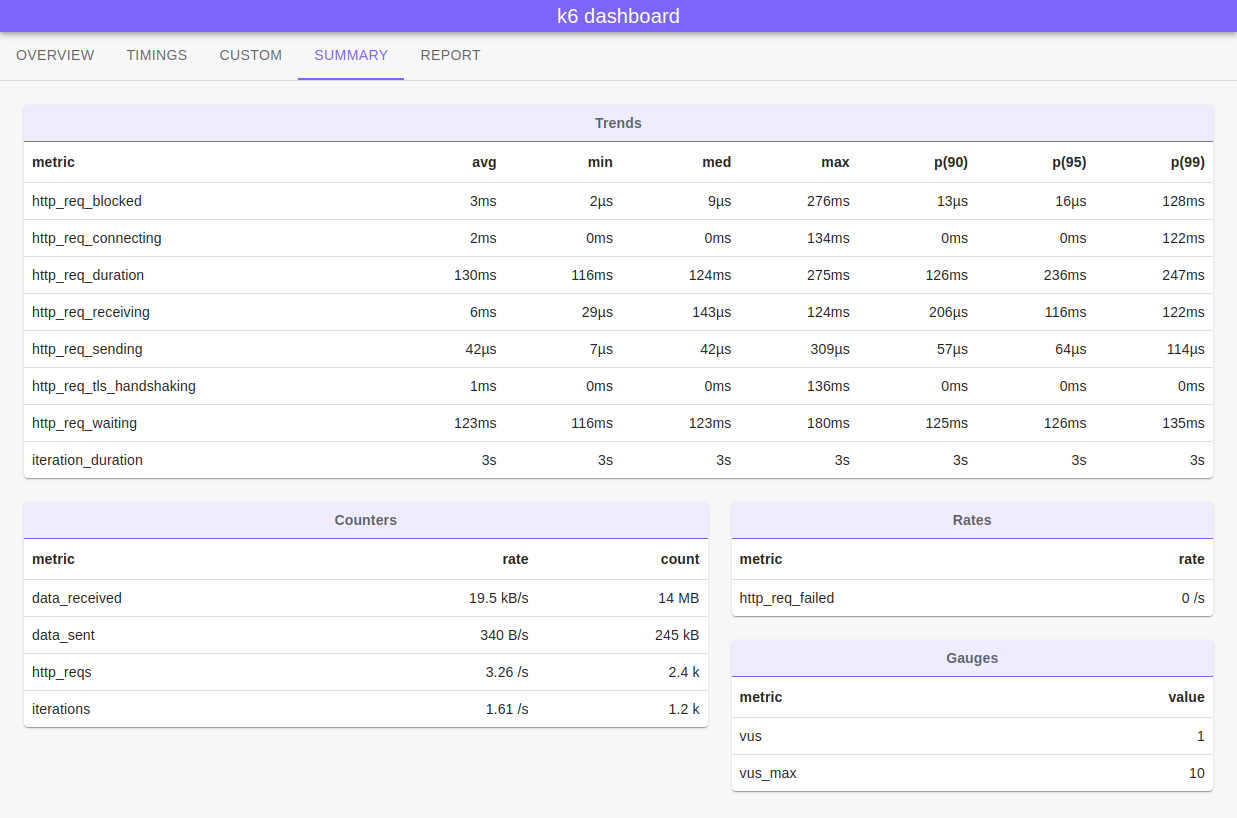
Summary Tab
Summary tab contains a summary of the test run metrics. The tables contains the aggregated values of the metrics for the entire test run.
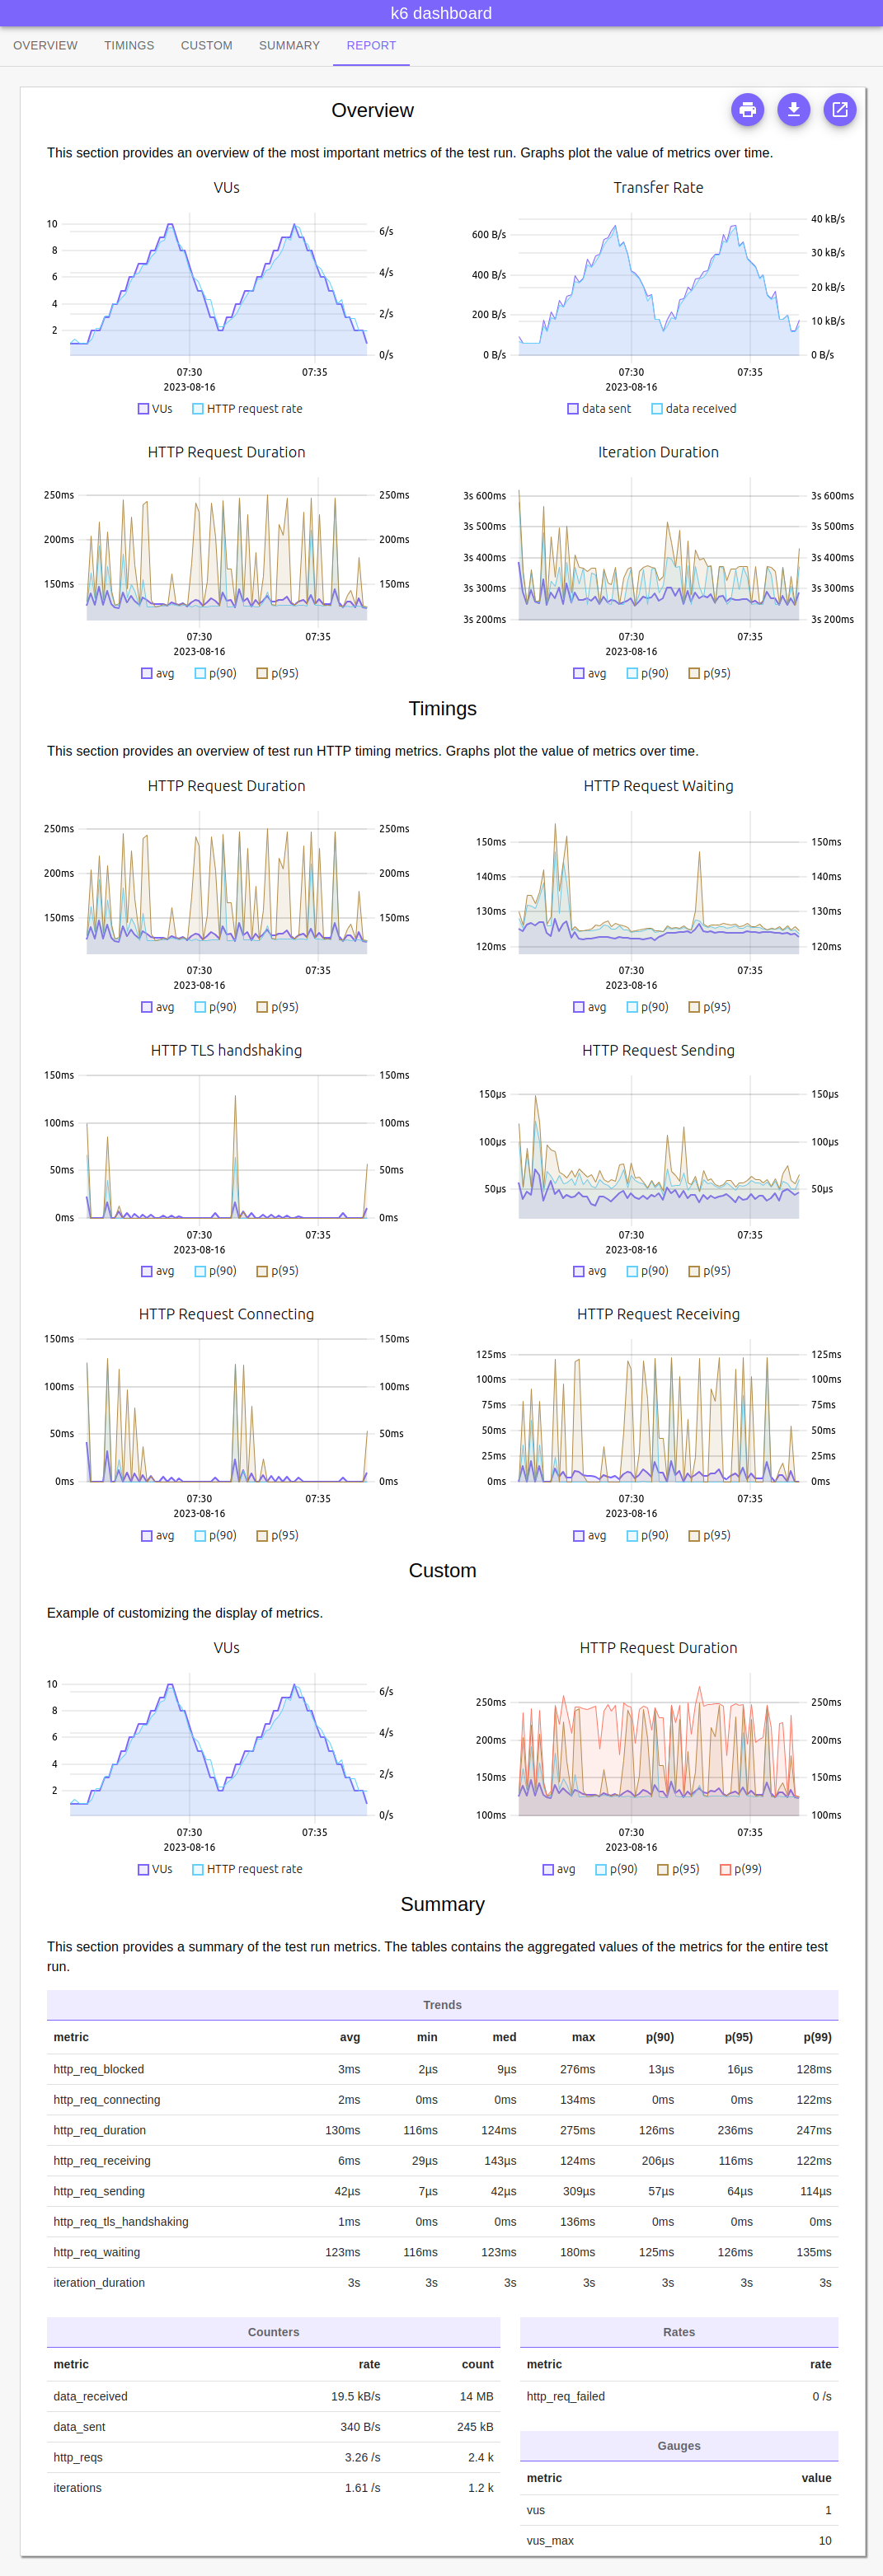
Report
The report tab contains a test run report in a printable (or saveable to PDF) format.
Report PDF
Table of Contents
Download
You can download pre-built k6 binaries from Releases page. Check Packages page for pre-built k6 Docker images.
Build
To build a k6 binary with this extension, first ensure you have the prerequisites:
- Go toolchain
- Git
Then:
- Download
xk6:
$ go install go.k6.io/xk6/cmd/xk6@latest- Build the binary:
$ xk6 build --with github.com/szkiba/xk6-dashboard@latestUsage
Without parameters the dashboard will be accessible on port 5665 with any web browser: http://127.0.0.1:5665
$ ./k6 run --out dashboard script.js

          /\      |‾‾| /‾‾/   /‾‾/
     /\  /  \     |  |/  /   /  /
    /  \/    \    |     (   /   ‾‾\
   /          \   |  |\  \ |  (‾)  |
  / __________ \  |__| \__\ \_____/ .io

  execution: local
     script: script.js
     output: dashboard (:5665) http://127.0.0.1:5665
Using
--out dashboard=openwill automatically open a new browser window.
Parameters
The output extension accepts parameters in a standard query string format:
k6 run --out 'dashboard=param1=value1¶m2=value2¶m3=value3'
Note apostrophe (
') characters around the--outparameter! You should use it for escape&characters from shell (or use backslash before&characters).
The following parameters are recognized:
| parameter | description |
|---|---|
| host | Hostname or IP address for HTTP endpoint (default: "", empty, listen on all interfaces) |
| port | TCP port for HTTP endpoint (default: 5665), example: 8080 |
| period | Event emitting frequency (default: 10s), example: 1m |
| open | Set to true (or empty) for opening browser window automatically |
| config | UI configuration file location (default: .dashboard.js) (see Customization) |
Docker
You can also use pre-built k6 image within a Docker container. In order to do that, you will need to execute something like the following:
Linux
docker run -v $(pwd):/scripts -p 5665:5665 -it --rm ghcr.io/szkiba/xk6-dashboard:latest run --out=dashboard /scripts/script.js
Windows
docker run -v %cd%:/scripts -p 5665:5665 -it --rm ghcr.io/szkiba/xk6-dashboard:latest run --out=dashboard /scripts/script.js
The dashboard will accessible on port 5665 with any web browser: http://127.0.0.1:5665
Events
The /events endpoint (default: http://127.0.0.1:5665/events) is a standard SSE event source endpoint. Using this event source you can create your own dashboard UI.
Events will be emitted periodically, based on period parameter (default: 10s). The event's data is a JSON object, with metric names as property names and metric values as property values. The format is similar to List Metrics response format from k6 REST API.
Two kind of events will be emitted:
snapshotcontains metric values from last periodcumulativecontains cumulative metric values from the test starting point
Example events
event: snapshot
id: 1
data: {"checks":{"type":"rate","contains":"default","tainted":null,"sample":{"rate":0}},"data_received":{"type":"counter","contains":"data","tainted":null,"sample":{"count":11839,"rate":5919.5}},"data_sent":{"type":"counter","contains":"data","tainted":null,"sample":{"count":202,"rate":101}},"http_req_blocked":{"type":"trend","contains":"time","tainted":null,"sample":{"avg":0.0037155,"max":0.00485,"med":0.0037155,"min":0.002581,"p(90)":0.0046231,"p(95)":0.00473655}},"http_req_connecting":{"type":"trend","contains":"time","tainted":null,"sample":{"avg":0,"max":0,"med":0,"min":0,"p(90)":0,"p(95)":0}},"http_req_duration":{"type":"trend","contains":"time","tainted":null,"sample":{"avg":120.917558,"max":120.928988,"med":120.917558,"min":120.906128,"p(90)":120.926702,"p(95)":120.927845}},"http_req_failed":{"type":"rate","contains":"default","tainted":null,"sample":{"rate":0}},"http_req_receiving":{"type":"trend","contains":"time","tainted":null,"sample":{"avg":0.0709745,"max":0.088966,"med":0.0709745,"min":0.052983,"p(90)":0.0853677,"p(95)":0.08716685}},"http_req_sending":{"type":"trend","contains":"time","tainted":null,"sample":{"avg":0.022489500000000003,"max":0.033272,"med":0.022489500000000003,"min":0.011707,"p(90)":0.031115500000000004,"p(95)":0.03219375}},"http_req_tls_handshaking":{"type":"trend","contains":"time","tainted":null,"sample":{"avg":0,"max":0,"med":0,"min":0,"p(90)":0,"p(95)":0}},"http_req_waiting":{"type":"trend","contains":"time","tainted":null,"sample":{"avg":120.824094,"max":120.841438,"med":120.824094,"min":120.80675,"p(90)":120.8379692,"p(95)":120.83970359999999}},"http_reqs":{"type":"counter","contains":"default","tainted":null,"sample":{"count":2,"rate":1}},"iteration_duration":{"type":"trend","contains":"time","tainted":null,"sample":{"avg":3244.614784,"max":3244.614784,"med":3244.614784,"min":3244.614784,"p(90)":3244.614784,"p(95)":3244.614784}},"iterations":{"type":"counter","contains":"default","tainted":null,"sample":{"count":1,"rate":0.5}},"time":{"type":"gauge","contains":"time","tainted":null,"sample":{"value":1679907081015}},"vus":{"type":"gauge","contains":"default","tainted":null,"sample":{"value":1}},"vus_max":{"type":"gauge","contains":"default","tainted":null,"sample":{"value":2}}}

event: cumulative
id: 1
data: {"checks":{"type":"rate","contains":"default","tainted":null,"sample":{"rate":0}},"data_received":{"type":"counter","contains":"data","tainted":null,"sample":{"count":46837,"rate":1115.1362807429666}},"data_sent":{"type":"counter","contains":"data","tainted":null,"sample":{"count":1653,"rate":39.35607045857172}},"http_req_blocked":{"type":"trend","contains":"time","tainted":null,"sample":{"avg":88.12648020000002,"max":456.345376,"med":0.0056419999999999994,"min":0.00219,"p(90)":262.8713841999999,"p(95)":359.60838009999975}},"http_req_connecting":{"type":"trend","contains":"time","tainted":null,"sample":{"avg":37.2988213,"max":131.097342,"med":0,"min":0,"p(90)":122.40998579999999,"p(95)":126.75366389999999}},"http_req_duration":{"type":"trend","contains":"time","tainted":null,"sample":{"avg":123.92543040000001,"max":133.508481,"med":121.77833150000001,"min":120.412089,"p(90)":132.29845799999998,"p(95)":132.9034695}},"http_req_failed":{"type":"rate","contains":"default","tainted":null,"sample":{"rate":0.2}},"http_req_receiving":{"type":"trend","contains":"time","tainted":null,"sample":{"avg":0.10157959999999999,"max":0.337678,"med":0.0826445,"min":0.052983,"p(90)":0.11383719999999992,"p(95)":0.22575759999999973}},"http_req_sending":{"type":"trend","contains":"time","tainted":null,"sample":{"avg":0.035149900000000005,"max":0.096238,"med":0.0272325,"min":0.011707,"p(90)":0.06422679999999999,"p(95)":0.08023239999999997}},"http_req_tls_handshaking":{"type":"trend","contains":"time","tainted":null,"sample":{"avg":38.9789687,"max":268.92473,"med":0,"min":0,"p(90)":135.67093429999994,"p(95)":202.29783214999986}},"http_req_waiting":{"type":"trend","contains":"time","tainted":null,"sample":{"avg":123.78870090000001,"max":133.411013,"med":121.5094465,"min":120.326814,"p(90)":132.15912649999999,"p(95)":132.78506975}},"http_reqs":{"type":"counter","contains":"default","tainted":null,"sample":{"count":10,"rate":0.23808875050557607}},"iteration_duration":{"type":"trend","contains":"time","tainted":null,"sample":{"avg":3626.924762,"max":4258.763721,"med":3377.395781,"min":3244.614784,"p(90)":4082.4901330000002,"p(95)":4170.626927}},"iterations":{"type":"counter","contains":"default","tainted":null,"sample":{"count":3,"rate":0.07142662515167282}},"time":{"type":"gauge","contains":"time","tainted":null,"sample":{"value":1679907081015}},"vus":{"type":"gauge","contains":"default","tainted":null,"sample":{"value":1}},"vus_max":{"type":"gauge","contains":"default","tainted":null,"sample":{"value":2}}}
Customization
The embedded user interface can be customized using a single JavaScript configuration file specified in the config parameter (default: .dashboard.js in the current directory). The configuration file is an ES6 module that is executed in the browser. The module's default export is a JavaScript configuration object.
Before executing the configuration file, the window.defaultConfig object is created with the default configuration. The default configuration is loaded from the ui/assets/ui/public/boot.js file, which can give you ideas for creating your own configuration.
Examples
In this example, a tab called Custom is defined, which contains six panels and two charts. The first two panels are just a reference to the two panels of the built-in Overview tab.
// helper for adding p(99) to existing chart
function addP99 (chart) {
  chart.series = {
    ...chart.series,
    'http_req_duration_trend_p(99)': { label: 'p(99)' }
  }
}

// define request duration panel
function durationPanel (suffix) {
  return {
    id: `http_req_duration_${suffix}`,
    title: `Request Duration ${suffix}`,
    metric: `http_req_duration_trend_${suffix}`,
    format: 'duration'
  }
}

// copy vus and http_reqs panel from default config
const overview = defaultConfig.tab('overview_snapshot')

// define custom panels
const customPanels = [
  overview.panel('vus'),
  overview.panel('http_reqs'),
  durationPanel('avg'),
  durationPanel('p(90)'),
  durationPanel('p(95)'),
  durationPanel('p(99)')
]

// copy http_req_duration chart form default config...
const durationChart = { ...overview.chart('http_req_duration') }

// ... and add p(99)
addP99(durationChart)

// define custom tab
const customTab = {
  id: 'custom',
  title: 'Custom',
  event: overview.event,
  panels: customPanels,
  charts: [overview.chart('http_reqs'), durationChart],
  description: 'Example of customizing the display of metrics.'
}

// add custom tab to configuration
defaultConfig.tabs.push(customTab)

export default defaultConfig
p(99)
In this example, the 99th percentile value is added to the Request Duration chart on the built-in Overview tabs.
// helper for adding p(99) to existing chart
function addP99 (chart) {
  chart.series['http_req_duration_trend_p(99)'] = { label: 'p(99)' }
}

// add p(99) to overview panels request duration charts
addP99(defaultConfig.tab('overview_snapshot').chart('http_req_duration'))
addP99(defaultConfig.tab('overview_cumulative').chart('http_req_duration'))

export default defaultConfig
Command Line
The xk6-dashboard extension adds a dashboard command to the k6 command line:
$ ./k6 dashboard --help

xk6-dashboard commands

Usage:
  k6 dashboard [command]

Available Commands:
  replay      load the saved JSON results and replay it for the dashboard UI

Flags:
  -h, --help   help for dashboard

Use "k6 dashboard [command] --help" for more information about a command.
At the moment, the dashboard command has only one subcommand, replay, which can be used to play back test run results previously saved in JSON format for the dashboard.
$ ./k6 dashboard replay --help

The replay command load the saved JSON results and replay it for the dashboard UI.
The compressed file will be automatically decompressed if the file extension is .gz

Usage:
  k6 dashboard replay file [flags]

Flags:
      --config string   UI configuration file location (default: '.dashboard.js')
      --host string     Hostname or IP address for HTTP endpoint (default: '', empty, listen on all interfaces)
      --open            Open browser window automatically
      --period 10s      Event emitting frequency (default: 10s), example: `1m` (default 10s)
      --port int        TCP port for HTTP endpoint (default: 5665), example: 8080 (default 5665)
  -h, --help            help for replay
The replay command expects a JSON (or gzip-compressed JSON) file as an argument. Flags with the same name and meaning as the extension parameters can be used in the replay command.
Visualization of the result of a previous test run:
./k6 run --out json=test_result.json script.js
./k6 dashboard replay test_result.json
Docker
You can also use pre-built k6 image within a Docker container. In order to do that, you will need to execute something like the following:
Linux
docker run -v $(pwd):/work -v /tmp:/tmp/work -it --rm ghcr.io/szkiba/xk6-dashboard:latest run --out=json=/tmp/work/test_result.json.gz /work/script.js
docker run -v /tmp:/tmp/work -p 5665:5665 -it --rm ghcr.io/szkiba/xk6-dashboard:latest dashboard replay /tmp/work/test_result.json.gz
Windows
docker run -v %cd%:/work -v %USERPROFILE%\AppData\Local\Temp:/tmp/work -it --rm ghcr.io/szkiba/xk6-dashboard:latest run --out=json=/tmp/work/test_result.json.gz /work/script.js
docker run -v %USERPROFILE%\AppData\Local\Temp:/tmp/work -p 5665:5665 -it --rm ghcr.io/szkiba/xk6-dashboard:latest dashboard replay /tmp/work/test_result.json.gz
The dashboard will accessible on port 5665 with any web browser: http://127.0.0.1:5665
