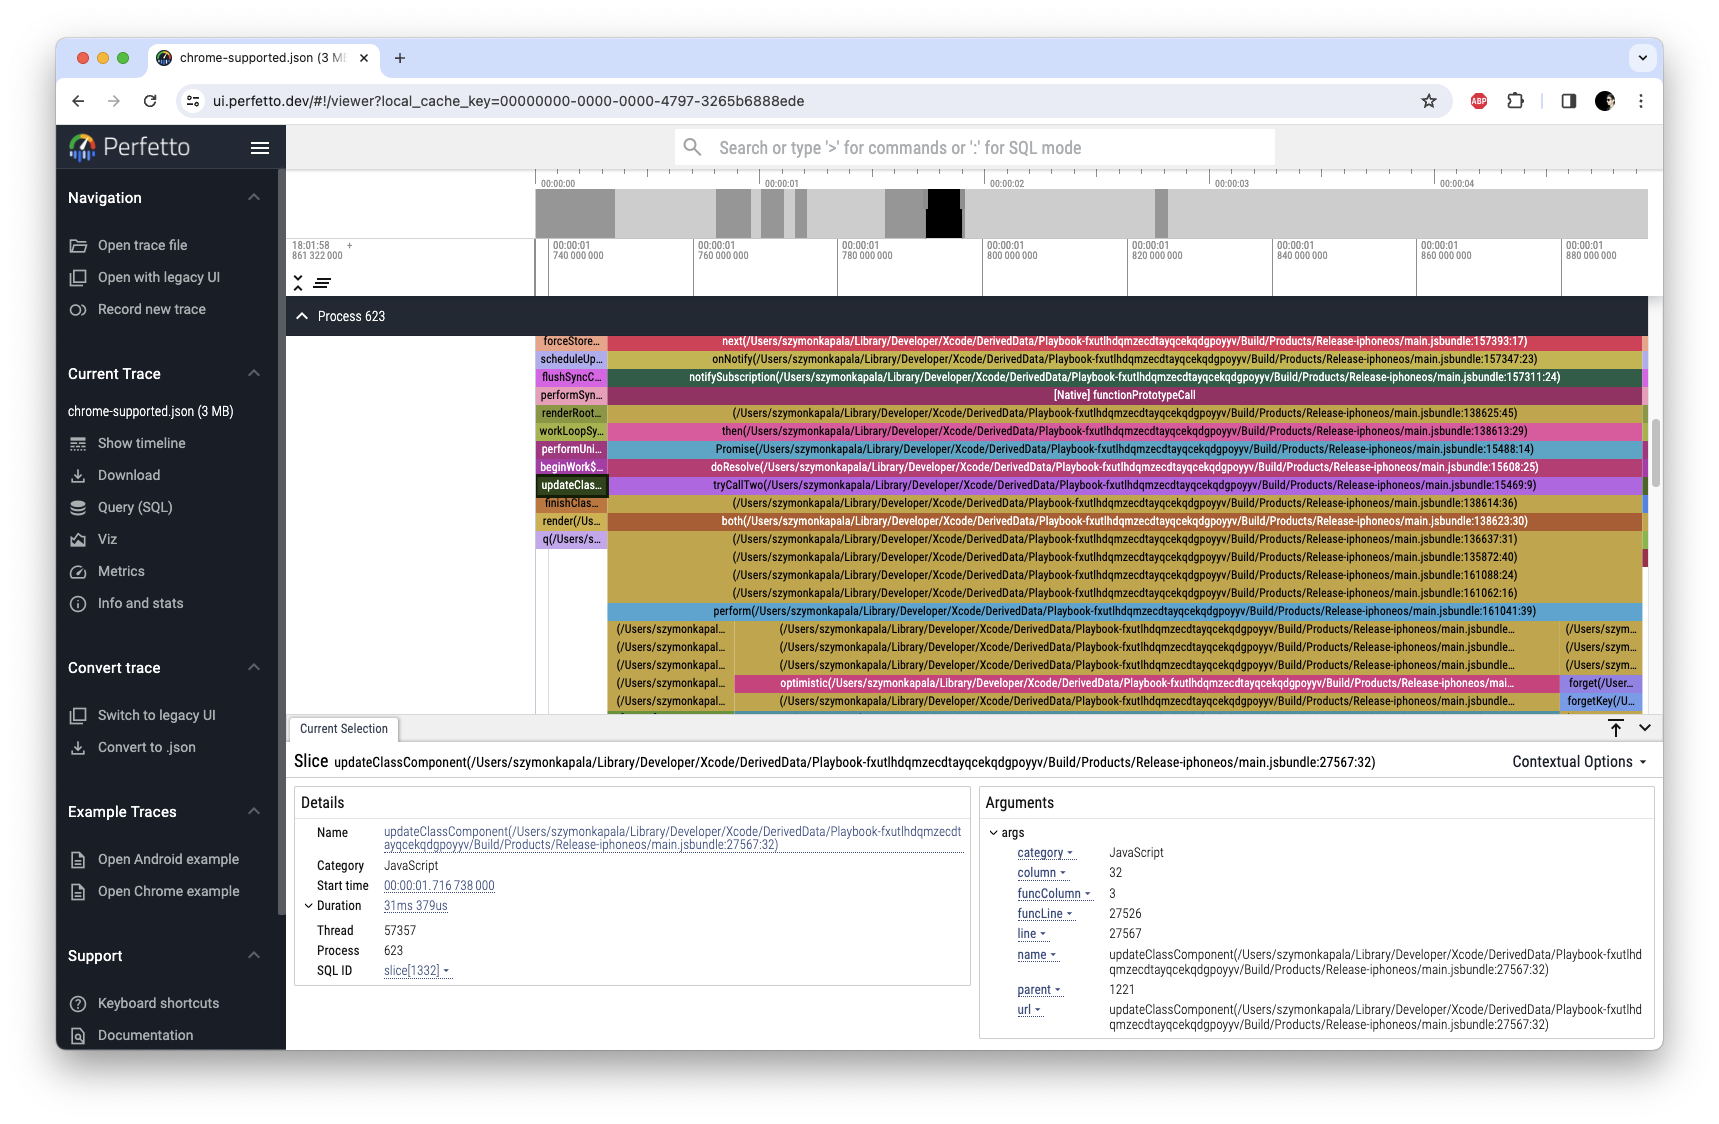
A fast and simple library to passively profile JS/Hermes performance in production and release builds.
Usually performance issues are profiled in debug builds, which could lead to false positives (e.g. JS Garbage Collectors, Hermes-specific debug markers, or other LLDB hangs).
react-native-release-profiler allows you to profile your app in release builds, both in a local environment to profile specific issues, as well as in a production environment to spot regressions or collect performance samples from a wider variety of user devices.
If you're having performance problems in your app, feel free to reach out to us at hello@margelo.io. We do this a lot. 😉
yarn add react-native-release-profiler
cd ios && pod install- Install react-native-release-profiler
- Build your app in release mode
- Start a profiling session:
import { startProfiling } from 'react-native-release-profiler'

startProfiling()
- Stop the profiling session:
import { stopProfiling } from 'react-native-release-profiler'

// `true` to save the trace to the phone's downloads folder, `false` otherwise
const path = await stopProfiling(true)
- Download and process the performance trace from your phone to your PC:
- On Android:
npx react-native-release-profiler --fromDownload --appId <your appId> - On iOS:
npx react-native-release-profiler --local <path to profile>
- On Android:
- Open the performance trace in your tool of choice:
- SpeedScope (https://www.speedscope.app)
- Perfetto UI (https://ui.perfetto.dev/)
- Google Chrome's Tracing UI (chrome://tracing)
Synchronously starts the Hermes Profiling Session.
Asynchronously stops the Hermes Profiling Session, and saves the file in a cache or downloads directory if saveInDownloadsDirectory is true.
Returns the path of the saved profile.
See the contributing guide to learn how to contribute to the repository and the development workflow.
MIT
