This project started from the vscode webview react project. It works this way, with the extension itself being in the ext-src directory and the react application being in the src directory.
The code was migrated from the PR in theia-trace-extension
It depends on the trace viewer plugins from the theia trace extension package. So it needs to be cloned and built before building the vscode extension.
git clone git@github.com:theia-ide/theia-trace-extension.git
cd theia-trace-extension
yarn
Then from this repo, add symlinks to the trace viewer packages after having run yarn on the project. To avoid conflicts with the tspClient, the exact same files should be used in both repos, so tsp-typescript-client package needs to be symlinked to the one used in theia-trace-extension, even if it is the exact same version.
yarn
mkdir node_modules/@trace-viewer
cd node_modules/@trace-viewer
ln -s /path/to/theia-trace-extension/packages/base ./
ln -s /path/to/theia-trace-extension/packages/react-components ./
cd ..
rm -rf tsp-typescript-client
ln -s /path/to/theia-trace-extension/node_modules/tsp-typescript-client ./
cd ..
After making changes on this repo and before running the vscode extension, run the yarn build command
yarn build
Then from vscode, press f5 to run the extension.
For now, only traces at the root of the workspace will be
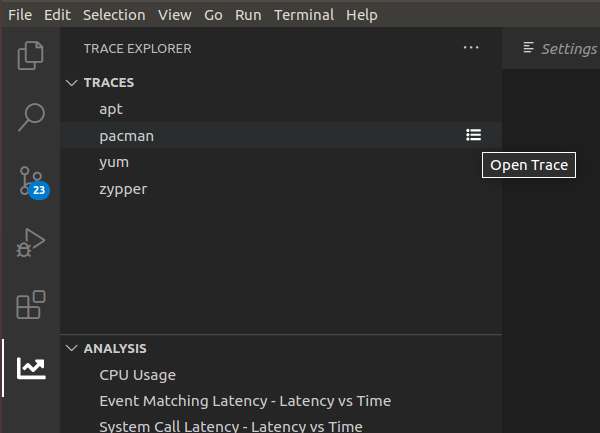
Open the Trace Explorer view (View -> Open view...).
Only the directories at the root of the folder are considered as traces and will appear under Traces in the Trace Explorer.
To open the trace, click on the icon link at the right of the view, next to the selected trace.
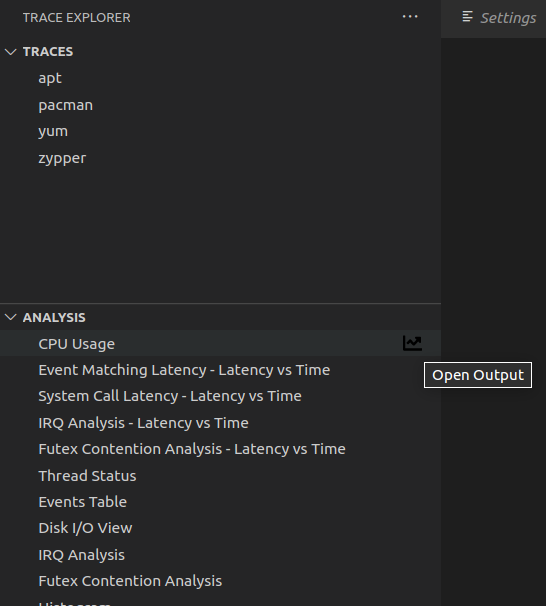
The analysis tab should be populated. Again, click on the icon to open the view in the webview panel.
When having to modify the code of the extension (in the ext-src folder), on can simply run the yarn build:extension command. It is also possible to watch for changes to have no manual steps to do before re-running the extension: yarn watch:extension or ctrl-shift-b and select the task tsc: watch - tsconfig.extension.json.
For changes in the webview part, you can run the yarn build:react command, simply re-opening a trace should show the changes. It is also possible to watch for changes with yart watch:react or ctrl-shift-b and selecting the task npm: watch:react.
It is straightforward to debug the code of the vscode extension itself (the code in ext-src) by just putting breakpoints in vscode and running the extension with f5.
The react-app is another matter. The panel is a webview that is running in its own context, so current vscode does not have access to it. (Patches welcome!)
Each panel is its own small web application, so to debug, while in the context of the webview, press ctrl-shift-p and entre the command Developer: Open Webview Developer Tools. This will open the developer tools. The code is in the Sources tab of the developer tools window that opens.
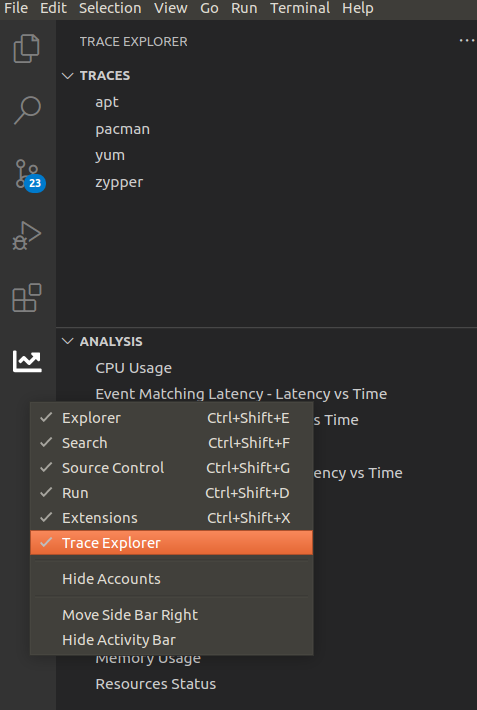
- The
Trace explorerpanel is not there, or disappears when switching panel.
Right-click on the vscode activity bar and make sure Trace Explorer is checked.
It is still a prototype, don't try anything fancy.