this widget is here to provide you information regarding your most consuming servers. Should it be CPU, Memory, Load or whatever that could come to your mind. All you need, is to find your disired metric.
- head over your Centreon install dir.
cd /usr/share/centreon/www/widgets/ - install git.
yum install git - clone this repository.
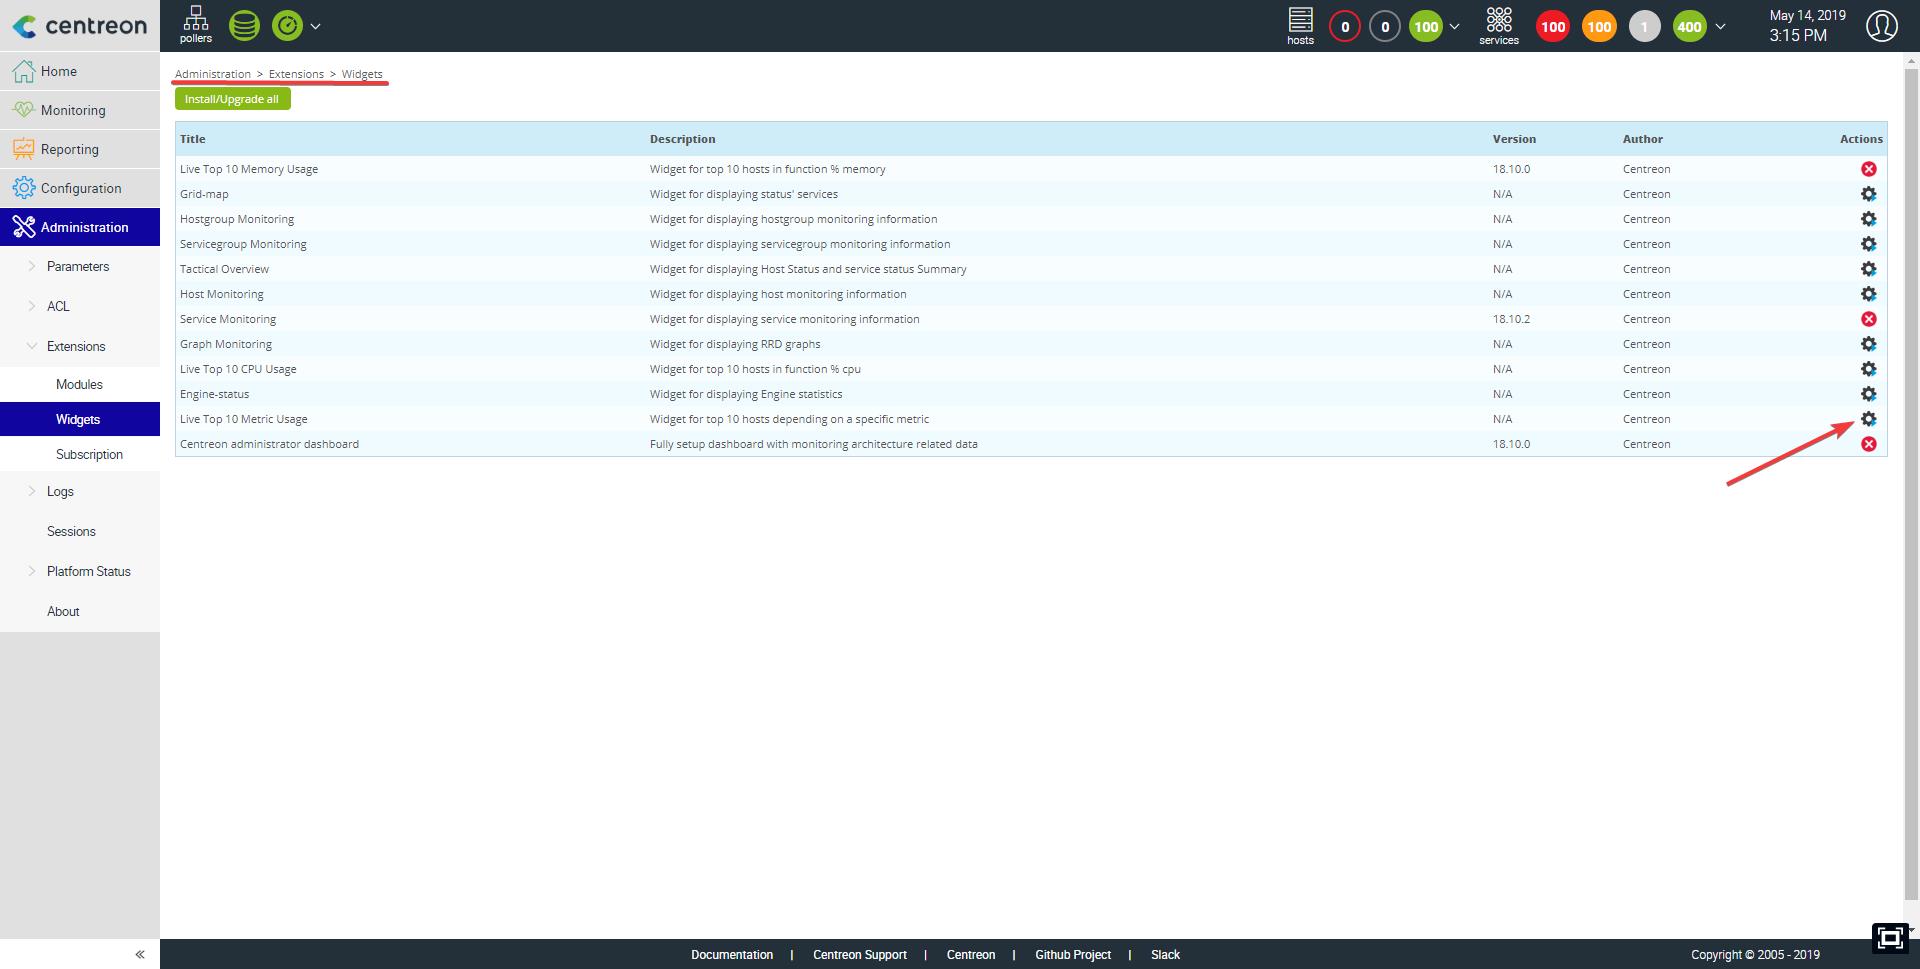
git clone https://github.com/tanguyvda/centreon-live-top10-metric-usage.git - Then, in your Centreon web interface, go to Administration -> Extensions -> widgets and install your new widget.

-
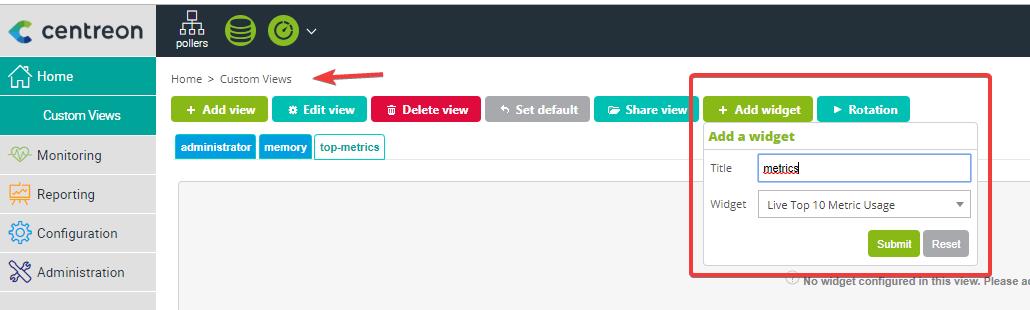
head over the home menu and add your newly installed widget.
-
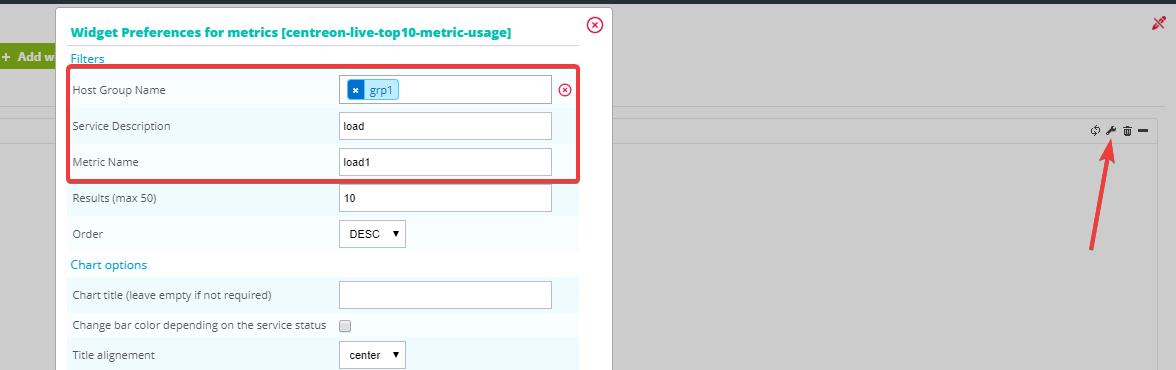
set up the mandatory parameters.


This widget comes with a lot of options and this chapter is here to help you go through.\
allows you to write your own title for the chart.


allows you to write your own subtitle for the chart.


allows you to change the titles position (left, center or right).


you can disable the chart animation if you wish and change the animation effect.

you can display the status color of your service on the bar.


you can disable the toolbar that allows you to save the chart in a PNG or SVG format.


you can display the host name as a datalabel and configure its position.


you can enable the tooltip that will show up when hovering over a bar.


you can enable annotations and change their design. Either by showing their label or changing line from dashed to full.


you can change the default size and refresh interval of the iframe in which the chart is being displayed.
