This is a very light proxy for graphite metrics with additional features:
- Taking metrics from network (see configuration) or from file directly
- Buffering metrics if Graphite itself is down
- Function of summing/averaging metrics with a special prefix (see configuration)
- Filtering 'bad' metrics, which are not passing check against regexp
- Periodical sending to Graphite server to avoid traffic pikes
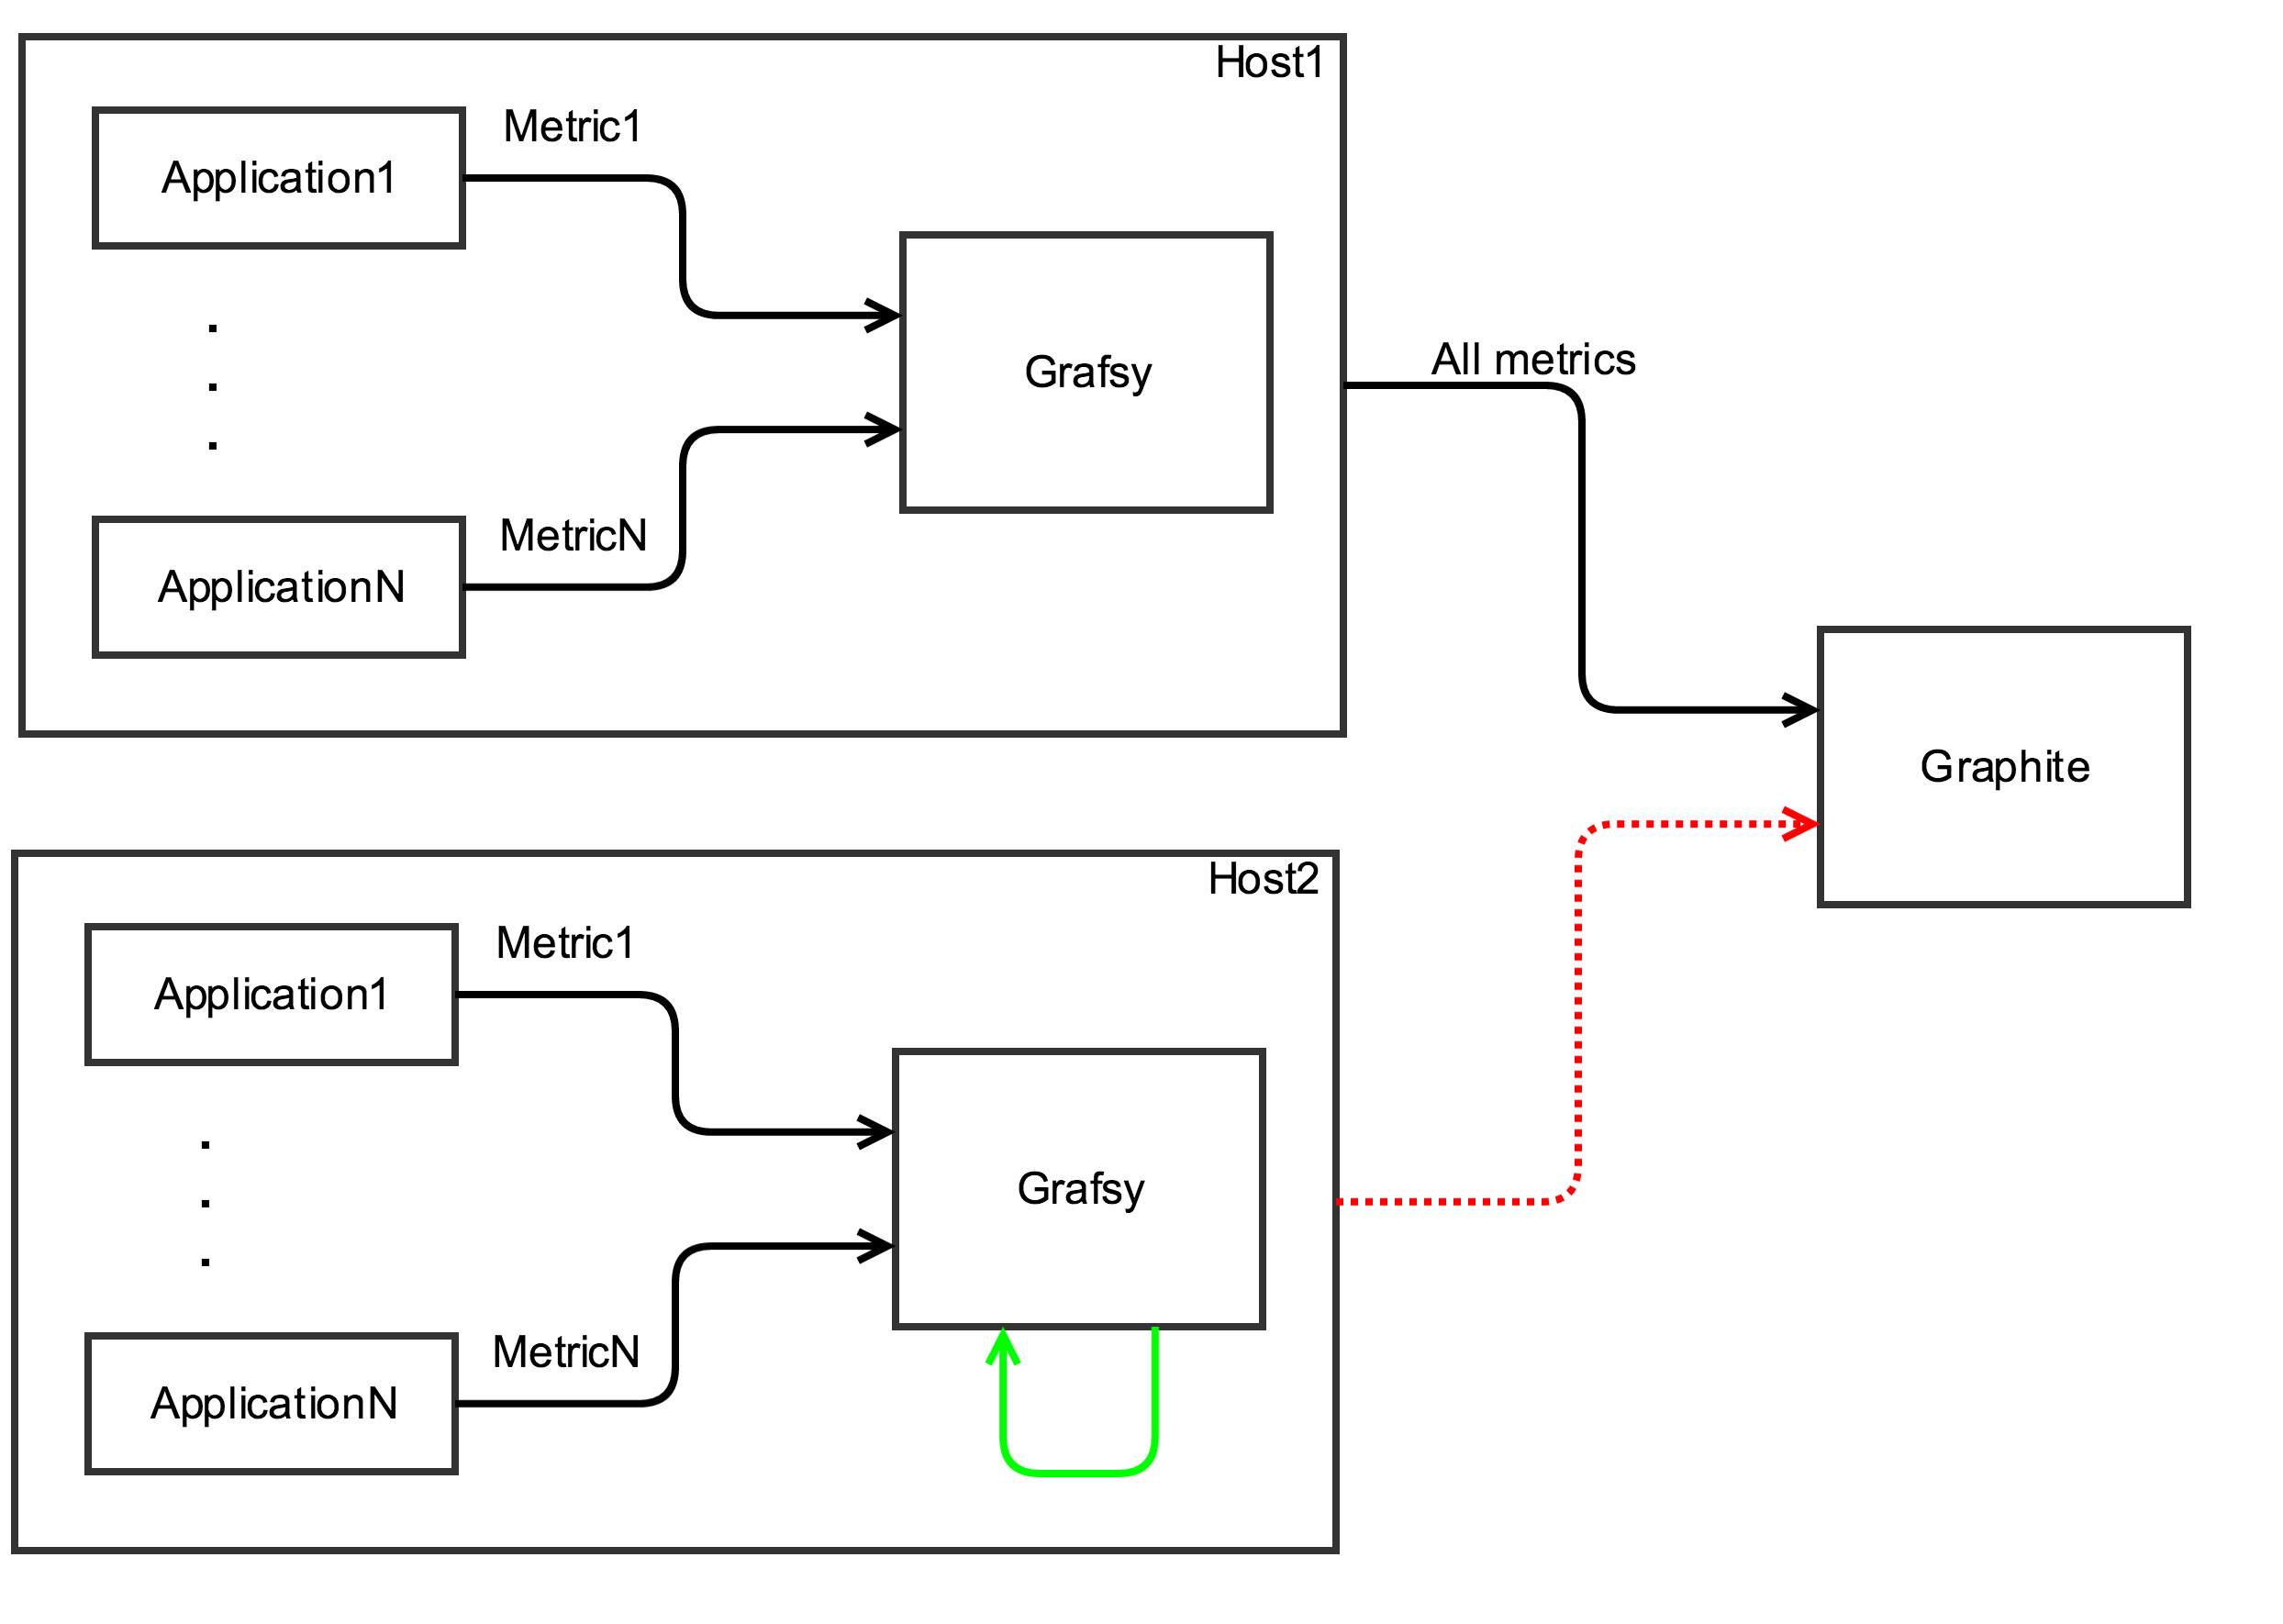
This is a representation of the Grafsy as a Black box
As you can see on diagram host2 lost connection to Graphite. With Grafsy it is completely safe, because it will retry to deliver metrics over and over until it succeed or limits will be reached
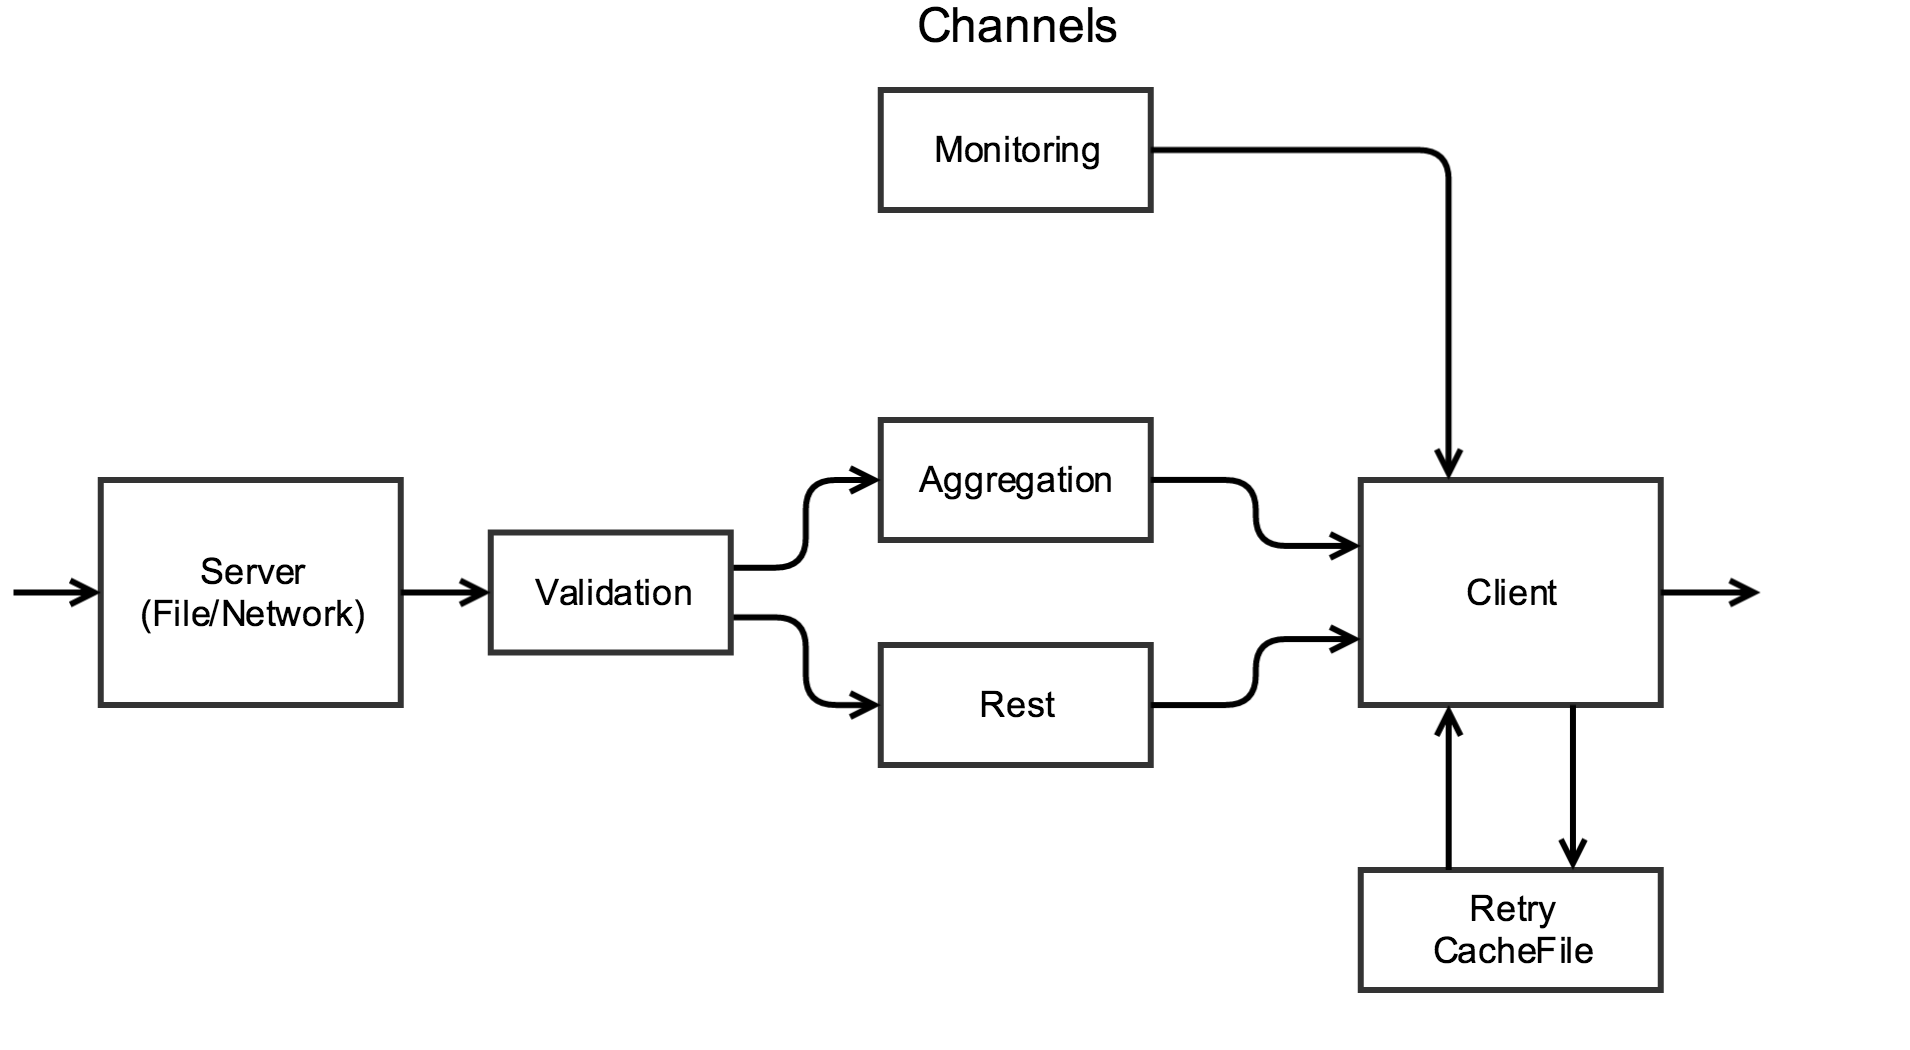
This is a simplified representation of internal components
Also I recommend you to see the presentation https://prezi.com/giwit3kyy0vu/grafsy/
Stable version of Grafsy will be marked by tags
Please look into releases
There is a config file which must be located under /etc/grafsy/grafsy.toml
But you can redefine it with option -c
Most of the time you need to use default (recommended) configuration of grafsy, but you can always modify params:
- supervisor - Supervisor manager which is used to run Grafsy. e.g. systemd or supervisord. Default is none
- clientSendInterval - The interval, after which client will send data to graphite. In seconds
- metricsPerSecond - Maximum amount of metrics which can be processed per second In case of problems with connection/amount of metrics, this configuration will take save up to maxMetrics*clientSendInterval metrics in retryFile Also these 2 params are exactly allocating memory
- allowedMetrics - Regexp of allowed metric. Every metric which is not passing check against regexp will be removed
- log - Main log file
- graphiteAddr - Real Graphite server to which client will send all data
- connectTimeout - Timeout for connecting to graphiteAddr. Timeout for writing metrics themselves will be clientSendInterval-connectTimeout-1. Default 7. In seconds
- localBind - Local address:port for local daemon
- metricDir - Directory, in which developers/admins... can write any file with metrics
- retryFile - Data, which was not sent will be buffered in this file
- sumPrefix - Prefix for metric to sum. Do not forget to include it in allowedMetrics if you change it
- sumInterval - Summing up interval for metrics with prefix "sumPrefix". In seconds
- sumsPerSecond - Amount of sums which grafsy performs per second. If grafsy receives more metrics than sumsPerSecond*sumInterval - rest will be dropped
- avgPrefix - Prefix for metric to calculate average. Do not forget to include it in allowedMetrics if you change it
- avgInterval - Summing up interval for metrics with prefix "sumPrefix". In seconds
- avgPerSecond - Amount of avg which grafsy performs per second. If grafsy receives more metrics than avgsPerSecond*avgInterval - rest will be dropped
- monitoringPath - Full path for metrics, send by grafsy itself. "HOSTNAME" will be replaced with os.Hostname() result from GO.
If os.Hostname() returns result with dots in it - they will be replaced with "_".
You can define your own path. If it does not contain magic "HOSTNAME" word, it will be preserved.
At the end of your path grafsy will append grafsy.{sent,dropped,got...} E.g servers.HOSTNAME.software or servers.my-awesome-hostname
- Install go https://golang.org/doc/install
- Make a proper structure of directories:
mkdir -p /opt/go/src /opt/go/bin /opt/go/pkg - Setup g GOPATH variable:
export GOPATH=/opt/go - Clone this project to src:
go get github.com/leoleovich/grafsy - Fetch dependencies:
cd /opt/go/github.com/leoleovich/grafsy && go get ./... - Compile project:
go install github.com/leoleovich/grafsy - Copy config file:
mkdir /etc/grafsy && cp /opt/go/src/github.com/leoleovich/grafsy/grafsy.toml /etc/grafsy/ - Change your settings, e.g.
graphiteAddr - Create a log folder:
mkdir -p /var/log/grafsyor run grafsy for user, which has permissions to create logfiledir - Run it
/opt/go/bin/grafsy

