Video Demo: bit.ly/BARD_VIDEO_DEMO
Dataset Link: bit.ly/BARD_DATASET
| Category | No. of Documents | No. of Words | Average Sentences per Document | Average words per Sentence |
| State | 242860 | 57019465 | 18.50 | 13.356 |
| Economy | 18982 | 4915141 | 20.18 | 13.378 |
| International | 32203 | 7096111 | 18.47 | 12.493 |
| Entertainment | 31293 | 6706563 | 21.70 | 10.236 |
| Sports | 50888 | 12397415 | 22.80 | 11.069 |
Furthermore, we deployed our proposed Bangla content classifier as a web application, which is accessible here. and the video demo of this application is available here. Additionally, we open-sourced the BARD dataset and source code of this work in this repository.
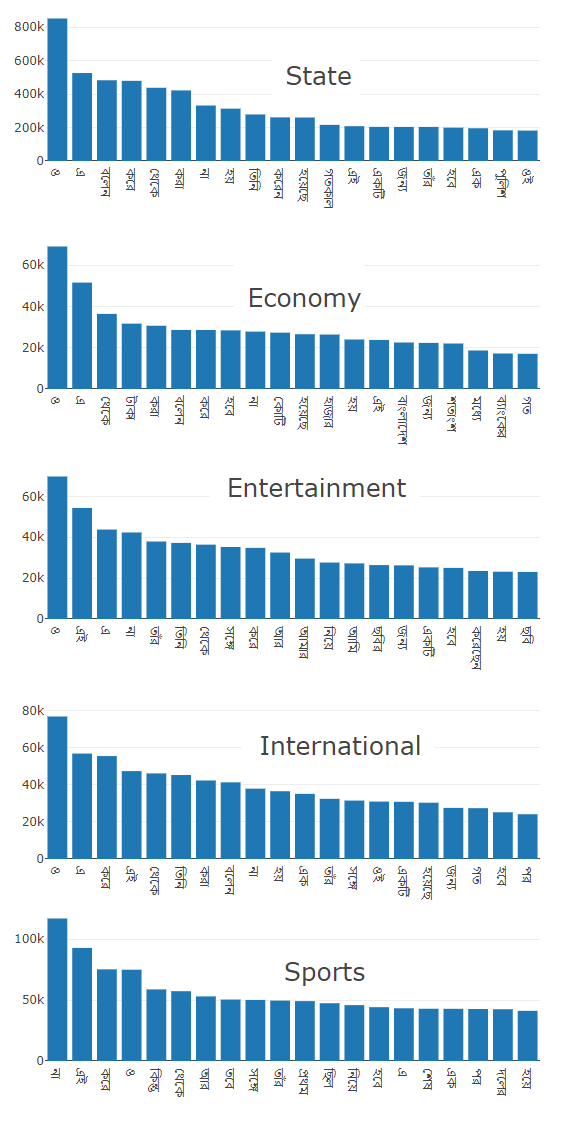
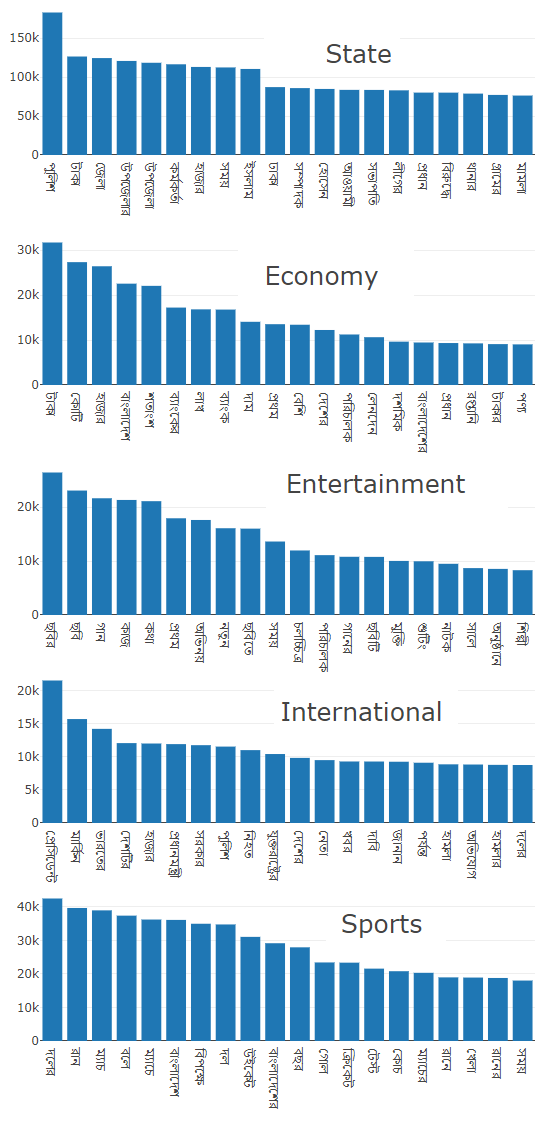
We performed textual statistical analysis on the BARDdataset articles and results are presented in Fig. 1 and 2. Thefrequency distributions of the top 20 most frequent words foreach of the five categories are depicted in Fig. 1. From thisanalysis, we can easily identify that all the categories havethe similar most frequent words. In other words, these frequentwords do not help to categorize the articles. Hence, we removearound 25 most frequent from all the articles and performedthe statistical analysis again on the filtered dataset, which ispresented in Fig. 2. Now, this filtered frequency distributiondepicted that each category has some unique distribution ofwords, which may contribute to categorize the articles.