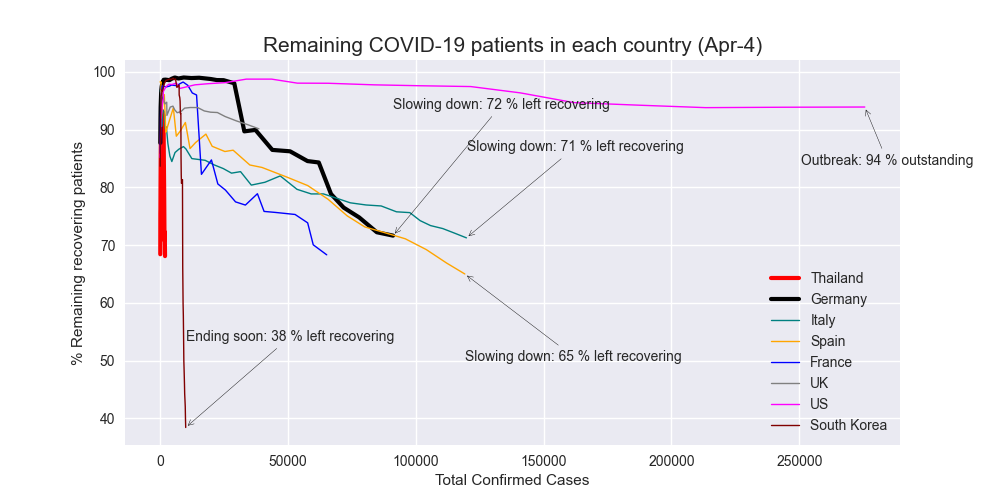
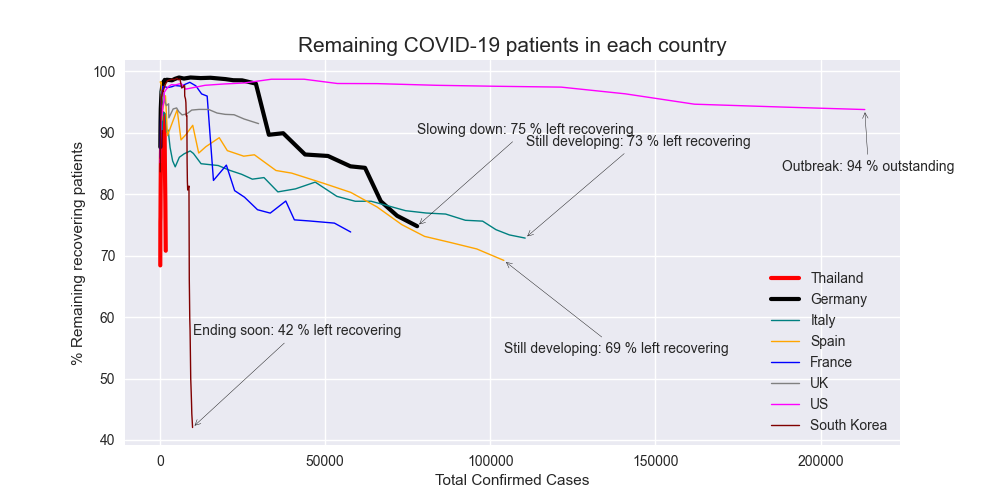
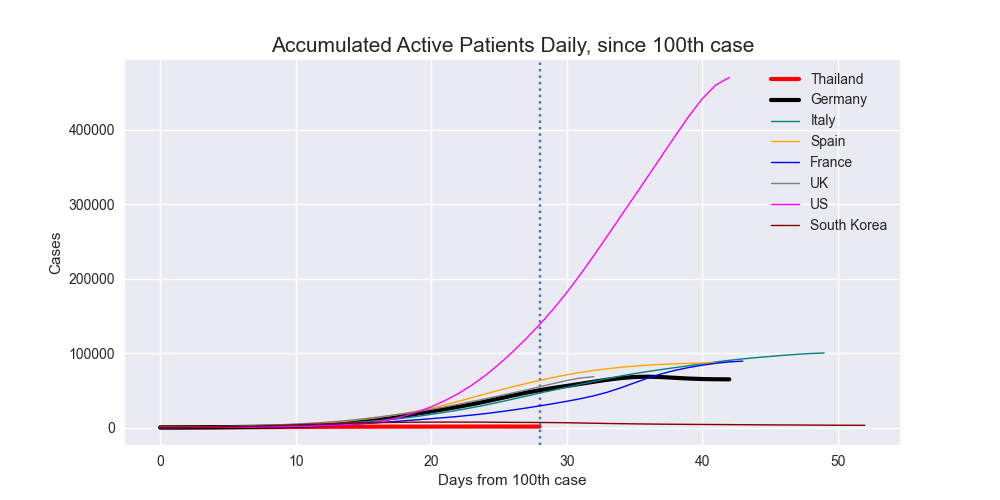
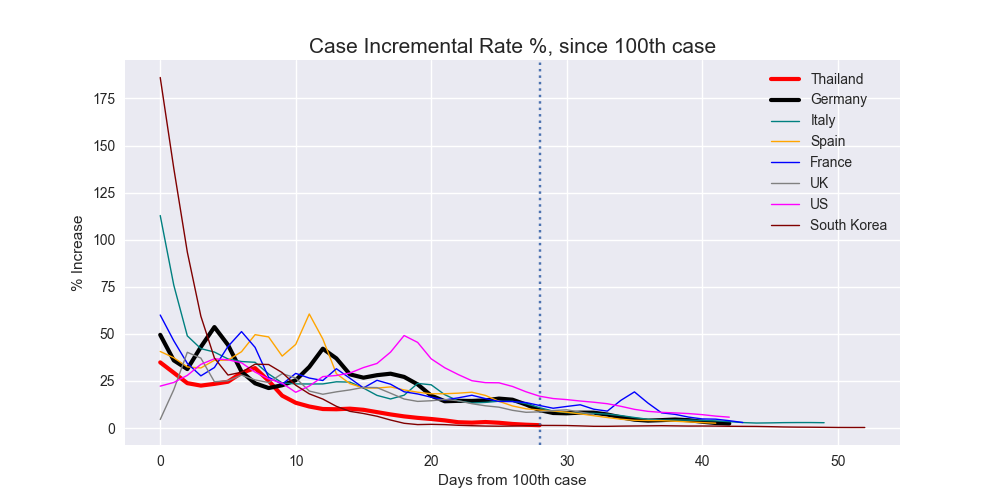
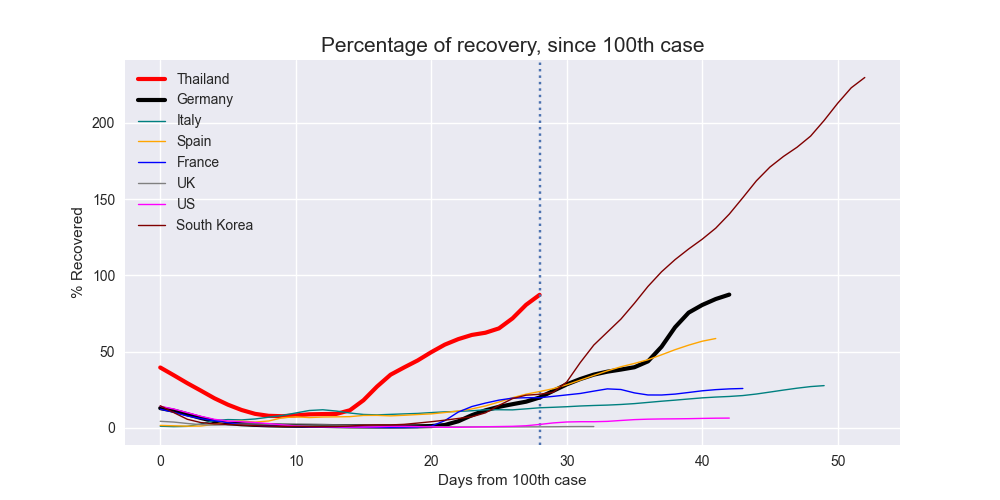
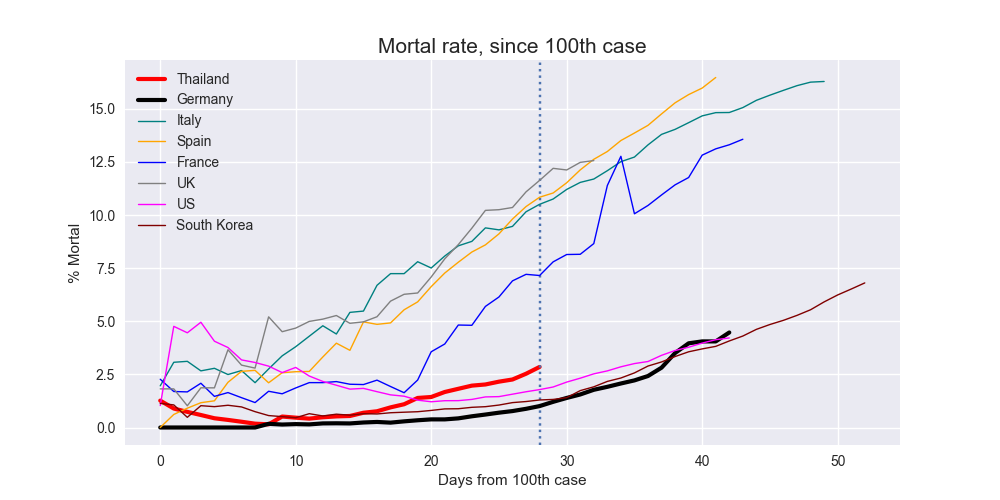
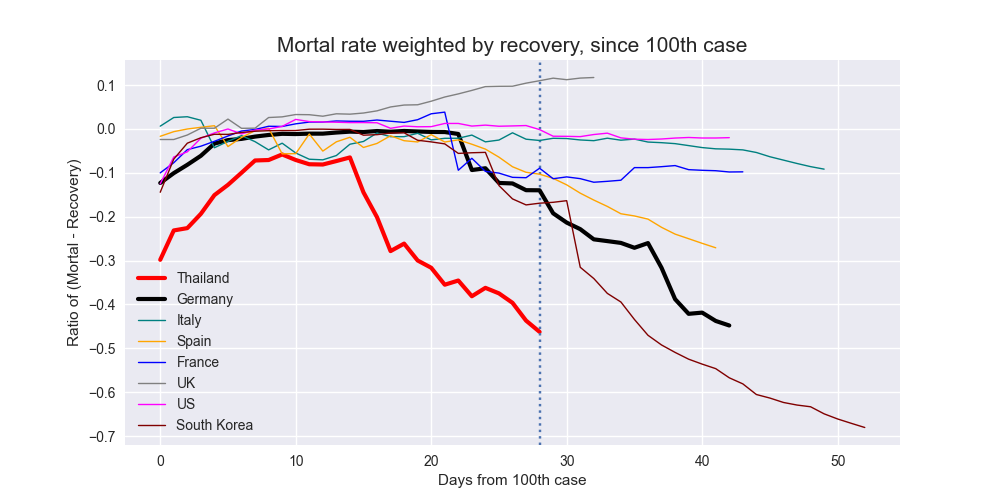
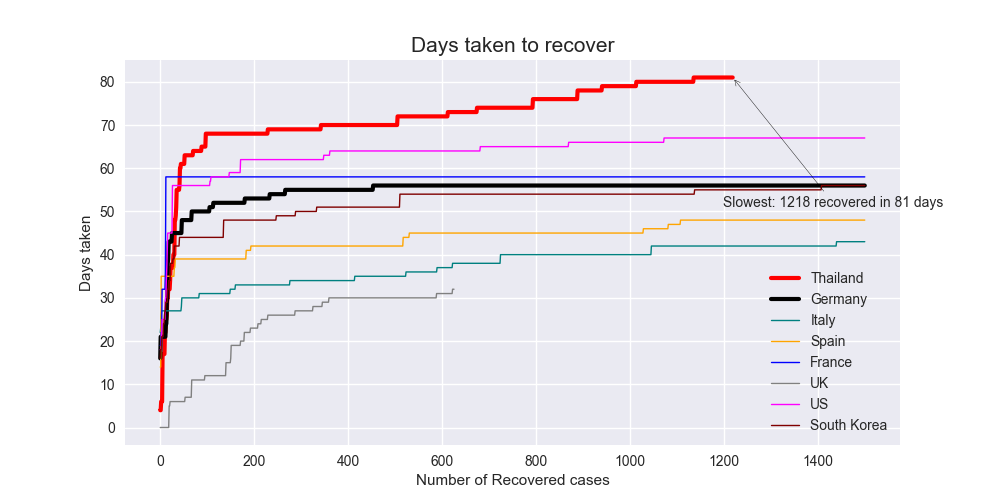
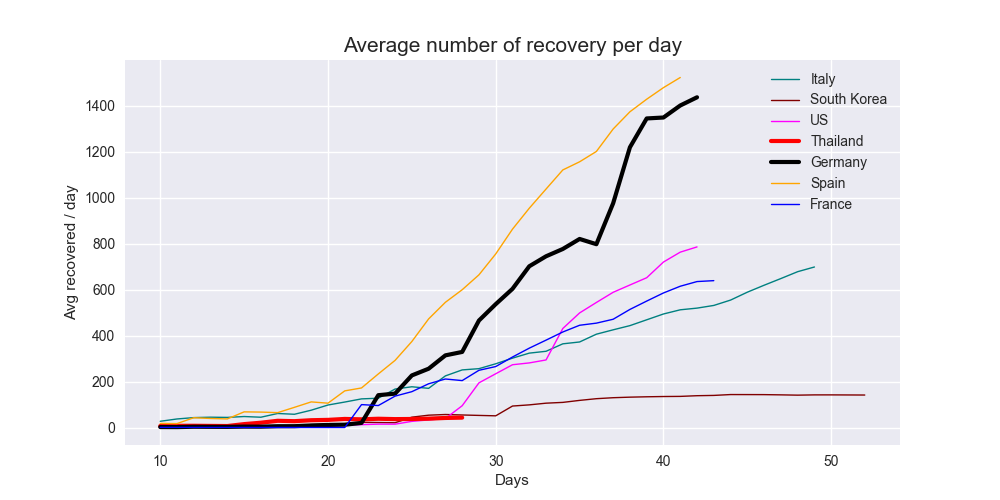
Based on daily report data (https://github.com/CSSEGISandData/COVID-19).
The project was originated as one of the 52-coding-challenges. I decided to spin it off here.
First of all, create a new virtual environment and install python packages by:
$ virtualenv covidenv
$ source covidenv/bin/activate
$ pip3 install -r requirements.txt
Clone the Covid-19 daily case data repo somewhere
$ git clone https://github.com/CSSEGISandData/COVID-19.gitMake sure you have the virtual env activated, then do following:
$ python3 -m covid19.plot {PATH_TO_COVID19_GIT_REPOPATH}For example:
$ python3 -m covid19.plot $HOME/3rd/COVID-19/The program will show several plots
MIT

