GanttLab
The easy to use, fully functional Gantt chart for GitLab and GitHub.
Use it now!
Simply head to https://app.ganttlab.com and pick your data source.
- GitLab user? Type-in your GitLab instance URL (defaults to https://gitlab.com), a Personal Access Token with the
apiscope and enjoy! - working with GitHub? Provide one of your GitHub user Personal access tokens with the
reposcope to get in!
Safe to run: GanttLab does NOT store any of your data on a server, and runs on YOUR browser only. It uses your own network, as if you were sending all the requests to your GitLab instance or to GitHub right from your local computer. Unsure of it? Have a look at the source code.
PRO tip: if you are running an unsecured HTTP instance of GitLab, head to http://app.ganttlab.com to avoid your browser blocking the request coming from an HTTPS secured site.
Interested in running GanttLab yourself? Head to the Download and Install documentation.
How it works
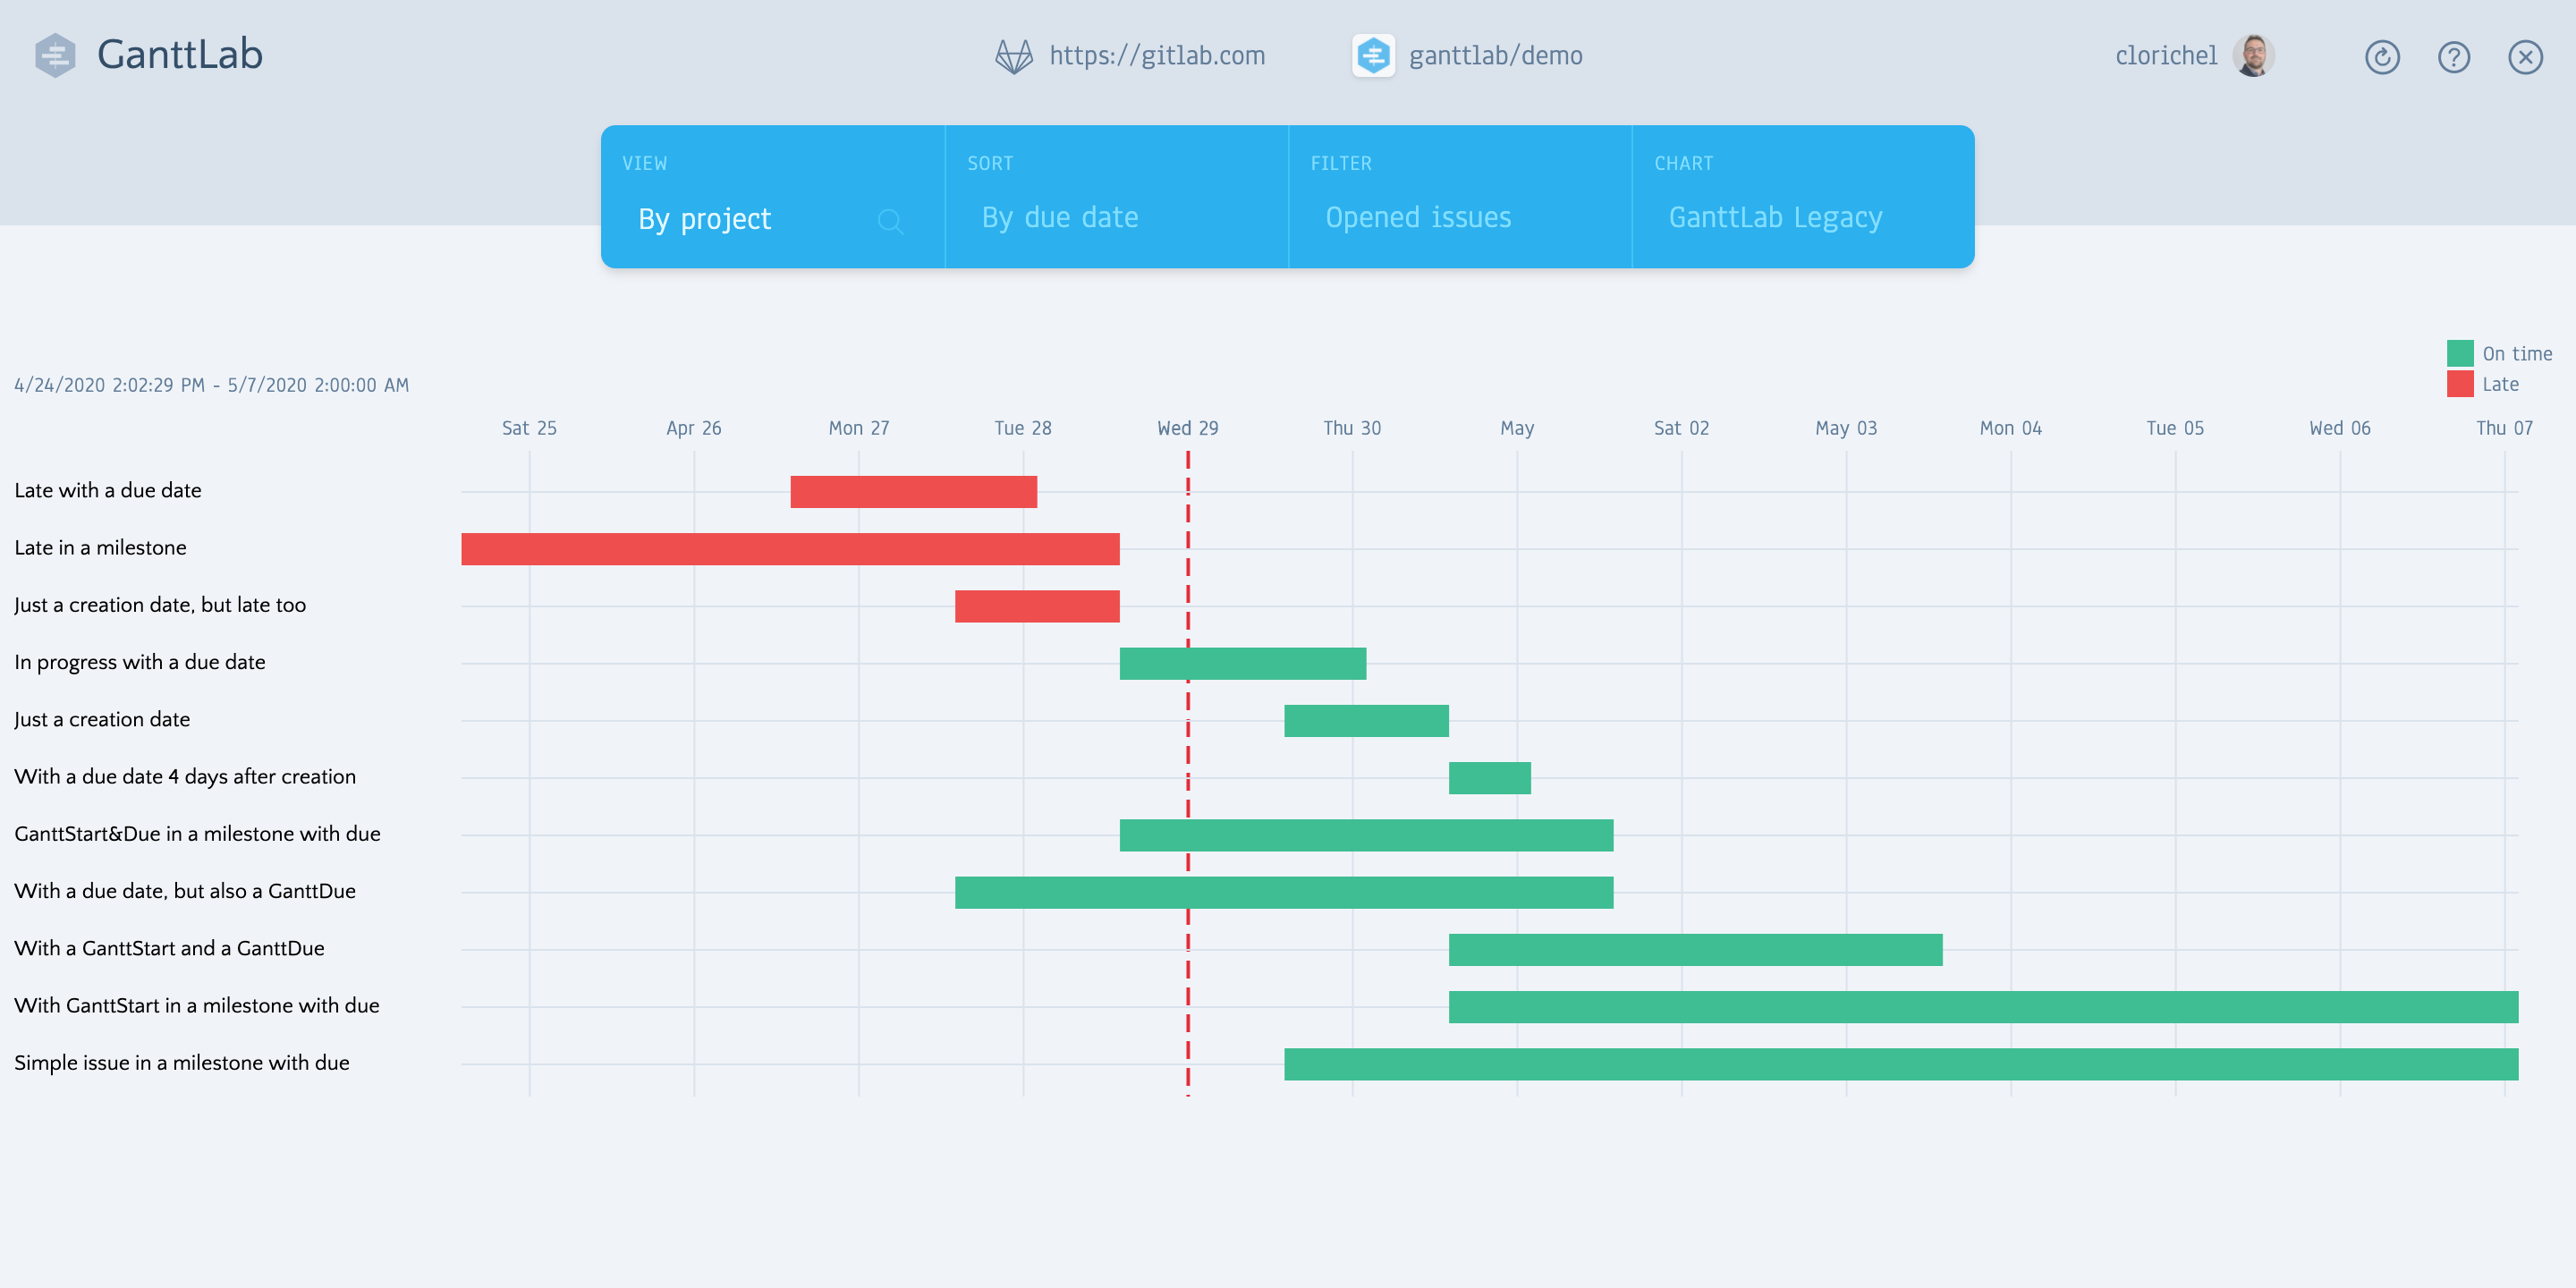
GanttLab is a frontend only application, built as a static website. It leverages GitLab API or GitHub API to read issues, before simply displaying a Gantt chart view from those issues. The automatically generated Gantt chart will display each issue within a "date area": from a start date to a due date. For a better user experience, there are pre-implemented rules to calculate those dates and ensure a default Gantt chart will be created without any further action:
| Each issue start date: | Each issue due date: |
|---|---|
1. is read from the GanttStart value in the issue description, |
1. is read from the GanttDue value in the issue description, |
| 2. (GitLab only) or fallbacks to the issue milestone start date, | 2. (GitLab only) or fallbacks to the issue due date, |
| 3. ultimately defaults to the issue creation date. | 3. (GitLab only) or to the issue milestone due date, |
| 4. ultimately defaults to the day after the issue start date, simulating all your issues have to be done in one day. |
You consequently have maximum control over your issues and tasks management in the Gantt chart right from your issue description with those two simple ISO 8601 YYYY-MM-DD calendar dates:
GanttStart: 2020-04-27
GanttDue: 2020-05-08
The GanttStart and GanttDue values must each be on one dedicated line of your issue description, and if found will be considered as the single source of truth to generate the Gantt chart.
PRO tip: the ISO 8601 format also covers times and timezones, and GanttLab will use the time information if provided (default to 12:00:00AM midnight UTC). Feel free to add down to the second based GanttStart and GanttDue like 2020-06-20T14:00:00+02:00 for UTC+2, 2020-05-15T04:00:00-04:00 in UTC-4 or 2020-04-27T04:00:00Z for UTC/GMT.
Only your opened issues are displayed. If an issue due date is past, the issue is marked late and colored red. If not, the issue is shown green as being on time.
Contributing
GanttLab is an open source project: your contribution is greatly appreciated! First make sure to have a look at the CONTRIBUTING guide.
Credits
The real list is quite long, but here are some key credits to people and tools that particularly helped make GanttLab what it is:
- Florian Roscheck for his awesome work on Visavail.js on top of D3.js
- The TypeScript community
- Evan You and the Vue.js community and ecosystem
- Adam Wathan and the Tailwind CSS community
- The GitLab Team & Community, and GitHub, Inc.
- Uncle Bob's inspirational Clean Architecture
License
The GanttLab application is distributed under the Apache License, Version 2.0. Please have a look at the dependencies licenses if you plan on using, building, or distributing this application.
