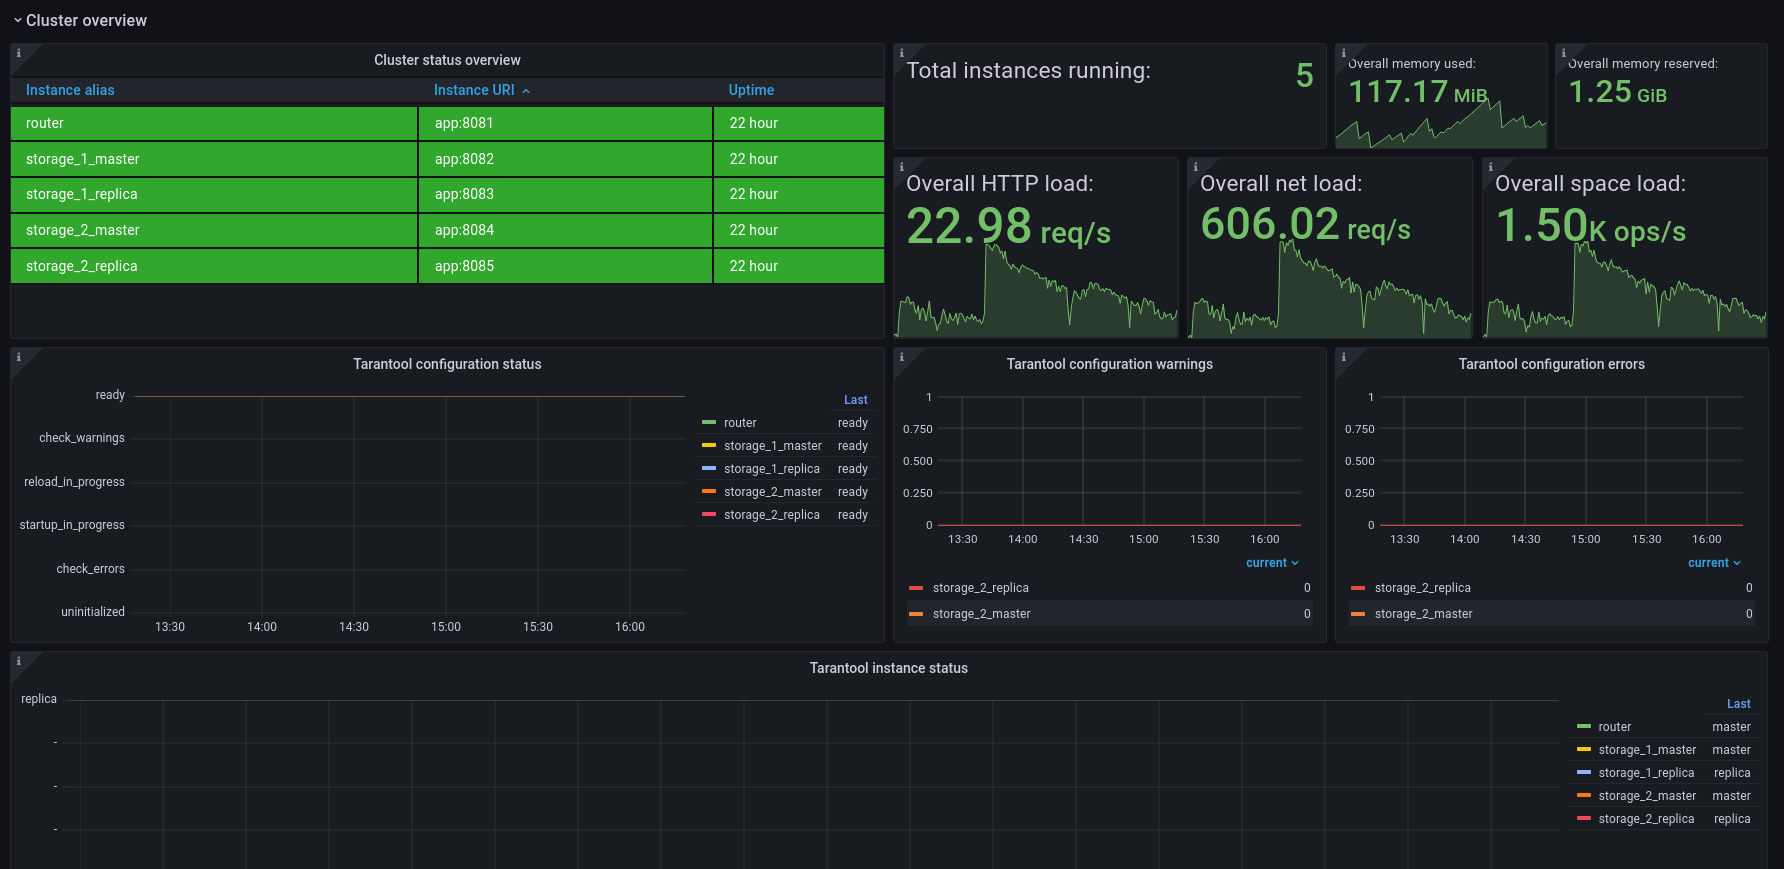
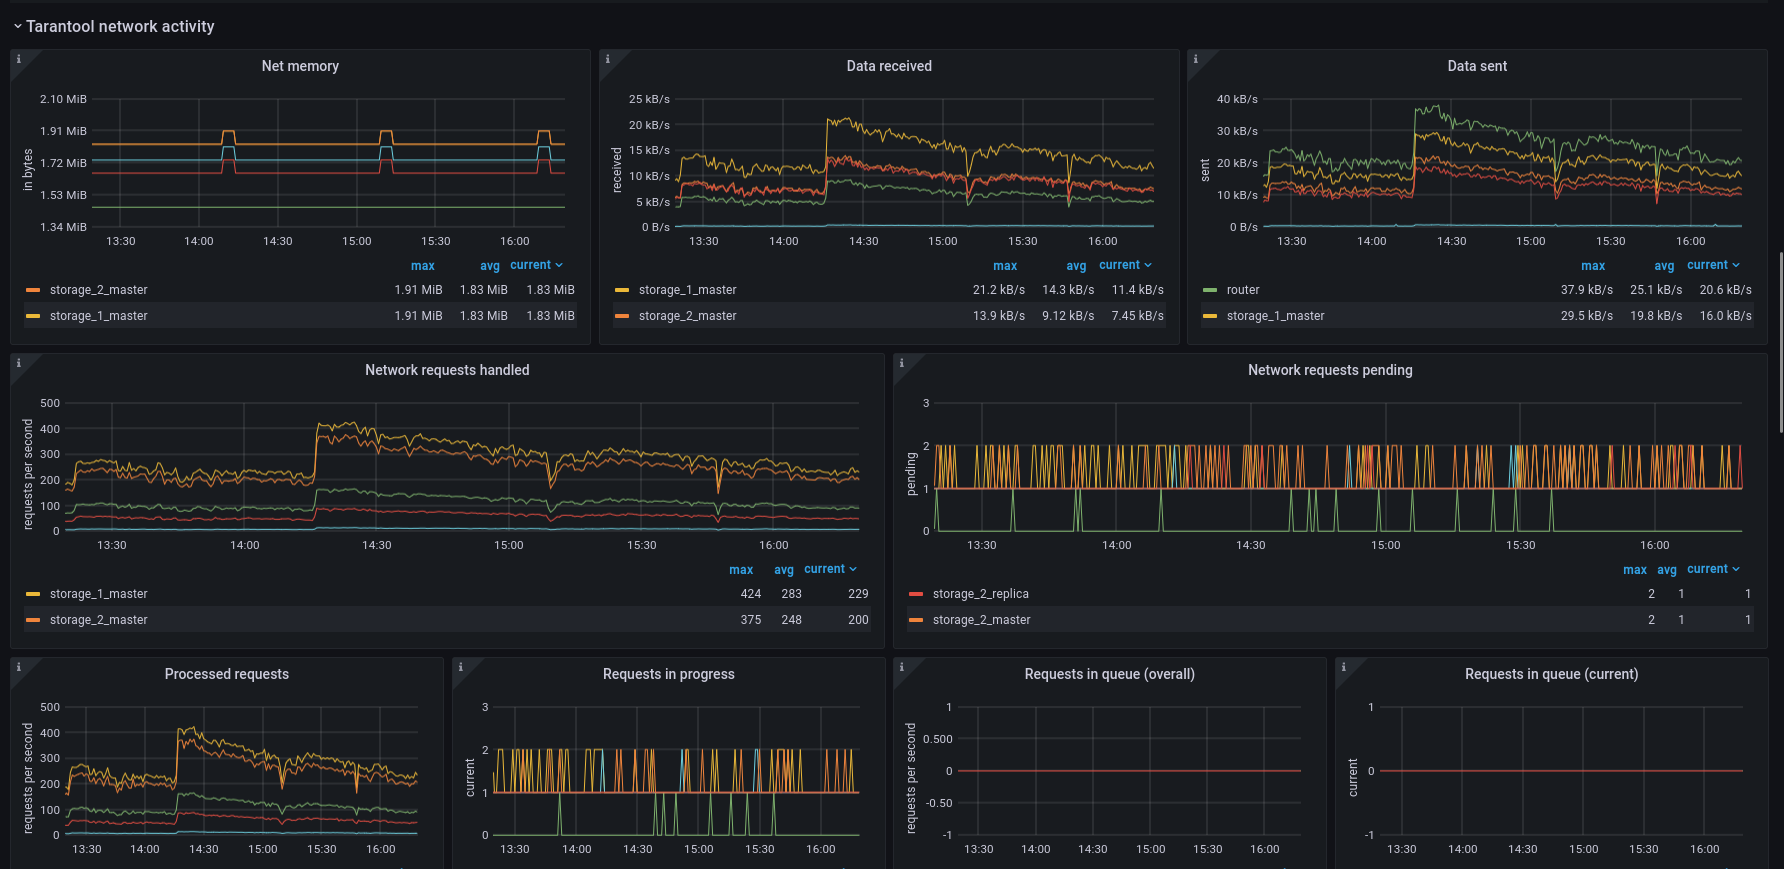
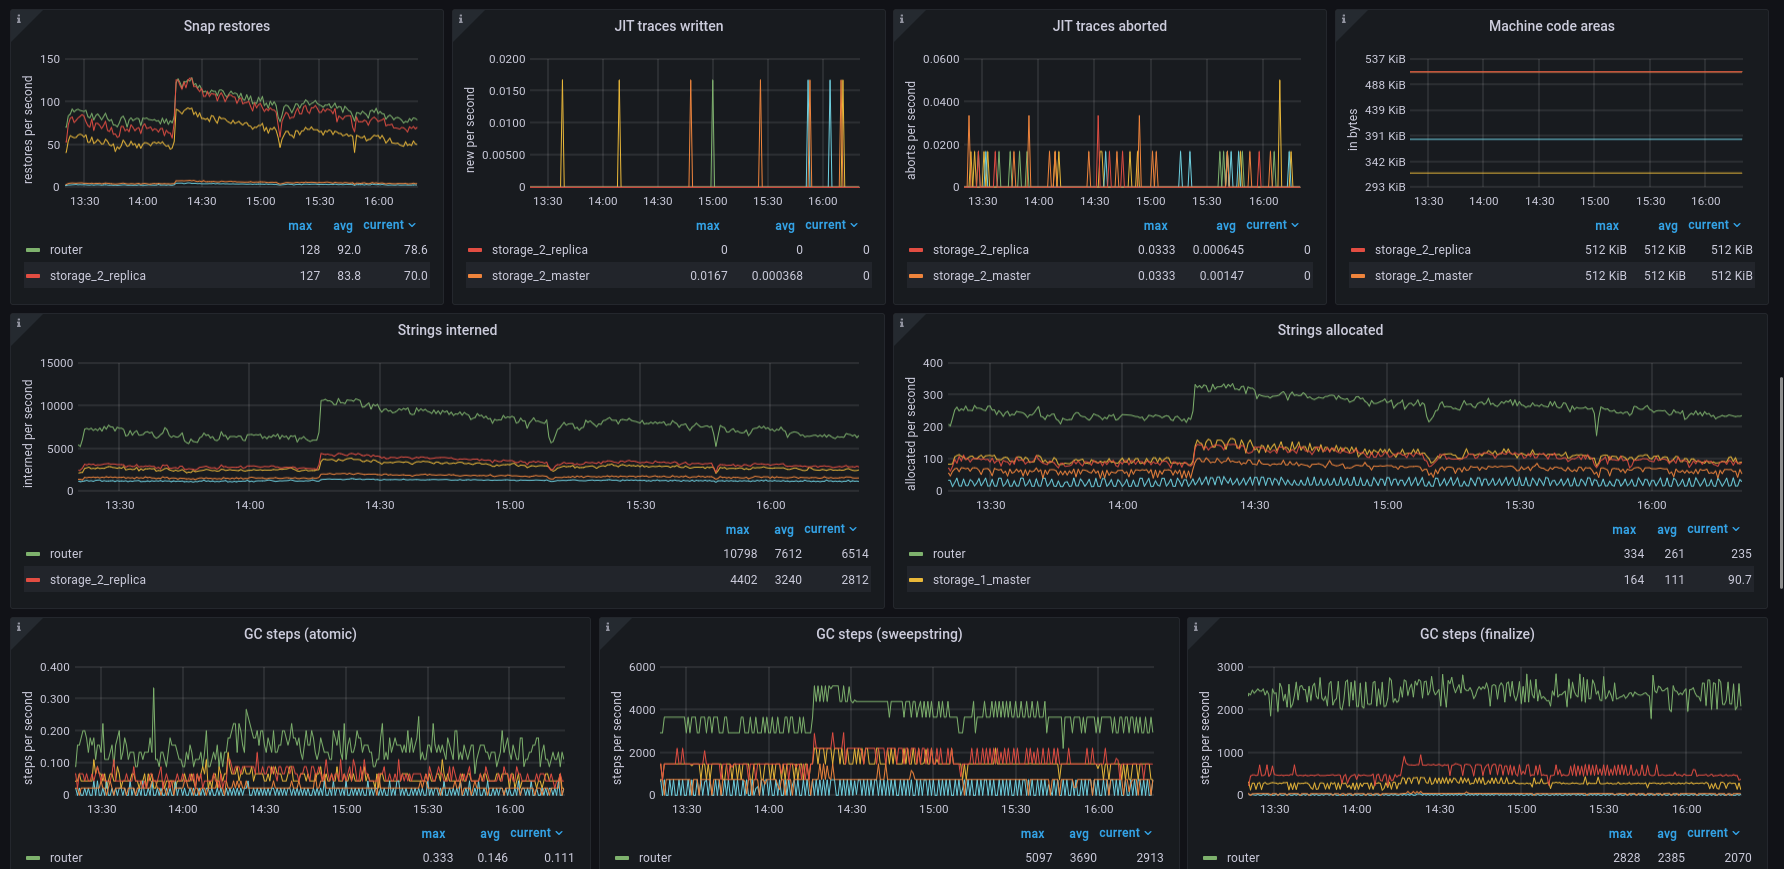
Dashboard for Tarantool application and database server monitoring, based on grafonnet library.
Our pages on Grafana Official & community built dashboards:
- Tarantool 3:
- Tarantool Cartridge and 1.10—2.x:
- Tarantool Data Grid 2:
Refer to dashboard documentation page for prerequirements and installation guide.
-
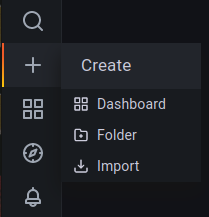
Open Grafana import menu.
-
To import a specific dashboard, choose one of the following options:
- paste the dashboard id (for example,
21474for Prometheus Tarantool 3 dashboard), or - paste a link to the dashboard (for example, https://grafana.com/grafana/dashboards/21474 for Prometheus Tarantool 3 dashboard), or
- paste the dashboard JSON file contents, or
- upload the dashboard JSON file.
- paste the dashboard id (for example,
-
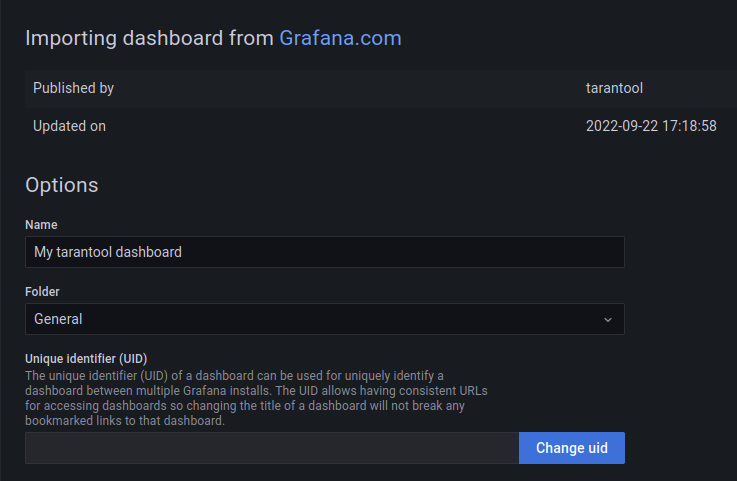
Set dashboard name, folder and uid (if needed).
-
Choose datasource and datasource variables on the dashboard.
For guide on setting up your monitoring stack refer to documentation page.
This repository provides preconfigured monitoring cluster with example Tarantool app and load generatior for local dashboard development and tests.
docker compose up -dwill start 6 containers: Tarantool App, Tarantool Load Generator, Telegraf, InfluxDB, Prometheus and Grafana, which build cluster with two fully operational metrics datasources (InfluxDB and Prometheus), extracting metrics from Tarantool App example project. We recommend using the exact versions we use in experimental cluster (e.g. Grafana v8.1.5). After start, Grafana UI will be available at localhost:3000. You can also interact with Prometheus at localhost:9090 and InfluxDB at localhost:8086.
If you want to monitor Tarantool cluster deployed on your local host, you can use monitoring cluster similar to example app one.
Configure Telegraf/Prometheus to monitor your own app in example_cluster/telegraf/telegraf.localapp.conf and example_cluster/prometheus/prometheus.localapp.yml.
Use host.docker.internal as your machine host in configuration and set cluster instances ports as targets and correct metrics HTTP path.
See more setup tips in documentation.
Start cluster with
docker compose -f docker-compose.localapp.yml -p localapp-monitoring up -dAfter start, Grafana UI will be available at localhost:3000. You can also interact with Prometheus at localhost:9090 and InfluxDB at localhost:8086.
go v.1.14 or greater is required to install build and test dependencies.
Run
make build-depsto install dependencies that are required to build dashboards.
Run
make test-depsto install build dependencies and dependencies that are required to run tests locally.
To build a custom dashboard, run make build command with your specific configuration.
make CONFIG=config.yml OUTPUT=mydashboard.json buildSee repository example config config.yml for detailed info about supported options.
You can run tests with
make run-testsCompiled dashboard test files can be updated with
make update-testsIt also formats all source files with jsonnetfmt.
If you're interested in building grafonnet dashboards or custom panels, I suggest you to start with reading our grafonnet tutorial: in English, in Russian.
You can add your own custom panels to the bottom of the template dashboard.
-
Add tarantool/grafana-dashboard as a dependency in your project with jsonnet-bundler. Run
jb init
to initialize jsonnet-bundler and add this repo to
jsonnetfile.jsonas a dependency:{ "version": 1, "dependencies": [ { "source": { "git": { "remote": "https://github.com/tarantool/grafana-dashboard" } }, "version": "master" } ], "legacyImports": true }Run
jb install
to install dependencies.
grafonnetlibrary will also be installed as a transitive dependency. -
Load a configuration, same as in "Manual build" section. (You can build it as a dictionary in code instead of parsing a YAML file.)
# my_dashboard.jsonnet
local config = import 'grafana-dashboard/dashboard/build/config.libsonnet';
local raw_cfg = importstr 'config.yml';

local cfg = config.prepare(std.parseYaml(raw_cfg));
-
Import the main template.
# my_dashboard.jsonnet
local dashboard = import 'grafana-dashboard/dashboard/build/dashboard.libsonnet';
-
To add your custom panels to a dashboard template, you must create panel objects.
A row panel can be created by using the following script:
# my_dashboard.jsonnet
local common = import 'grafana-dashboard/dashboard/panels/common.libsonnet';

local my_row = common_panels.row('My custom metrics')
Panel with metrics data consists of a visualisation base (graph, table, stat etc.) and one or several datasource queries called "targets". To build a simple visualization graph, you may use
common.default_graphutil.# vendor/grafana-dashboard/dashboard/panels/common.libsonnet default_graph( # graph panel shortcut cfg, # Dashboard configuration title, # The title of the graph panel description, # (optional) The description of the panel format, # (default 'none') Unit of the Y axes min, # (optional) Min of the Y axes max, # (optional) Max of the Y axes labelY1, # (optional) Label of the left Y axis decimals, # (default null) Override automatic decimal precision for legend and tooltip decimalsY1, # (default null) Override automatic decimal precision for the left Y axis legend_avg, # (default true) Show average in legend legend_max, # (default true) Show max in legend panel_height, # (default 8) Panel heigth in grid units panel_width, # (default 8) Panel width in grid units, max is 24 )
Panel size is set with grid units. Grafana uses square-type grid where dashboard width is 24 units. For example, row size is 24 x 1 units and Grafana new panel size is 12 x 9 units.
If you want to build non-graph panel or a graph panel with more complicated configuration, use
grafonnettemplates. You must set a size of each panel before adding it to our dashboard template. For eachgrafonnetpanel, add{ gridPos: { w: width, h: height } }to it. For example,local grafana = import 'grafonnet/grafana.libsonnet'; local my_graph = grafana.graphPanel.new( title='My custom panel', points=true, ) { gridPos: { w: 6, h: 4 } };
To build a target, you should use
commonutils.# vendor/grafana-dashboard/dashboard/panels/common.libsonnet target( # plain "select metric" shortcut cfg, # Dashboard configuration metric_name, # Target metric name to select additional_filters, # (optional) Query additional filter conditions. The structure is{ prometheus: filters, influxdb: filters }, filters have the same format as in cfg legend, # (optional) Target result legend. The structure is{ prometheus: legend_str, influxdb: legend_str } group_tags, # (InfluxDB only, optional). Target result group rules. All tags used in legend are expected to be here too converter, # (InfluxDB only, default 'mean') InfluxDB metrics converter (aggregation, selector, etc.) rate, # (default false) Whether to transform the metrics as rate ),
To build more compound targets, use
grafonnetlibraryprometheusandinfluxdbtemplates.To add a target to a panel, call
addTarget(target).To summarise, you can build a simple 'select metric' panel with
local common = import 'grafana-dashboard/dashboard/panels/common.libsonnet';
local variable = import 'grafana-dashboard/dashboard/variable.libsonnet';

local my_custom_component_memory_graph = common.default_graph(
  cfg,
  title='My custom component memory',
  description=|||
    My custom component used memory.
    Shows mean value.
  |||,
  format='bytes',
  panel_width=12,
  panel_height=6,
).addTarget(common.target(cfg, 'my_component_memory'))
and a simple rps panel with
local common = import 'grafana-dashboard/dashboard/panels/common.libsonnet';
local variable = import 'grafana-dashboard/dashboard/variable.libsonnet';

local my_custom_component_rps_graph = common.default_graph(
  cfg,
  title='My custom component load',
  description=|||
    My custom component processes requests
    and collects info on process to summary collector
    'my_component_load_metric'.
  |||,
  labelY1='requests per second',
  panel_width=18,
  panel_height=6,
).addTarget(common.target(cfg, my_component_load_metric_count', rate=true))
For more panel tips and examples, please examine this template dashboard source code and test cases.
To add your custom panels, call
addPanel(panel)oraddPanels(panel_array)in dashboard template:# my_dashboard.jsonnet local dashboard = import 'grafana-dashboard/dashboard/build/dashboard.libsonnet'; ... local my_dashboard_template = dashboard.addPanels([ my_row, my_custom_component_memory_graph, my_custom_component_rps_graph ]);
Finally, call
build()to compute panels positions and build a resulting dashboard:# my_dashboard.jsonnet ... my_dashboard_template.build()Do not use
;in the end of your script so resulting dashboard will be returned as output. -
To save resulting dashboard into
output.jsonfile, usejsonnet -J ./vendor/ my_dashboard.jsonnet -o ./output.json
and to save output into clipboard, use
jsonnet -J ./vendor/ my_dashboard.jsonnet -o ./output.json | xclip -selection clipboard
If you have questions, please ask it on StackOverflow or contact us in Telegram:
