Clustering is a popular approach to detect patterns in unlabeled data. Existing clustering methods typically treat samples in a dataset as points in a metric space and compute distances to group together similar points. Visual Clustering is a different way of clustering points in 2-dimensional space, inspired by how humans "visually" cluster data. The algorithm is based on trained neural networks that perform instance segmentation on plotted data.
For more details, see the accompanying paper: "Clustering Plotted Data by Image Segmentation", 2022 IEEE/CVF Conference on Computer Vision and Pattern Recognition (CVPR), and please use the citation below.
@article{naous2021clustering,
  title={Clustering Plotted Data by Image Segmentation},
  author={Naous, Tarek and Sarkar, Srinjay and Abid, Abubakar and Zou, James},
  journal={2022 IEEE/CVF Conference on Computer Vision and Pattern Recognition (CVPR)},
  year={2022}
}
pip install visual-clusteringThe algorithm can be used the same way as the classical clustering algorithms in scikit-learn:
You first import the class VisualClustering and create an instance of it.
from visual_clustering import VisualClustering

model = VisualClustering(median_filter_size = 1, max_filter_size= 1)
The parameters median_filter_size and max_filter_size are set to 1 by default.
You can experiment with different values to see what works best for your dataset !
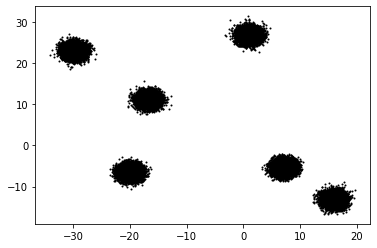
Let's create a simple synthetic dataset of blobs.
from sklearn import datasets

data = datasets.make_blobs(n_samples=50000, centers=6, random_state=23,center_box=(-30, 30))
plt.scatter(data[0][:, 0], data[0][:, 1], s=1, c='black')
To cluster the dataset, use the fit function of the model:
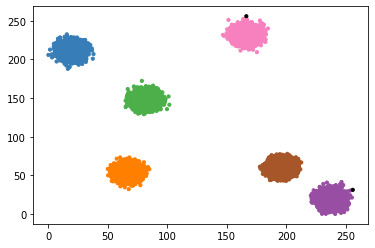
predictions = model.fit(data[0])You can visualize the results using matplotlib as you would normally do with classical clustering algorithms:
import matplotlib.pyplot as plt
from itertools import cycle, islice
import numpy as np

colors = np.array(list(islice(cycle(["#000000", '#377eb8', '#ff7f00', '#4daf4a', '#f781bf', '#a65628', '#984ea3']), int(max(predictions) + 1))))
#Black color for outliers (if any)
colors = np.append(colors, ["#000000"])
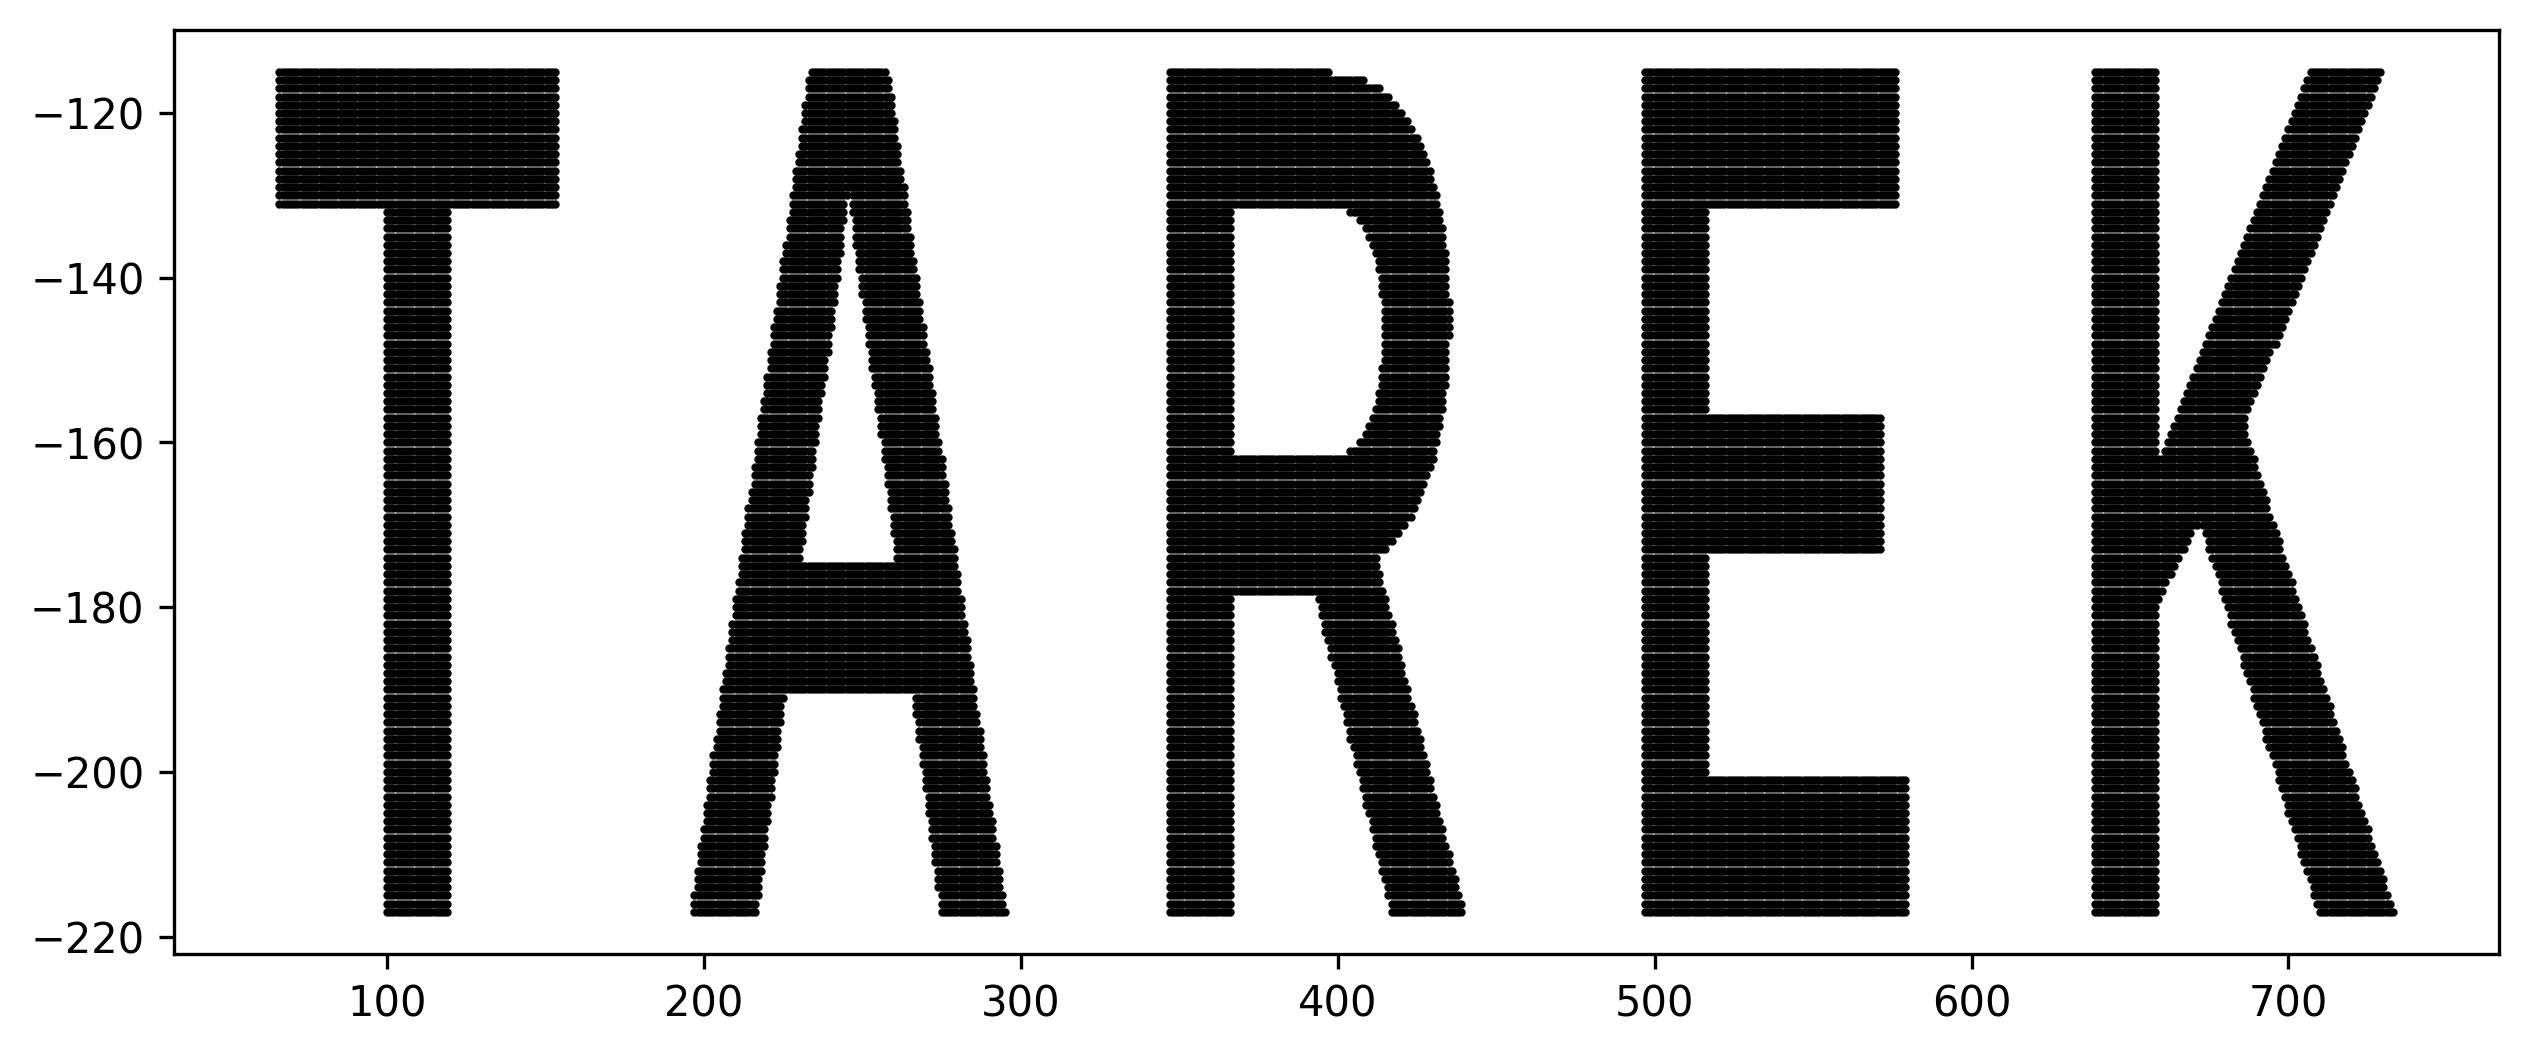
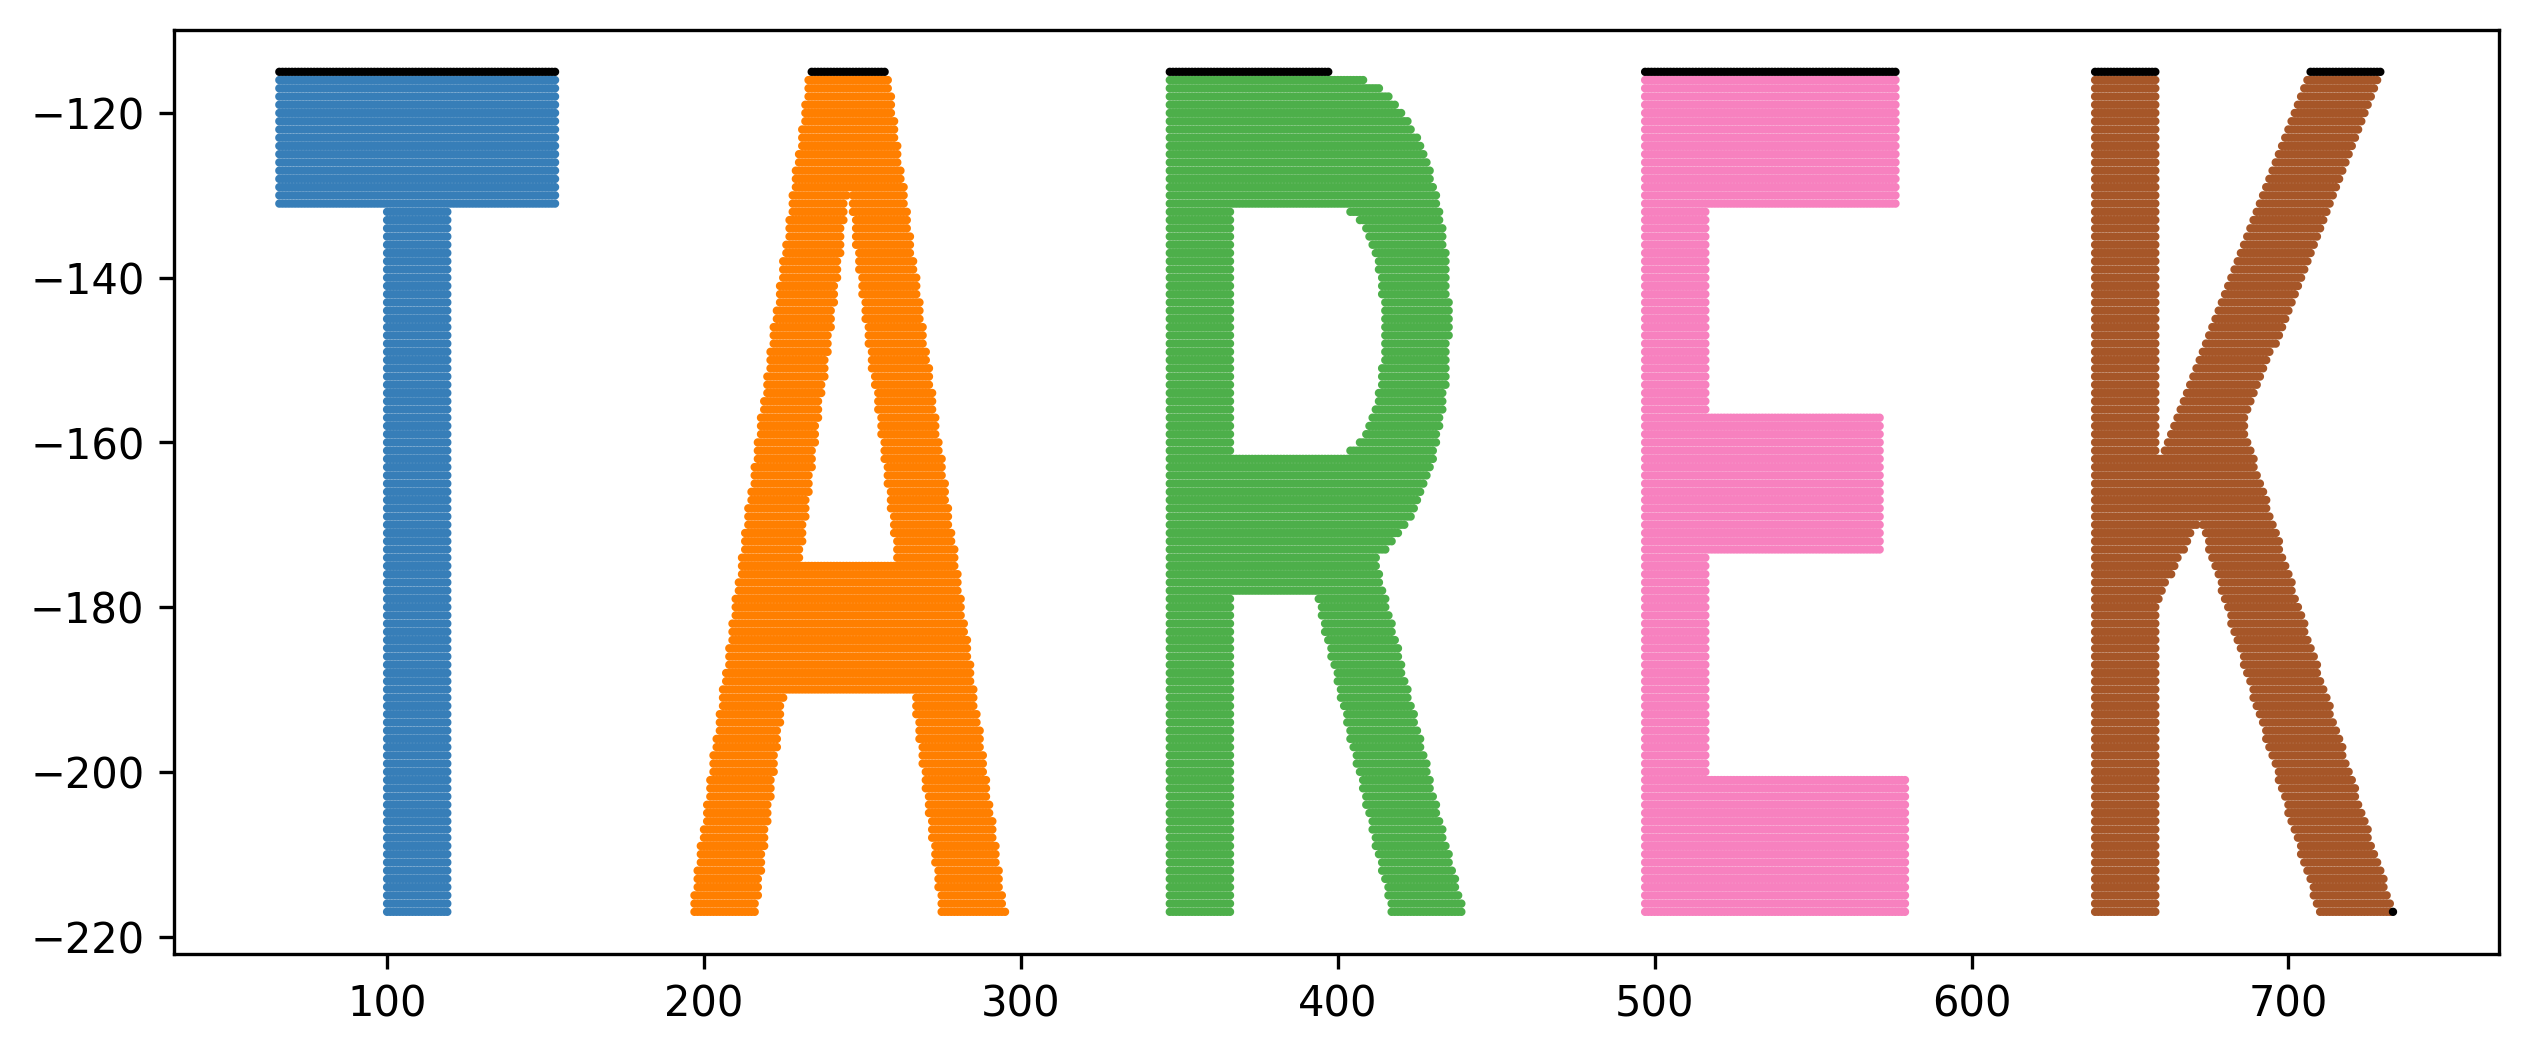
plt.scatter(data[0][:, 0], data[0][:, 1], s=10, color=colors[predictions.astype('int8')])Run Visual Clustering inside a colab notebook to cluster your own name!
https://colab.research.google.com/drive/1DcZXhKnUpz1GDoGaJmpS6VVNXVuaRmE5?usp=sharing
Name Plot:
Name clustered via Visual Clustering:
Make sure that you have the following libraries installed:
transformers 4.15.0
scipy 1.4.1
tensorflow 2.7.0
keras 2.7.0
numpy 1.19.5
cv2 4.1.2
skimage 0.18.3
Tarek Naous: Scholar | Github | Linkedin | Research Gate | Personal Wesbite | tareknaous@gmail.com


