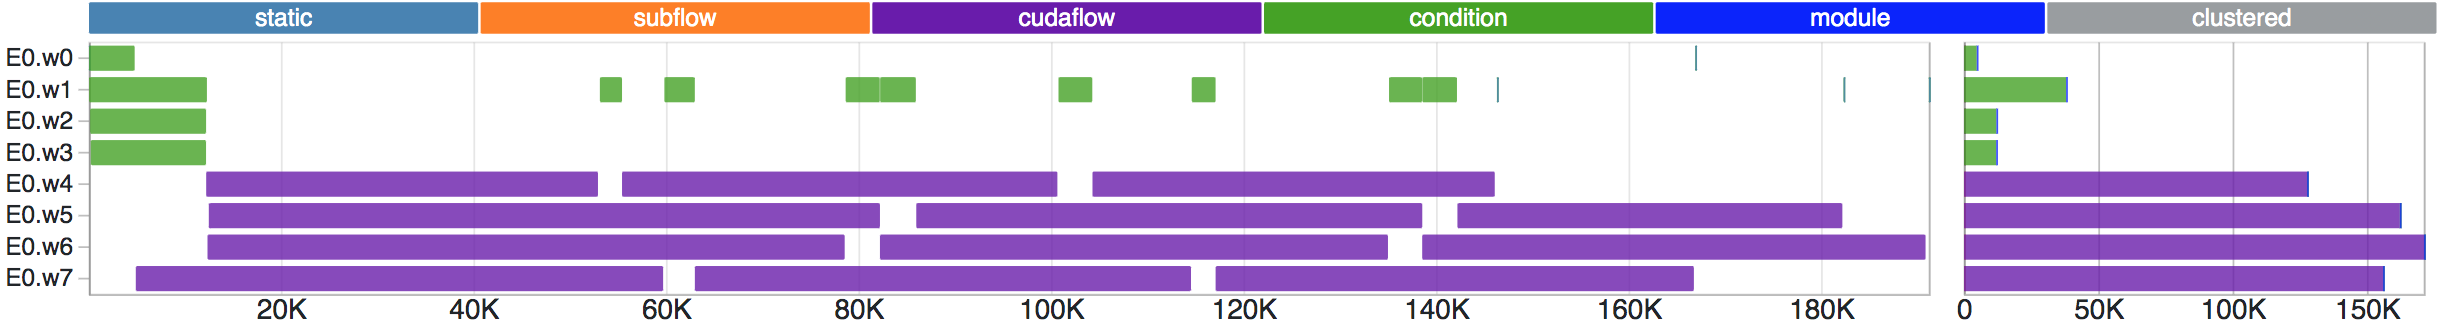
TFProf provides the visualization and tooling needed for profiling Taskflow programs
All taskflow programs come with a lightweight profiling module
to observe worker activities in every executor.
To enable the profiler, set the environment variable TF_ENABLE_PROFILER
to a file name in which the profiling result will be stored.
~$ TF_ENABLE_PROFILER=result.json ./path/to/my/taskflow/program arg1 arg2
~$ cat result.json
[ ... JSON data ]
Paste the content of result.json to the bottom JSON text area at the following page:
You may also open index.html from your browser to visualize tfprof data.
Please visit the page Profile Taskflow Programs.