Fio-plot generates charts from FIO benchmark data. It can process FIO output in JSON format. It can also process FIO log file output (in CSV format).
This kind of chart shows both IOPs and Latency for multiple queue depths.
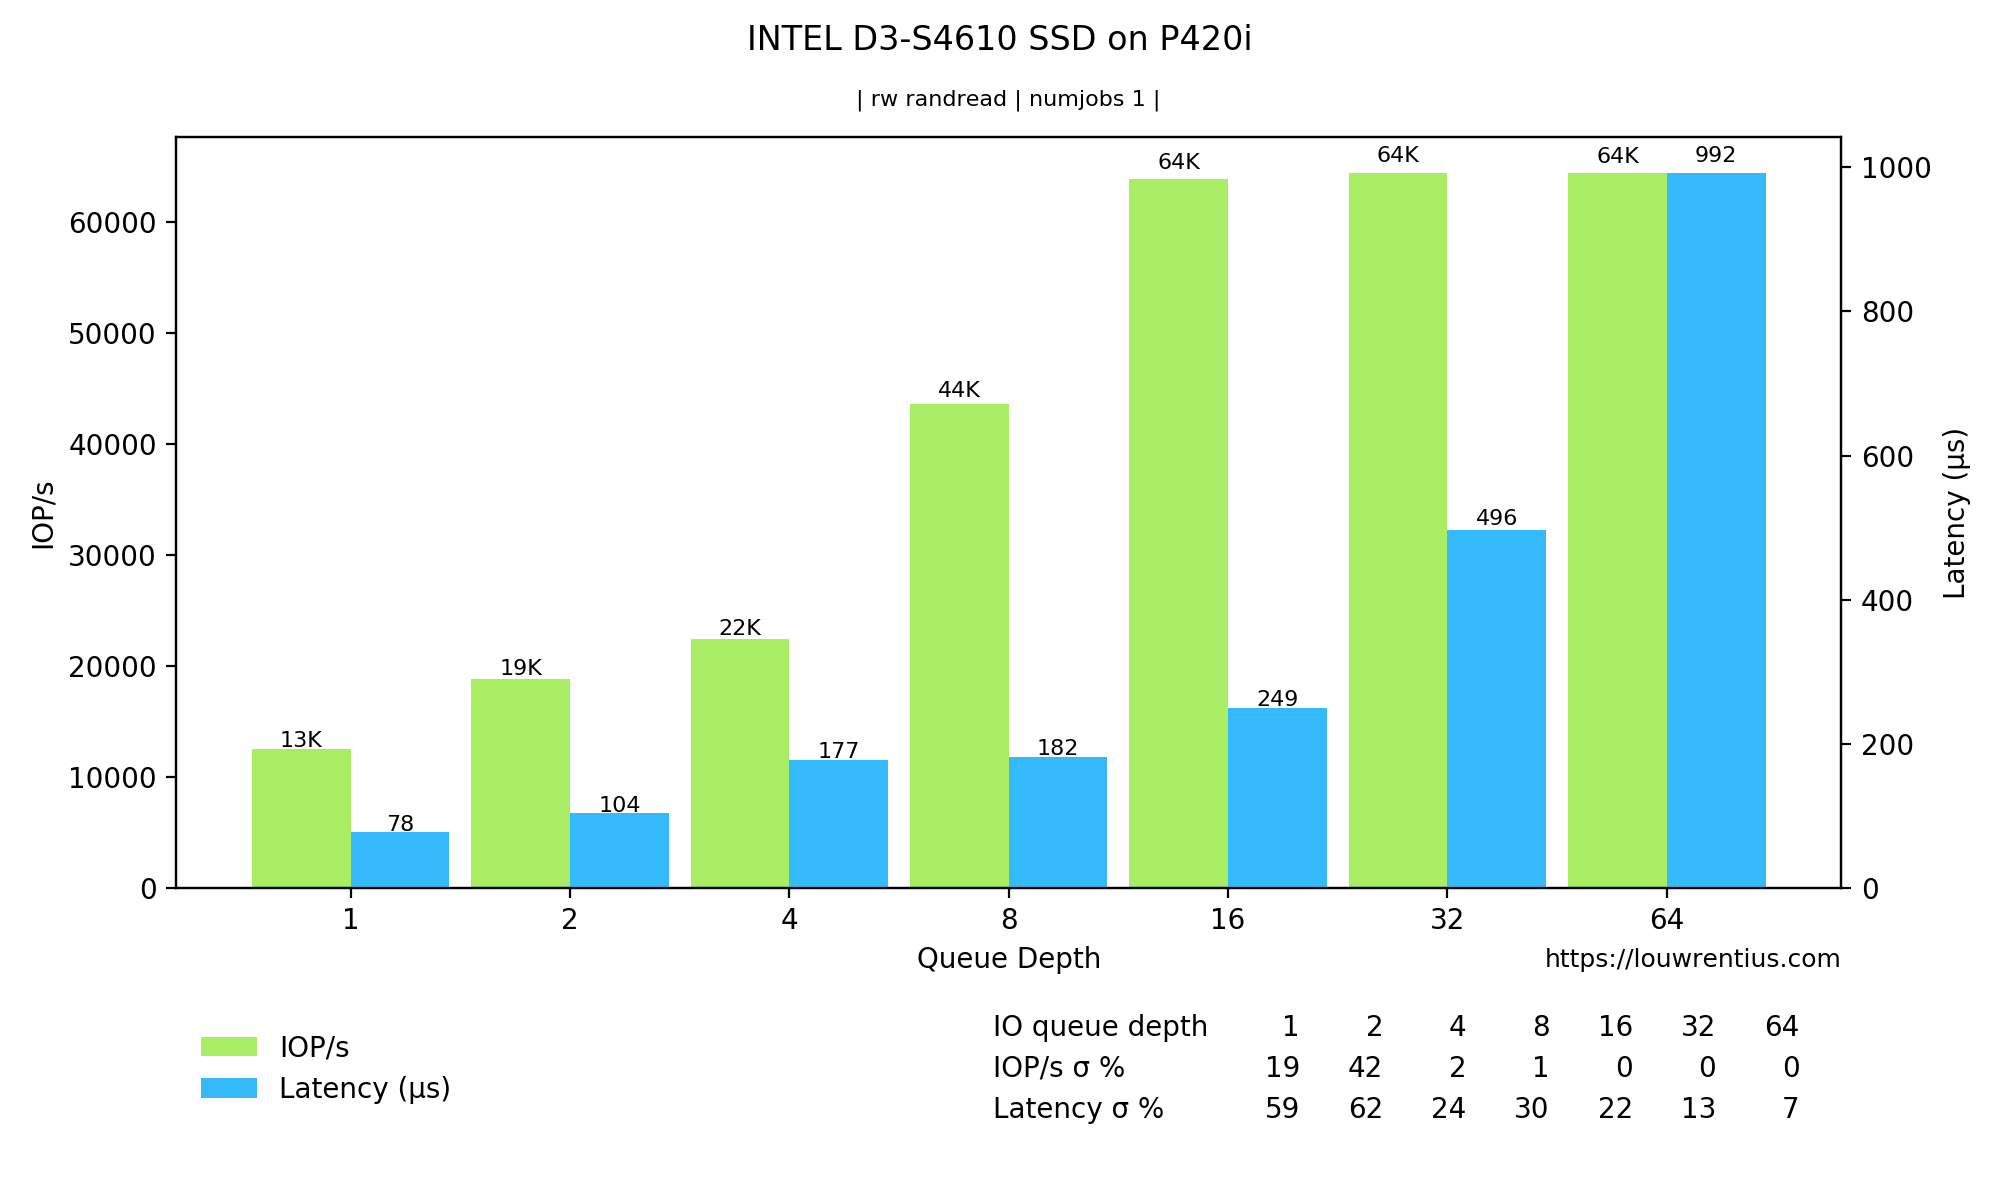
Please note that these benchmark numbers are not representative of the capabilities of the SSD as the RAID controller is the bottleneck.
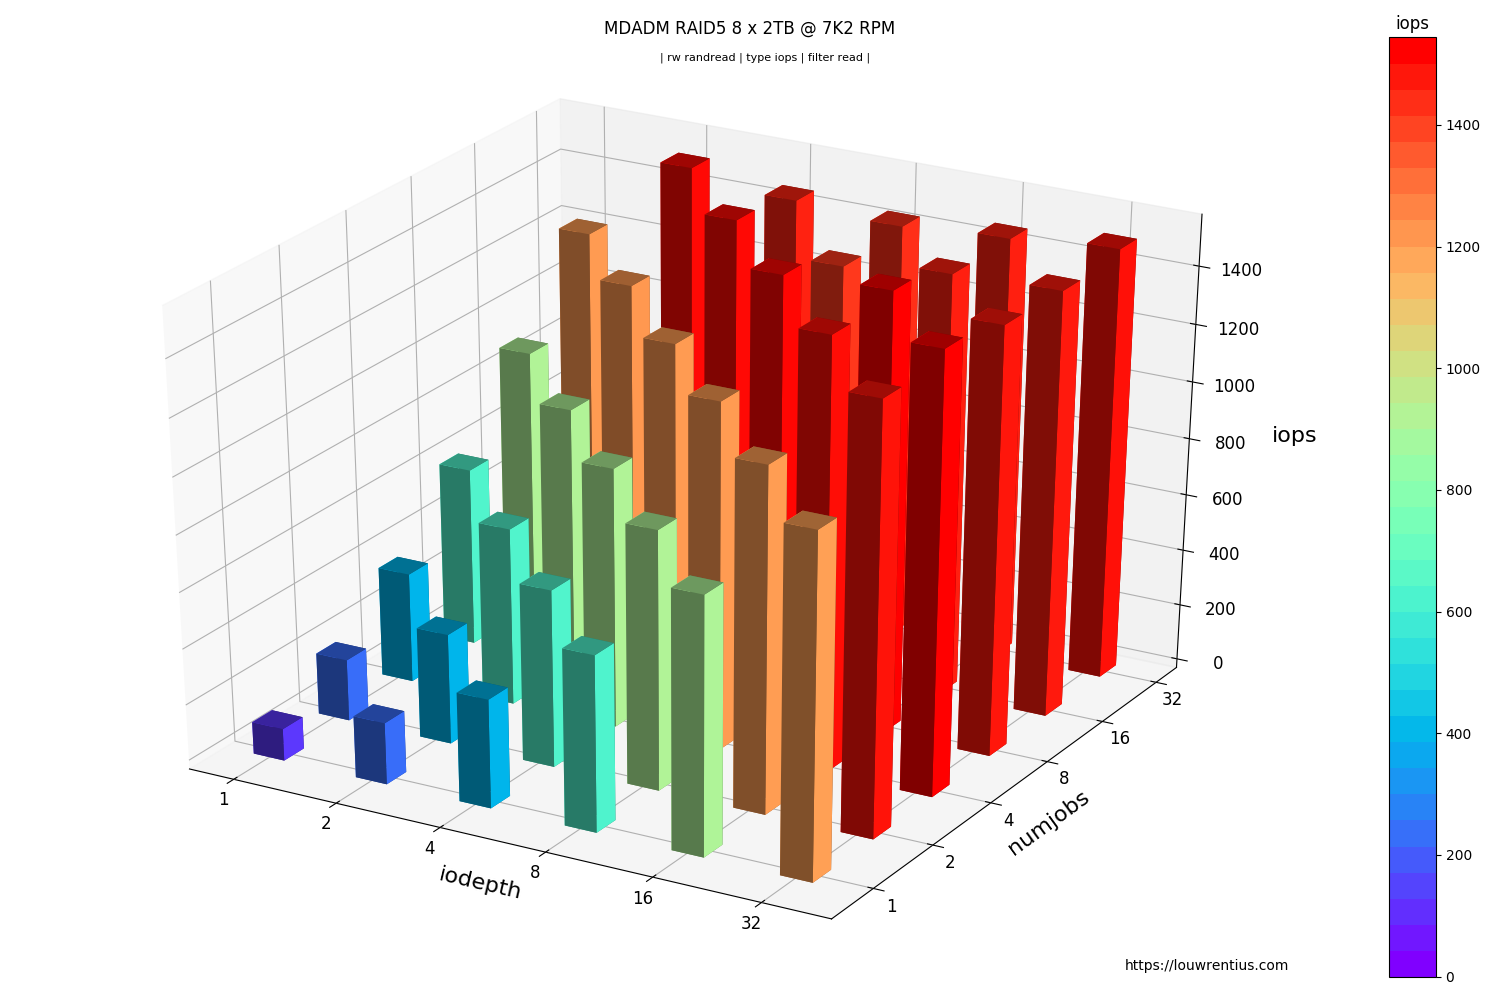
A 3D bar chart that plots both queue depth an numjobs against either latency or IOPs.
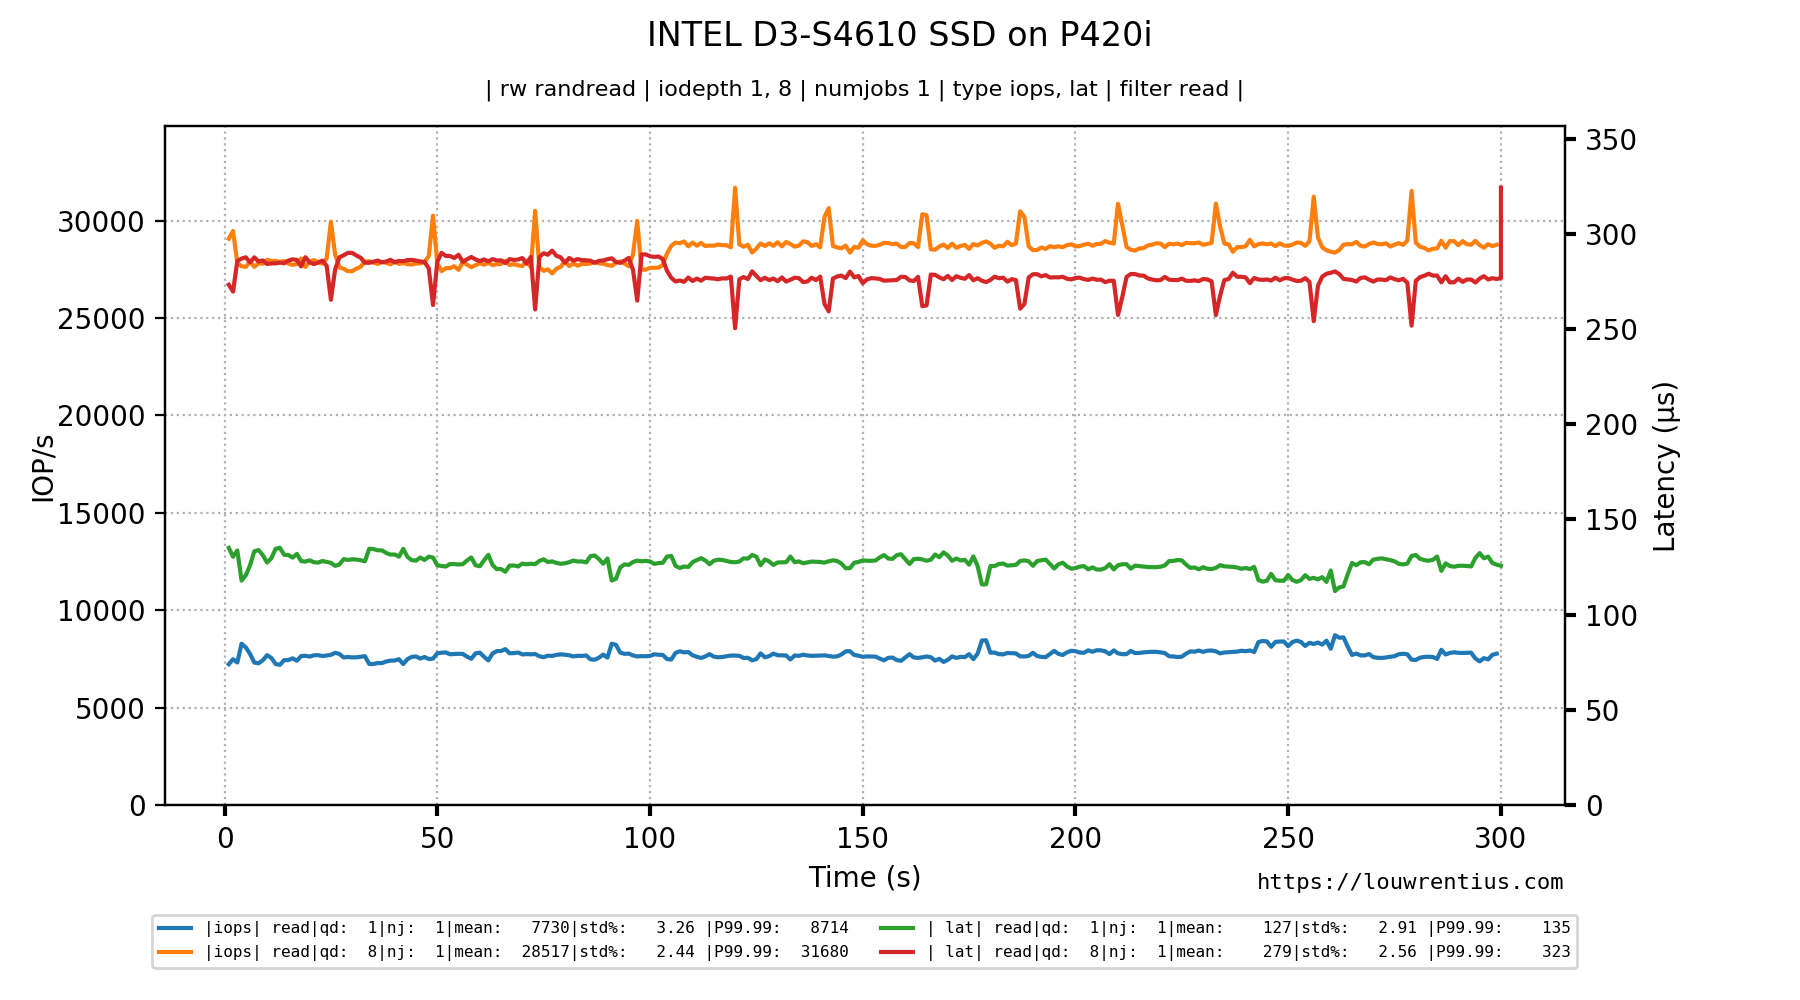
To create this graph, the FIO log data is parsed to show how the device / file
performed during a benchmark run. Latency IOPS and bandwidth can be shown.

The command line options control which data is shown, so it is possible to customize the graph to only show the information you're interested in.
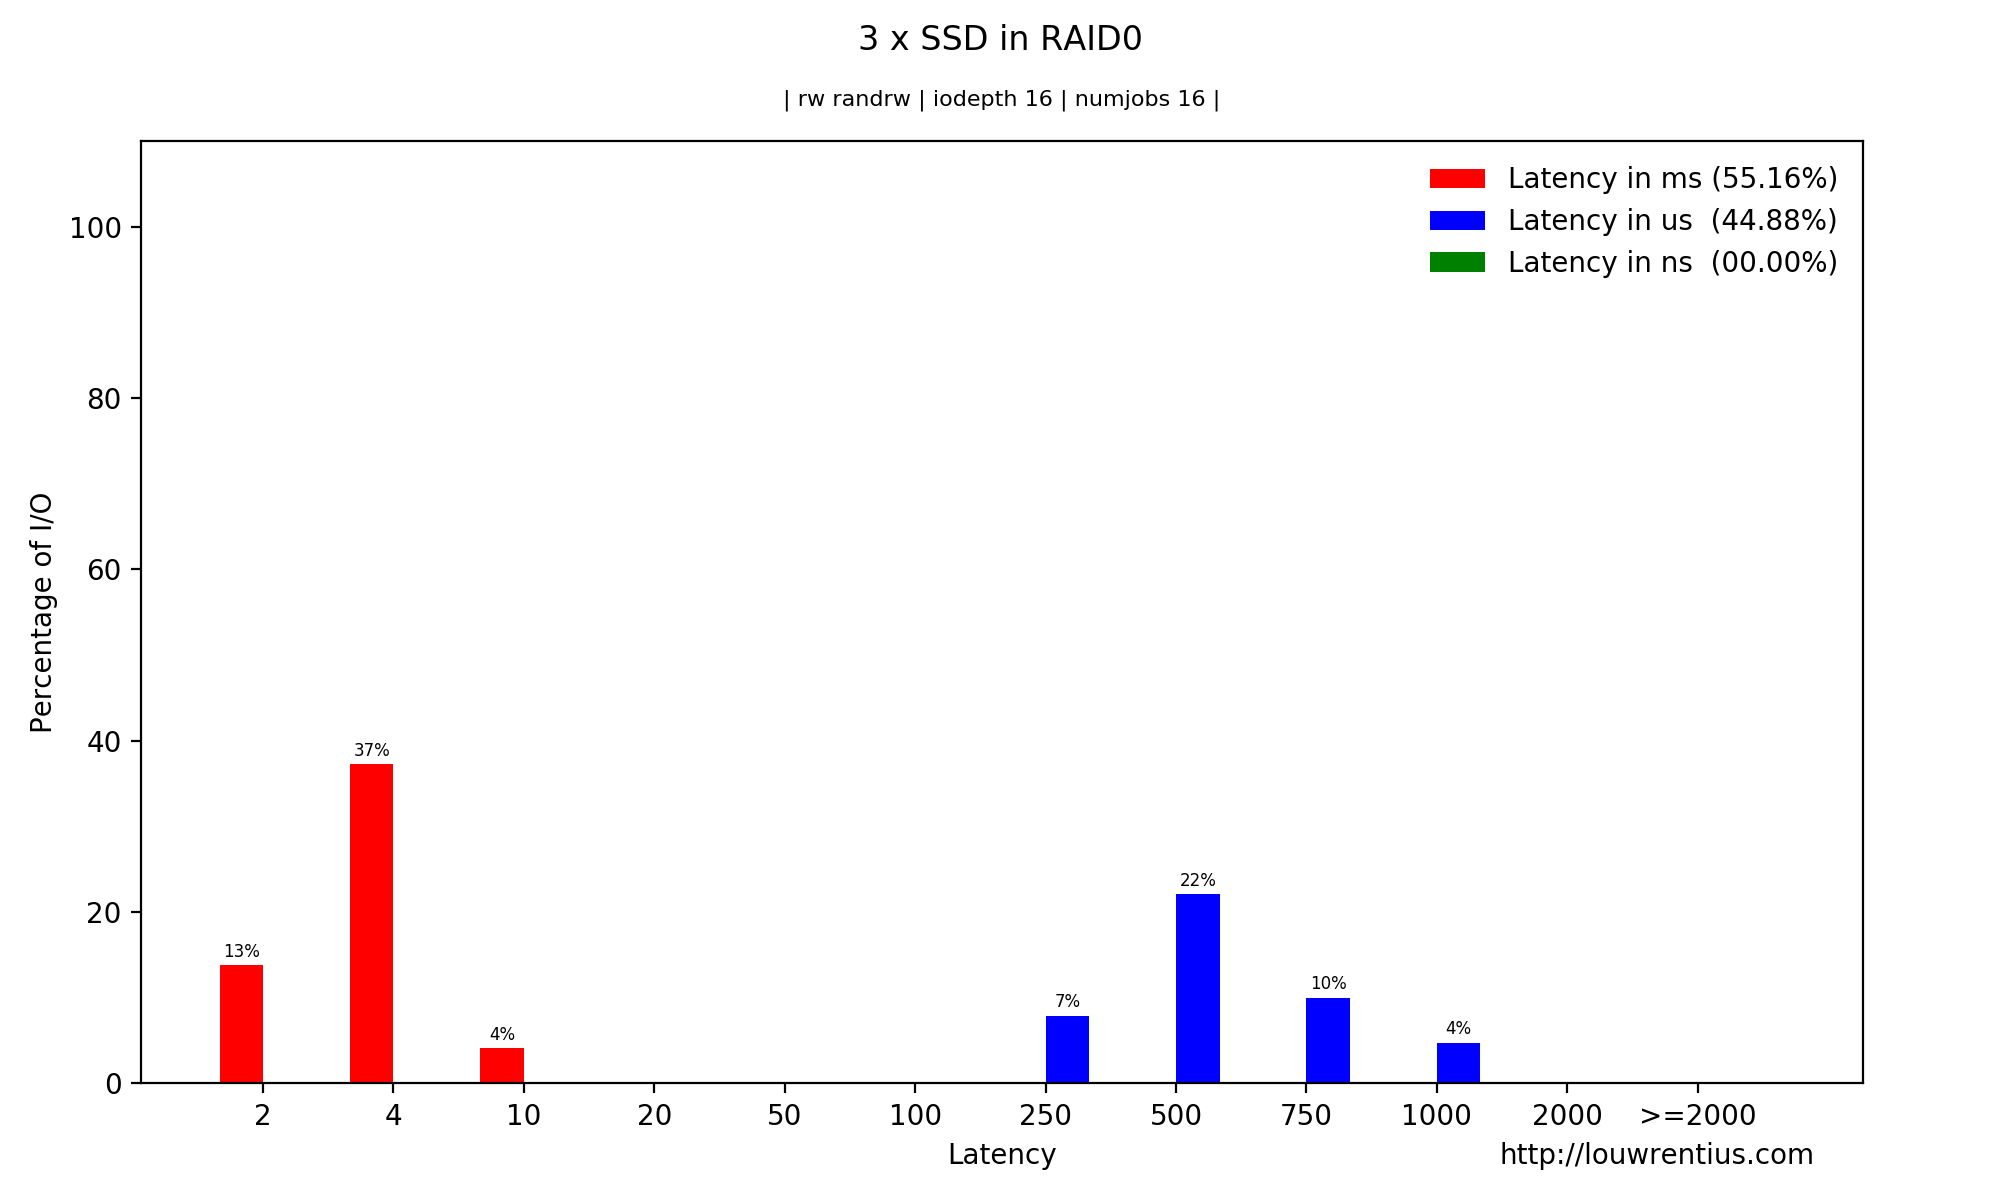
The FIO JSON output also contains latency histogram data. It's available in a ns, us and ms scale.
Alongside fio-plot, a benchmark script is provided that automates the process of running multiple benchmarks with different parameters. For example, it allows you to gather data for different queue depths or numjobs.
You can run the benchmark against an entire device or a file. For both options FIO configuration files have been created.
The synax of ./bench-fio.sh is:
./bench-fil.sh <fio template> <output dir> <test directory> <test file>
In the case of a benchmark against a file, the 'test directory' and 'test file' parameters are used. When benchmarking agains a device the 'test directory' should be a dummy value ('None'), the 'test file' parameter should be filled in with the device to be tested.
In this example, a benchmark is run against a device.
./bench-fio.sh /fio/fio-job-template-device.fio /fio/data None /dev/sdc
Many SSD vendors report really high IOPs performance numbers, beyond 100.000 IOPs for a single SSD. Those numbers are always obtained using a queue depth of 32 or higher.
In many real-life cases, such queue depths are never encountered. Often, SSDs can only achieve 10% of those IOPs performance numbers with a queue depth of 1. Such low queue depths are way more common.
In a virtualized environment, high queue depths and thus high IOPs numbers can be observed if many VMs simultaneously use storage. Individual VMs won't observe very high IOPs, only as a total set of VMs can those high IOPs results be observed.
This is how I understand queue depths and the impact on performance.
Fio-plot requires 'matplotlib' and 'numpy' to be installed.
usage: fio_plot [-h] [-i INPUT_DIRECTORY] [-T TITLE] [-s SOURCE] [-L] [-l]
				[-H] [--disable-grid] [--enable-markers] [--subtitle SUBTITLE]
				[-d IODEPTH [IODEPTH ...]] [-M [MAXDEPTH]] [-D [DPI]]
				[-p [PERCENTILE]] [-J [MAXJOBS]] [-n NUMJOBS [NUMJOBS ...]]
				[-r {read,write,randread,randwrite,randrw}] [-m MAX]
				[-y MAX_Y] [-g] [-e MOVING_AVERAGE]
				[-t {bw,iops,lat,slat,clat} [{bw,iops,lat,slat,clat} ...]]
				[-f {read,write} [{read,write} ...]]

Generates charts/graphs from FIO JSON output or logdata.

optional arguments:
  -h, --help            show this help message and exit

Generic Settings:
  -i INPUT_DIRECTORY, --input-directory INPUT_DIRECTORY
						input directory where JSON files can be found.
  -T TITLE, --title TITLE
						specifies title to use in charts
  -s SOURCE, --source SOURCE
						Author
  -L, --iodepth-numjobs-3d
						Generates a 3D-chart with iodepth and numjobs on x/y
						axis and iops or latency on the z-axis.
  -l, --latency-iops-2d
						Generates a 2D barchart of IOPs and latency for a
						particular queue depth and numjobs value.
  -H, --histogram       Generates a latency histogram for a particular queue
						depth and numjobs value.
  --disable-grid        Disables the dotted grid in the output graph.
  --enable-markers      Enable markers for the plot lines.
  --subtitle SUBTITLE   Specify your own subtitle or leave it blank with
						double quotes.
  -d IODEPTH [IODEPTH ...], --iodepth IODEPTH [IODEPTH ...]
						The I/O queue depth to graph.
  -M [MAXDEPTH], --maxdepth [MAXDEPTH]
						Maximum queue depth to graph in 3D graph.
  -D [DPI], --dpi [DPI]
						The chart will be saved with this DPI setting. Higher
						means larger image.
  -p [PERCENTILE], --percentile [PERCENTILE]
						Calculate the percentile, default 99.99th.
  -J [MAXJOBS], --maxjobs [MAXJOBS]
						Maximum number of jobs to graph in 3D graph.
  -n NUMJOBS [NUMJOBS ...], --numjobs NUMJOBS [NUMJOBS ...]
						Specifies for which numjob parameter you want the 2d
						graphs to be generated. You can specify multiple
						values separated by spaces.
  -r {read,write,randread,randwrite,randrw}, --rw {read,write,randread,randwrite,randrw}
						Specifies the kind of data you want to graph.
  -m MAX, --max MAX     Optional maximum value for Z-axis in 3D graph.
  -y MAX_Y, --max-y MAX_Y
						Optional maximum value for y-axis.
  -g, --loggraph        This option generates a 2D graph of the log data
						recorded by FIO.
  -e MOVING_AVERAGE, --moving-average MOVING_AVERAGE
						The moving average helps to smooth out graphs, the
						argument is the size of the moving window (default is
						None to disable). Be carefull as this setting may
						smooth out issues you may want to be aware of.
  -t {bw,iops,lat,slat,clat} [{bw,iops,lat,slat,clat} ...], --type {bw,iops,lat,slat,clat} [{bw,iops,lat,slat,clat} ...]
						This setting specifies which kind of metric you want
						to graph.
  -f {read,write} [{read,write} ...], --filter {read,write} [{read,write} ...]
						filter should be read/write.
Creating a 2D Bar Chart based on randread data and numjobs = 1.
./fio_plot -i <benchmark_data_folder> -T "Title" -s https://louwrentius.com -l -n 1 -r randread
Creating a 3D graph.
./fio_plot -i <benchmark_data_folder> -T "Title" -s https://louwrentius.com -L -r randread -t iops
Creating a latency histogram with a queue depth of 1 and numjobs is 1.
./fio_plot -i <benchmark_data_folder> -T "Test" -s https://louwrentius.com -H -r randread -d 1 -n 1