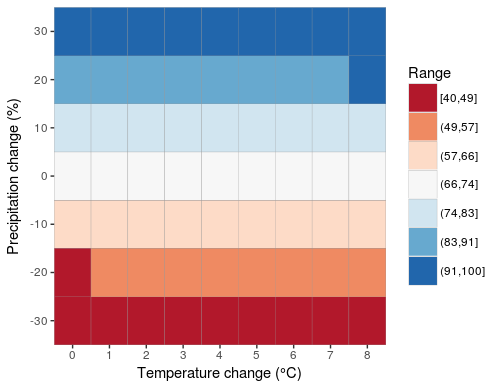
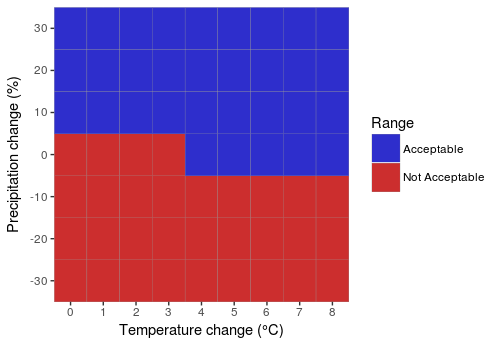
wrviz is a package meant to simplify the creation of core visualizations used by the Hydrosystems Research Group at UMass Amherst. Currently, it enables the rapid creation of climate response surfaces. Climate response surfaces are created as ggplot2 objects, enabling further customization after the core plot is made, or saving to a high resolution figure using ggsave.
df <- expand.grid(temp=0:8,precip=seq(0.7,1.3,by=0.1))
df$reliability <- seq(40,100,length=63)
climate_heatmap_continuous(df,"reliability") climate_heatmap_binary(df,"reliability") If you haven't yet, install devtools, then use it to install wrviz directly from
github.
install.packages("devtools")
libray(devtools)
devtools::install_github("tbadams45/wrviz")
Start the Climate Response Creator addin by navigating to it in the addins menu in RStudio, or directly at the console.
result <- wrviz:::climateResponseCreator()
ggplot2::ggsave("./myplot.pdf", result$plot, width = 5, height = 4.5, units = "in", dpi = 900)
