A basic livebox exporter written in rust 🦀. Start monitoring your livebox router's using Prometheus / Grafana 💪.
ℹ️ Note: this minimal, draft, poc, "tool" almost work with some luck as it is now 🤞, but for "cool" educational purpose only. Some alternatives already exists (check below), but didn't find any rust version yet. As I always wanted to learn rust, and I have a livebox router next to me, let's fill the gap (I think lol)! Contributions/help/suggestions are really welcome!
- Should work on livebox 4 and upper 🤷🏻
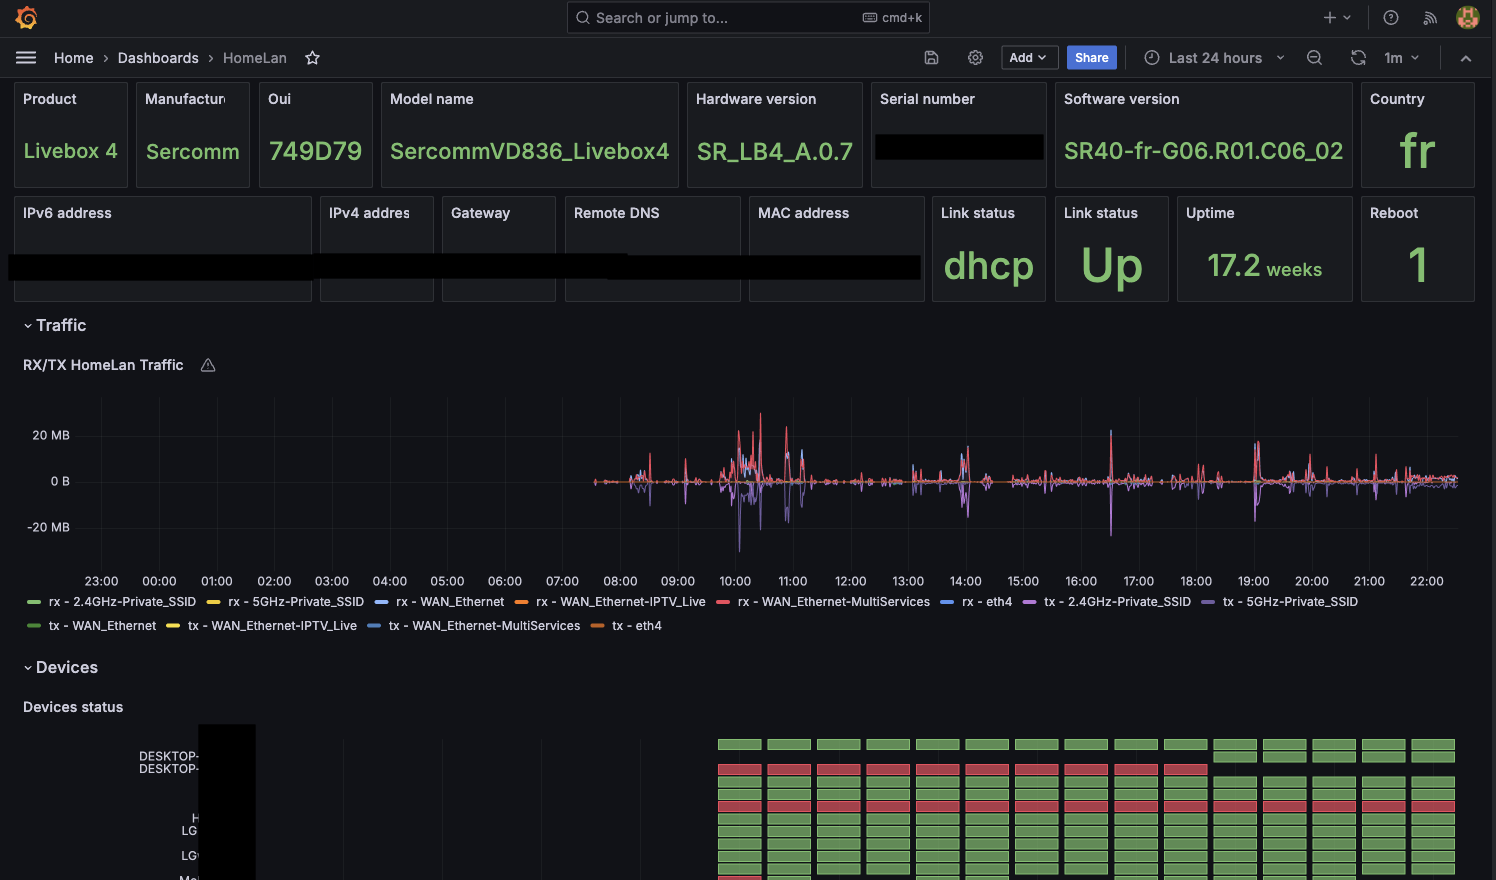
- Extracts metrics: general status, wan configuration, devices status, bandwidth
- Exposes metrics: in Prometheus format, compatible with Grafana
- Docker image: tchapacan/livebox-exporter-rs:latest
- Grafana dashboard template: check the
examplefolder
| Metric Name | Description | Type |
|---|---|---|
| livebox_infos_status | Livebox general status | gauge |
| livebox_infos_uptime | Livebox uptime | gauge |
| livebox_infos_reboot | Livebox count of reboots | gauge |
| livebox_wan_status | Livebox wan status | gauge |
| livebox_link_status | Livebox link status | gauge |
| livebox_interface_bytes_rx | Livebox interface bytes received | gauge |
| livebox_interface_bytes_tx | Livebox interface bytes transmitted | gauge |
| livebox_device_status | Livebox connected devices status | gauge |
-
Pull latest docker image: to your local machine.
docker pull tchapacan/livebox-exporter-rs:latest
-
Run the Exporter: run the docker images, using the options.
docker run -d --name livebox-exporter-rs -h livebox-exporter-rs -p <exporter_port>:<exporter_port> tchapacan/livebox-exporter-rs:latest --password <livebox_password> --port <exporter_port>
-
Access Metrics: Once the exporter is running, access the exposed metrics at:
http://localhost:<exporter_port>/metrics
-
Clone the Repository: to your local machine.
git clone https://github.com/tchapacan/livebox-exporter-rs.git
-
Build the Project: go to the project directory and build the project.
cd livebox-exporter-rs
cargo build --release
cd target/release/
-
Run the Exporter: run the binary, using the options.
./livebox-exporter-rs -P <livebox_password> -p <exporter_port>
-
Access Metrics: Once the exporter is running, access the exposed metrics at:
http://localhost:<exporter_port>/metrics
Supported command-line options (hope -P vs -p not to confusing):
| Option | Description | Default Value |
|---|---|---|
| -P, --password | Livebox password (required) | None |
| -p, --port | Exporter port | 9100 |
| -l, --listen | Listen address | 0.0.0.0 |
| -G, --gateway | Livebox gateway ip address | 192.168.1.1 |
| -v, --verbose | Enable verbose logging (repeat for increased verbosity) | Off |
| -h, --help | Display help message | N/A |
Usage: livebox-exporter-rs [OPTIONS] --password <password>

Options:
  -p, --port <port>          exporter port [default: 9100]
  -l, --listen <address>     listen address [default: 0.0.0.0]
  -v, --verbose...           verbose logging
  -P, --password <password>  Livebox password [required]
  -G, --gateway <gateway>    Livebox gateway ip address [default: 192.168.1.1]
  -h, --help                 Print help
-V, --version Print version- Use the prometheus_exporter_base crate for formatting Prometheus metrics.
- Based on a rework version of the livebox rust client project to output additional metrics.
Grafana/prometheus/livebox-exporter-rs
example
├── .env
├── docker-compose.yaml
├── grafana
│   ├── HomeLan.json
│   └── datasource.yml
└── prometheus
└── prometheus.yml- Docker should be installed on your machine.
- Configure your livebox password .env and source it before running
docker-compose.
cd example && cp .env.example .envUpdate env..
source .envUpdate your
LIVEBOX_PASSWORDenv secrets variable and source it
- Run the following command to start the services defined in the
docker-compose.yamlfile:
docker-compose up -d- Open your web browser and navigate to http://localhost:3000.
- Log in with the default credentials:
- Username: admin
- Password: grafana
- Once logged into Grafana, click on the + icon in the left sidebar and select Import.
- Upload HomeLan.json json dashboard template from example or copy paste content
- Import and start enjoying your dashboard!
Contributions are really welcome! If you encounter any issues, have suggestions, or would like to add/fix features, please do:
- Open an issue to report bugs or request features.
- Fork the repository, create your branch, make your changes, and submit a pull request.
For more details here are the contribution guidelines
If you discover any security-related issues, please follow the responsible disclosure process and report a security issues here. Thank you!
- https://github.com/Tomy2e/livebox-exporter
- https://github.com/jeanfabrice/livebox-exporter
- https://la.robinjiang.com/cyr-ius/hass-livebox-component
- https://la.robinjiang.com/p-dor/LiveboxMonitor
- and surely even more...
Livebox is a trademark owned by France Telecom and Orange, and is their property. This tool only uses the name as it is the router this exporter is about. No intellectual property infrigement intended. This work has been done for educational purpose as a personal monitoring side project and shared to the community. If there's any issue with the use of this name here, please don't hesitate to contact me.


