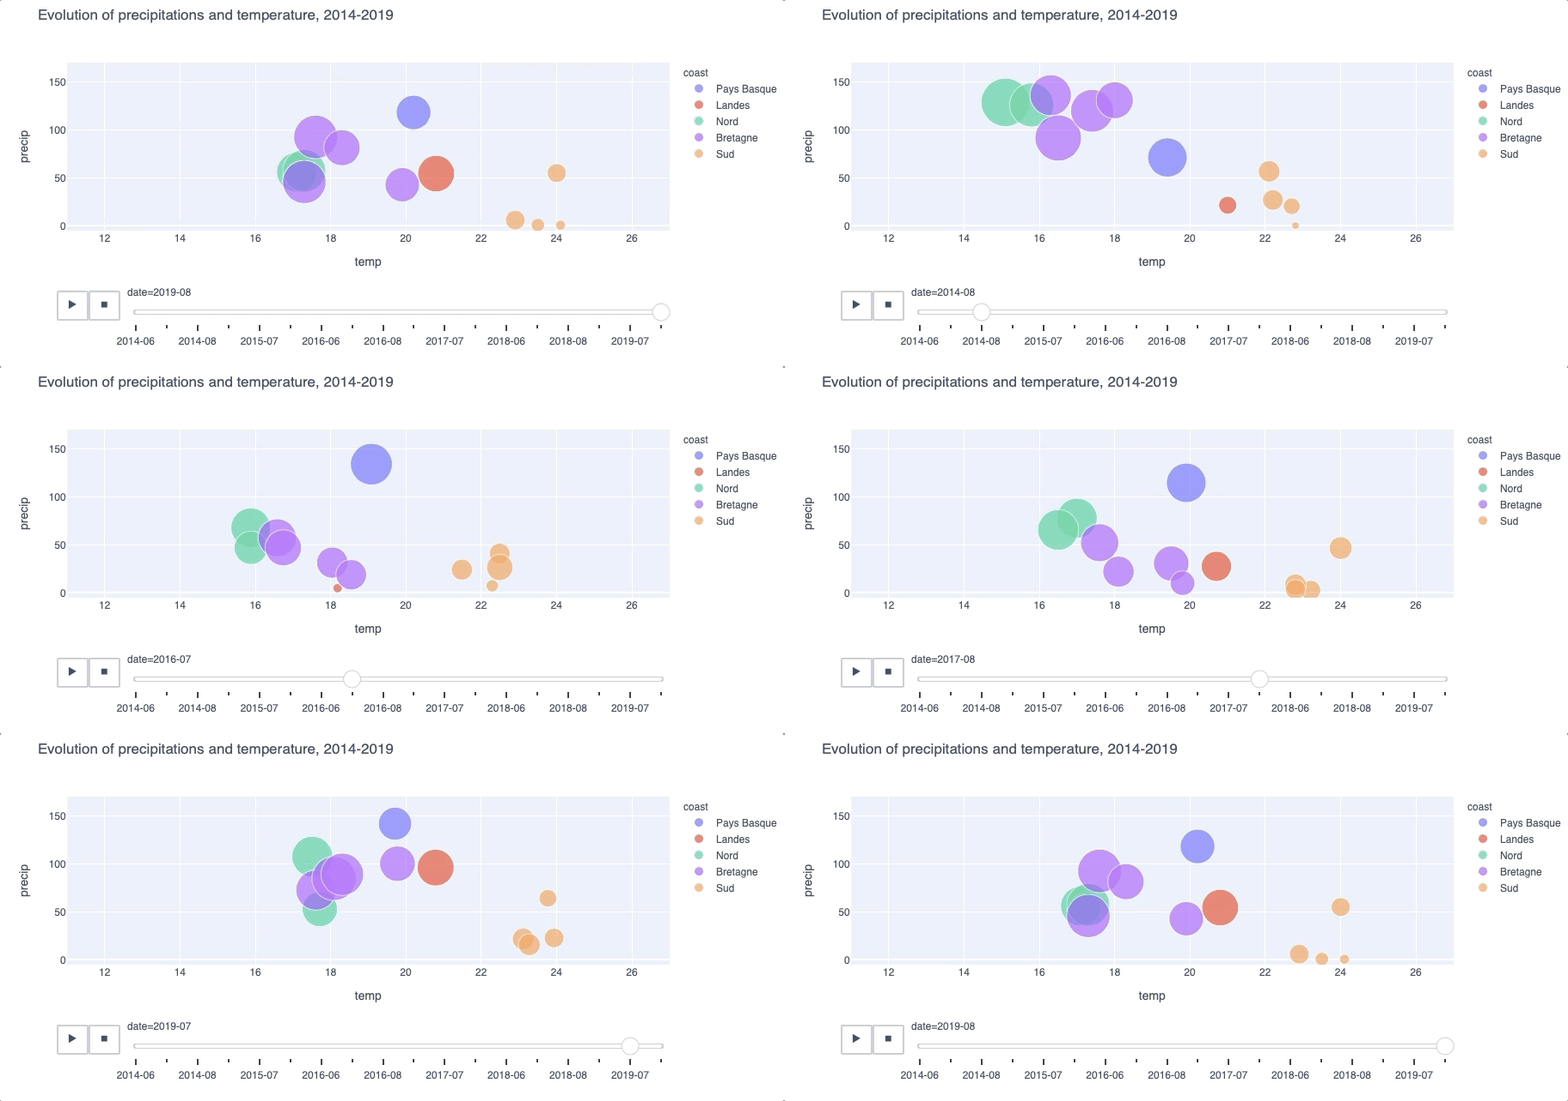
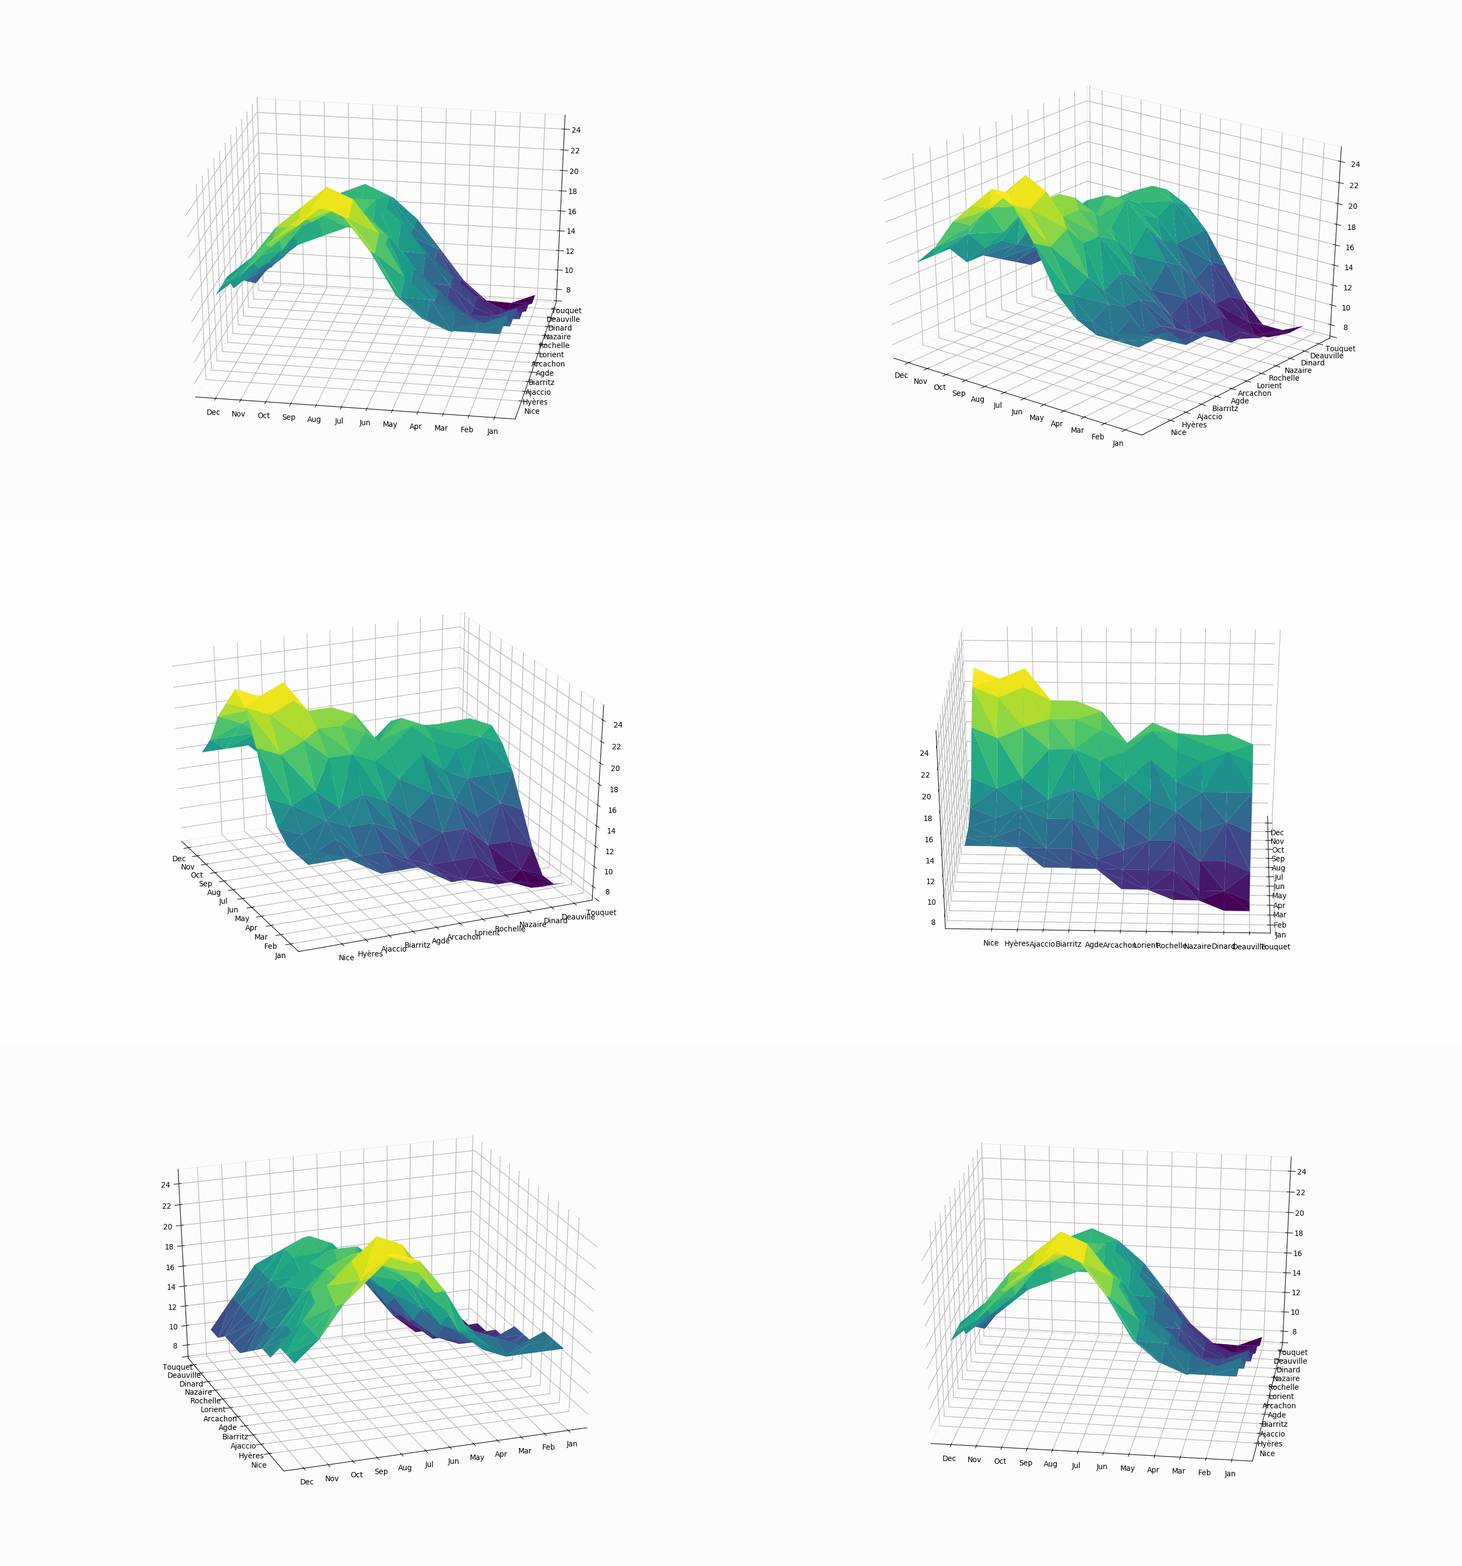
Analyzing and representing meteorological variables in famous towns along the French coast, over the past 6 years.
Historical data comes from meteorological stations in French coastal airports part of the METAR network (see notebook for more details).
I started with a simple notebook, with static and animated graphs (see examples below).
Next step would be to try to build more animations and potentially wrap them up into a small Dash app.
Interesting graphs include:


