Totalsat is a Python package to easily download and preprocess Sentinel-2 and Landsat 5-7-8 images directly in a Jupyter notebook. It also includes additional satellite-related tools such as image labelling, image splitting, map data plotting, reverse geocoding, etc.
The package is built on top of GDAL, Google Earth Engine and the coastsat library. I developed it as an open-source project during my intership at Total in Paris (July 2020). This project wasn't meant for production - it's more of a quick hack to facilitate satellite image analysis. Therefore many things aren't 100% clean and could still be optimized - you're welcome to re-use and adapt everything to your needs!
First of all, make sure you create a new environment using conda env create -f environment.yml -n totalsat. You can then take a look at the demo notebook (totalsat_demo.html, and .ipynb version in the demo_files folder) to get started!
You'll also find below a few examples of what you can do with totalsat. The full set of examples with code are in the demo notebook, and all functions accross the 3 modules (sat_download, sat_preprocess and sat_tools) are documented in the documentation folder.
sat_downloadmodule
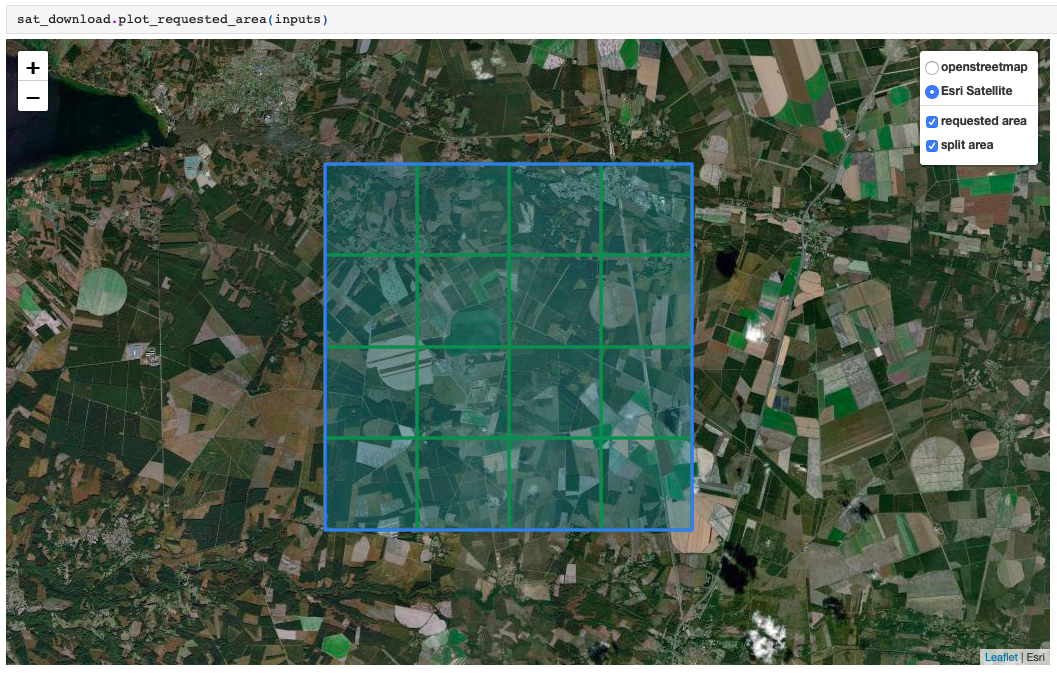
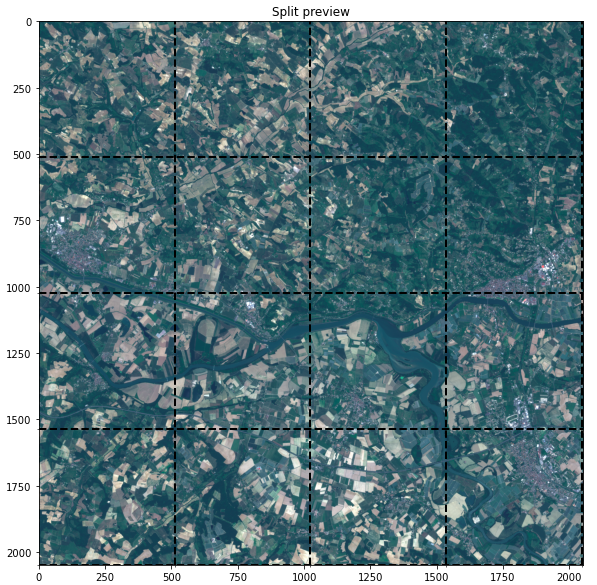
With this module, you can download images from Sentinel or Landsat satellites over a chosen area and with multiple parameters, including splitting the satellite bands in smaller tiles for easier manipulation, as visualized below.
sat_preprocessmodule
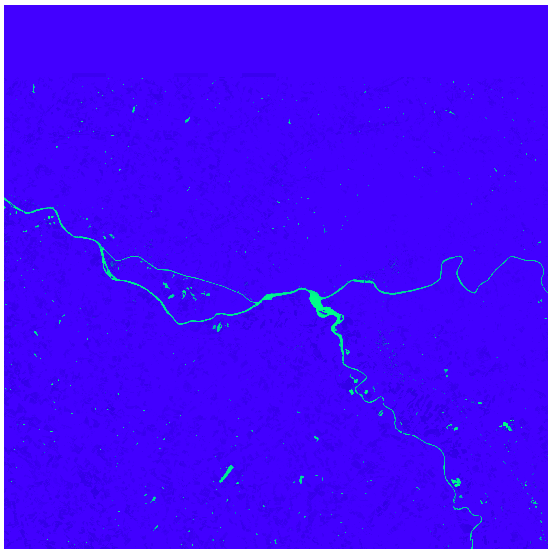
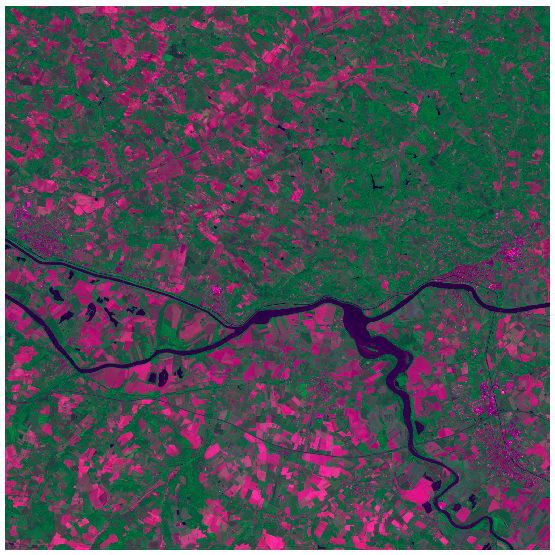
With this module, you can stack spectral bands to obtain regular RGB images, or compute custom remote sensing indices - below, the Normalized Difference Water Index (NDWI) and a custom index computed as R * 1, NIR * 0.5, B * 0.7.
 |
 |
|---|
sat_toolsmodule
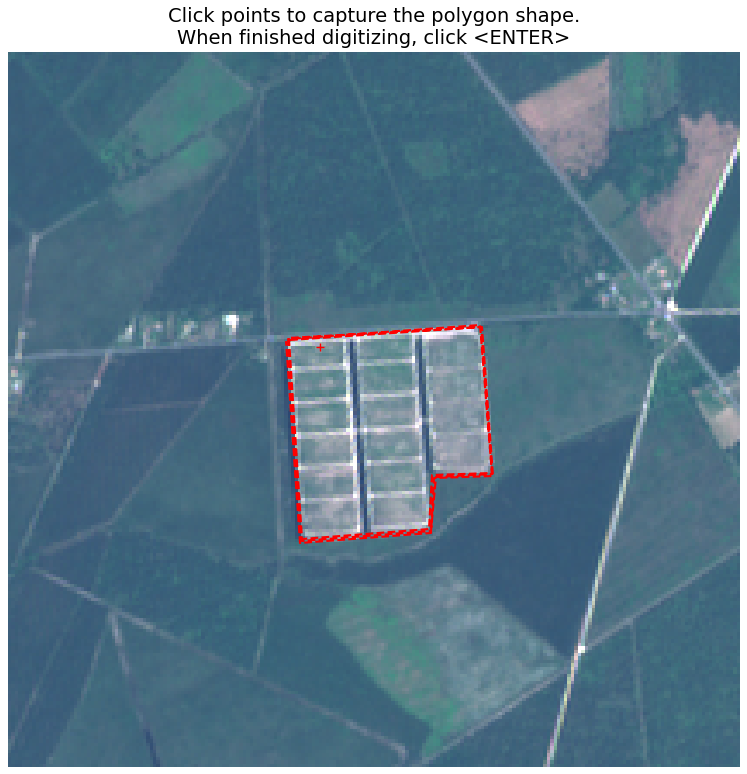
With this module, you can perform a set of tasks to facilitate satellite image analysis, among which image splitting and image labelling. The image labelling tool uses qt to open a matplotlib user interface in a new window, where you can delineate polygons on your images, or simply define binary labels for classification. Labels are saved as either a csv or a list of polygon coordinates in GeoJSON format.
 |
 |
|---|
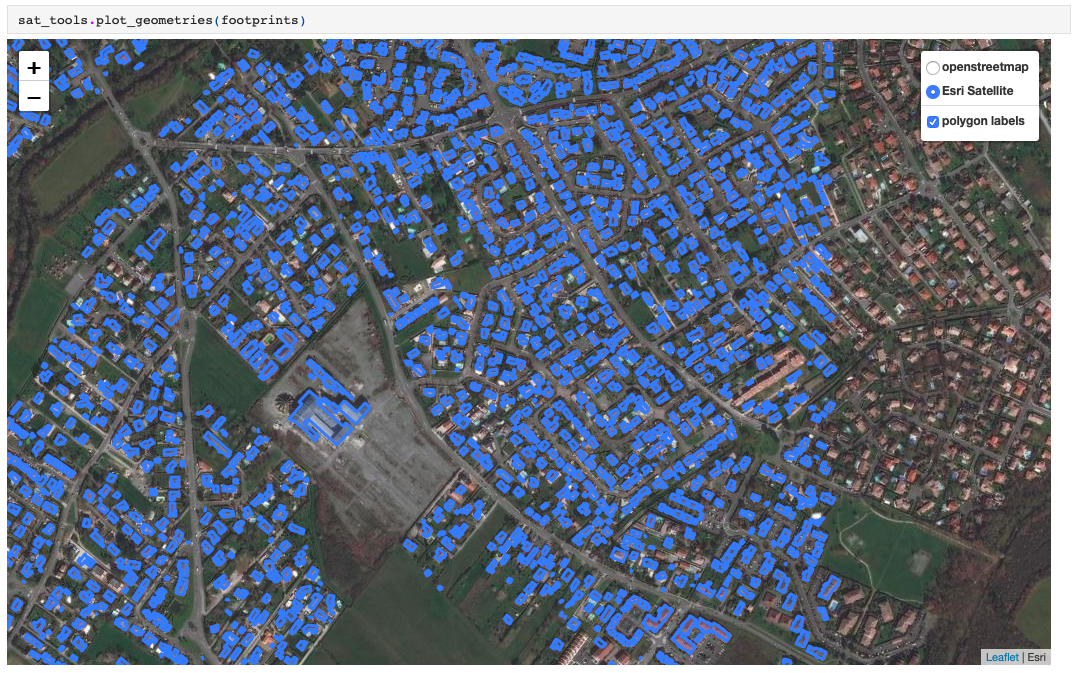
Finally (but see more in the demo), you can use this module to download and plot map data queried from OpenStreetMap (using the great osmnx library).

