This project shows how to use micrometer in springboot
Micrometer provides a simple facade over the instrumentation clients for the most popular monitoring systems, allowing you to instrument your JVM-based application code without vendor lock-in. Think SLF4J, but for metrics.
Starting with Spring Boot 2.0, Micrometer is the instrumentation library powering the delivery of application metrics from Spring. Support is ported back to Boot 1.x through an additional library dependency. (Refer https://micrometer.io/)
Prometheus is an open-source systems monitoring and alerting toolkit originally built at SoundCloud.
Features are
- a multi-dimensional data model with time series data identified by metric name and key/value pairs
- a flexible query language to leverage this dimensionality
- no reliance on distributed storage; single server nodes are autonomous
- time series collection happens via a pull model over HTTP
- pushing time series is supported via an intermediary gateway
- targets are discovered via service discovery or static configuration
- multiple modes of graphing and dashboarding support
(Refer https://prometheus.io/)
Docker Command:
docker pull prom/prometheus
Grafana is an open platform for beautiful analytics and monitoring. The leading open source software for time series analytics. o matter where your data is, or what kind of database it lives in, you can bring it together with Grafana. Beautifully.
(Refer https://grafana.com/)
Docker Command:
docker pull grafana/grafana
Its a simple rest application. I have used prometheus and grafana for this springboot micrometer application.
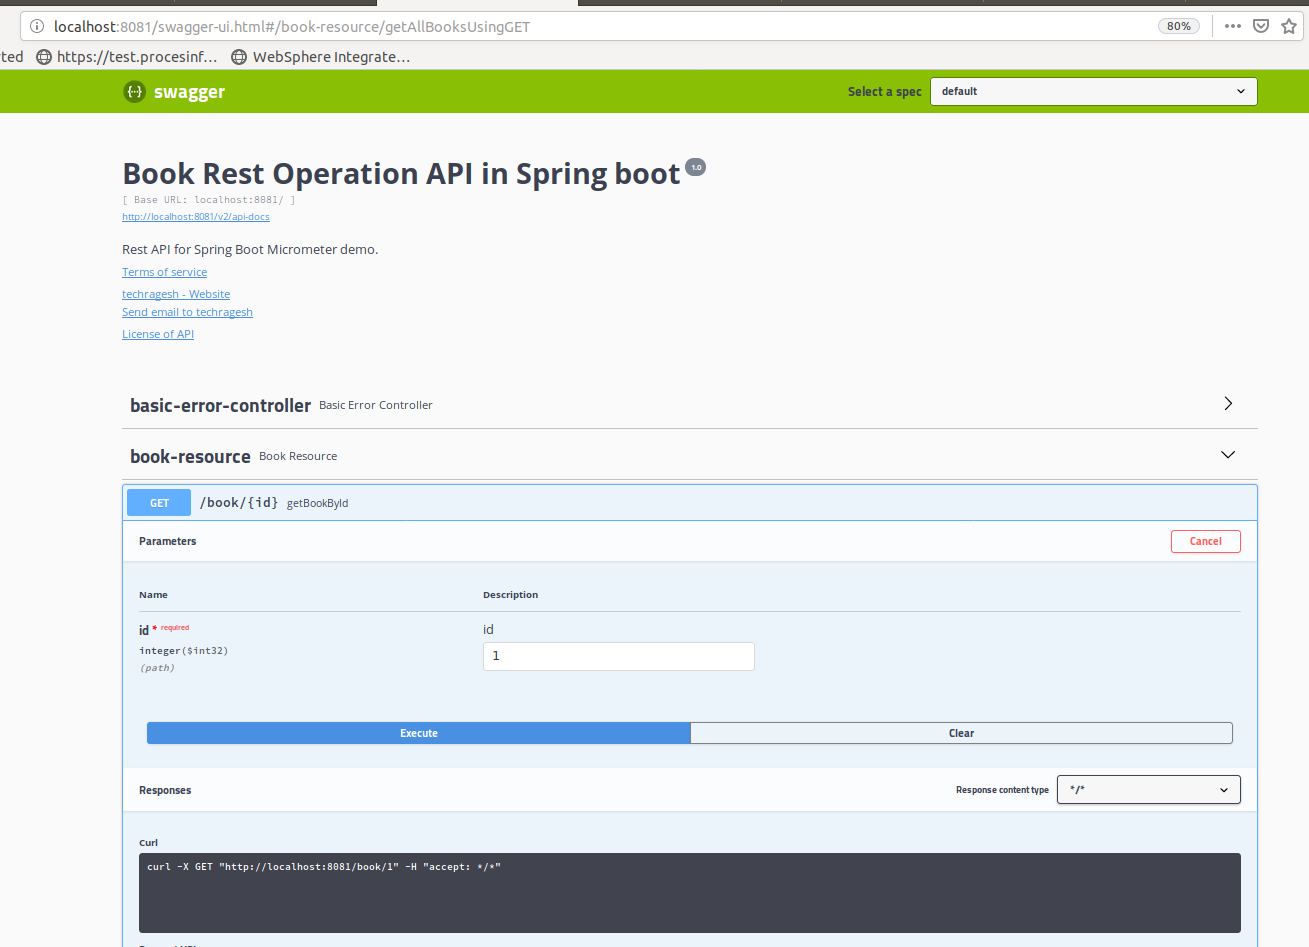
Also I have used swagger, lombok and mapstruct dependencies.
Let me explain some key points while using this.
Swagger:
All you know, Swagger takes the manual work out of API documentation, with a range of solutions for generating, visualizing, and maintaining API docs.
Maven Dependencies
        <dependency>
            <groupId>io.springfox</groupId>
            <artifactId>springfox-swagger2</artifactId>
            <version>${springfox-version}</version>
            <exclusions>
                <exclusion>
                    <groupId>org.mapstruct</groupId>
                    <artifactId>mapstruct</artifactId>
                </exclusion>
            </exclusions>
        </dependency>
        <dependency>
            <groupId>io.springfox</groupId>
            <artifactId>springfox-swagger-ui</artifactId>
            <version>${springfox-version}</version>
        </dependency>
Note: I have excluded mapstruct because i used mapstruct explicitly
lombok
Lombok is a java library that automatically plugs into your editor and build tools, spicing up your java
Maven Dependencies
        <dependency>
            <groupId>org.projectlombok</groupId>
            <artifactId>lombok</artifactId>
            <optional>true</optional>
        </dependency>
MapStruct
MapStruct is a code generator that greatly simplifies the implementation of mappings between Java bean types based on a convention over configuration approach.
        <dependency>
            <groupId>org.mapstruct</groupId>
            <artifactId>mapstruct-jdk8</artifactId>
            <version>1.2.0.Final</version>
        </dependency>

        <dependency>
            <groupId>org.mapstruct</groupId>
            <artifactId>mapstruct-processor</artifactId>
            <version>1.2.0.Final</version>
            <scope>provided</scope>
        </dependency>

        <plugin>
             <groupId>org.apache.maven.plugins</groupId>
             <artifactId>maven-compiler-plugin</artifactId>
             <version>3.7.0</version>
                <configuration>
                   <source>1.8</source>
                   <target>1.8</target>
                   <annotationProcessorPaths>
                     <path>
                       <groupId>org.mapstruct</groupId>
                       <artifactId>mapstruct-processor</artifactId>
                       <version>1.2.0.Final</version>
                     </path>
                     <path>
                       <groupId>org.projectlombok</groupId>
                       <artifactId>lombok</artifactId>
                       <version>${lombok.version}</version>
                      </path>
                   </annotationProcessorPaths>
                </configuration>
         </plugin>
To make java bean mapping easy, I used mapstruct. I have used Book and BookEntity class.
BookMapper.java
@Mapper(unmappedTargetPolicy = ReportingPolicy.IGNORE, componentModel="spring")
public interface BookMapper {

    @Mappings({
        @Mapping(source = "bookName", target = "name")
    })
    Book toBook(BookEntity bookEntity);

    @InheritInverseConfiguration
    BookEntity fromBook(Book book);
}
Micrometer
        <dependency>
            <groupId>io.micrometer</groupId>
            <artifactId>micrometer-core</artifactId>
        </dependency>
        <dependency>
            <groupId>io.micrometer</groupId>
            <artifactId>micrometer-registry-prometheus</artifactId>
        </dependency>
MicrometerConfig.java
@Configuration
public class MicrometerConfig {

    @Bean
    MeterRegistryCustomizer meterRegistryCustomizer(MeterRegistry meterRegistry) {
        return meterRegistry1 -> {
            meterRegistry.config()
                    .commonTags("application", "springboot-micrometer-demo");
        };
    }
}
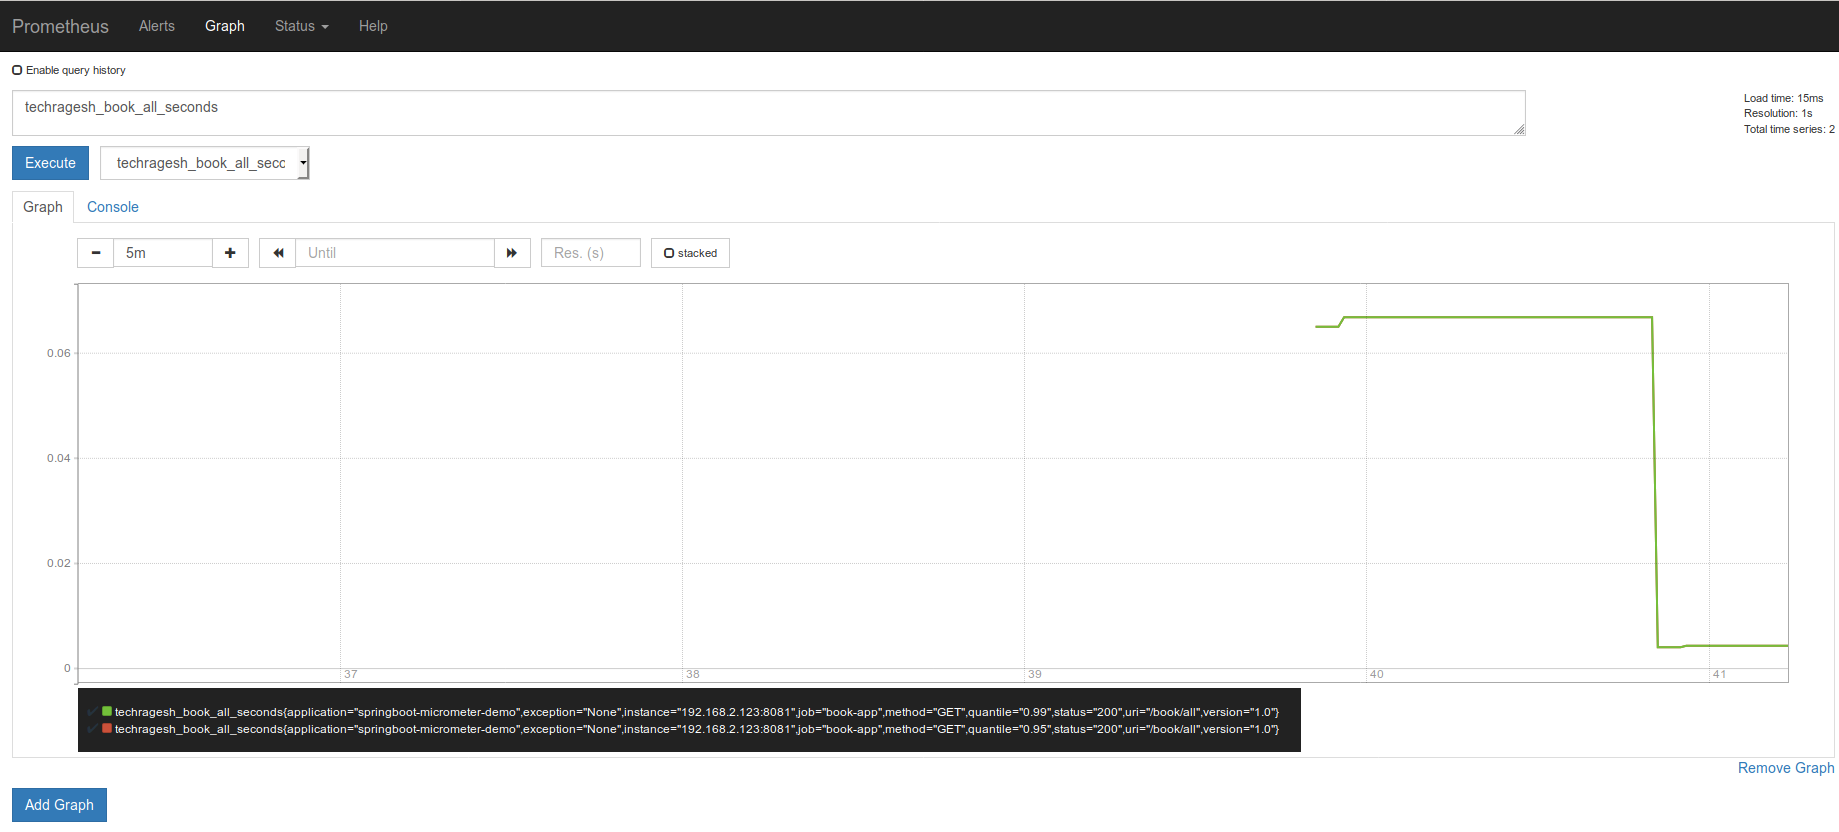
Also @Timed annotation in each controller method to track the metrics
@Timed(
            value = "techragesh.book.all",
            histogram = true,
            percentiles = {0.95, 0.99},
            extraTags = {"version", "1.0"}
    )
Output:
Add this application into prometheus
- Install prometheus image in docker.
- Created book-app.yml file
#Global configurations
global:
  scrape_interval:     5s # Set the scrape interval to every 5 seconds.
  evaluation_interval: 5s # Evaluate rules every 5 seconds.

scrape_configs:
  - job_name: 'book-app'
    metrics_path: '/actuator/prometheus'
    static_configs:
      - targets: ['192.168.2.123:8081']
Note: We have to use ip-addreess instead of localhost in targets in yml file
- Run this command in docker:
docker run -d -p 9090:9090 -v <path>/book-app.yml:/etc/prometheus/prometheus.yml prom/prometheus --config.file=/etc/prometheus/prometheus.yml
Note: is your book-app.yml location
Add prometheus into grafana
- Install grafana image in docker.
- Run grafana from docker and create your login
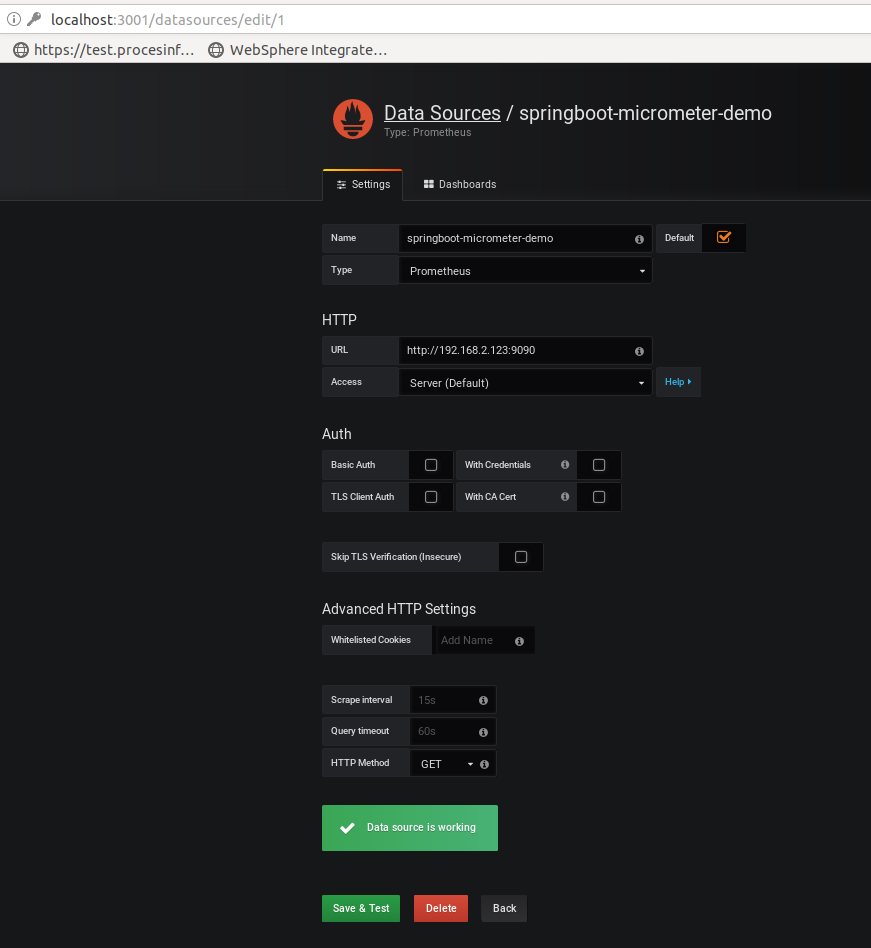
- Add prometheus datasource in grafana.
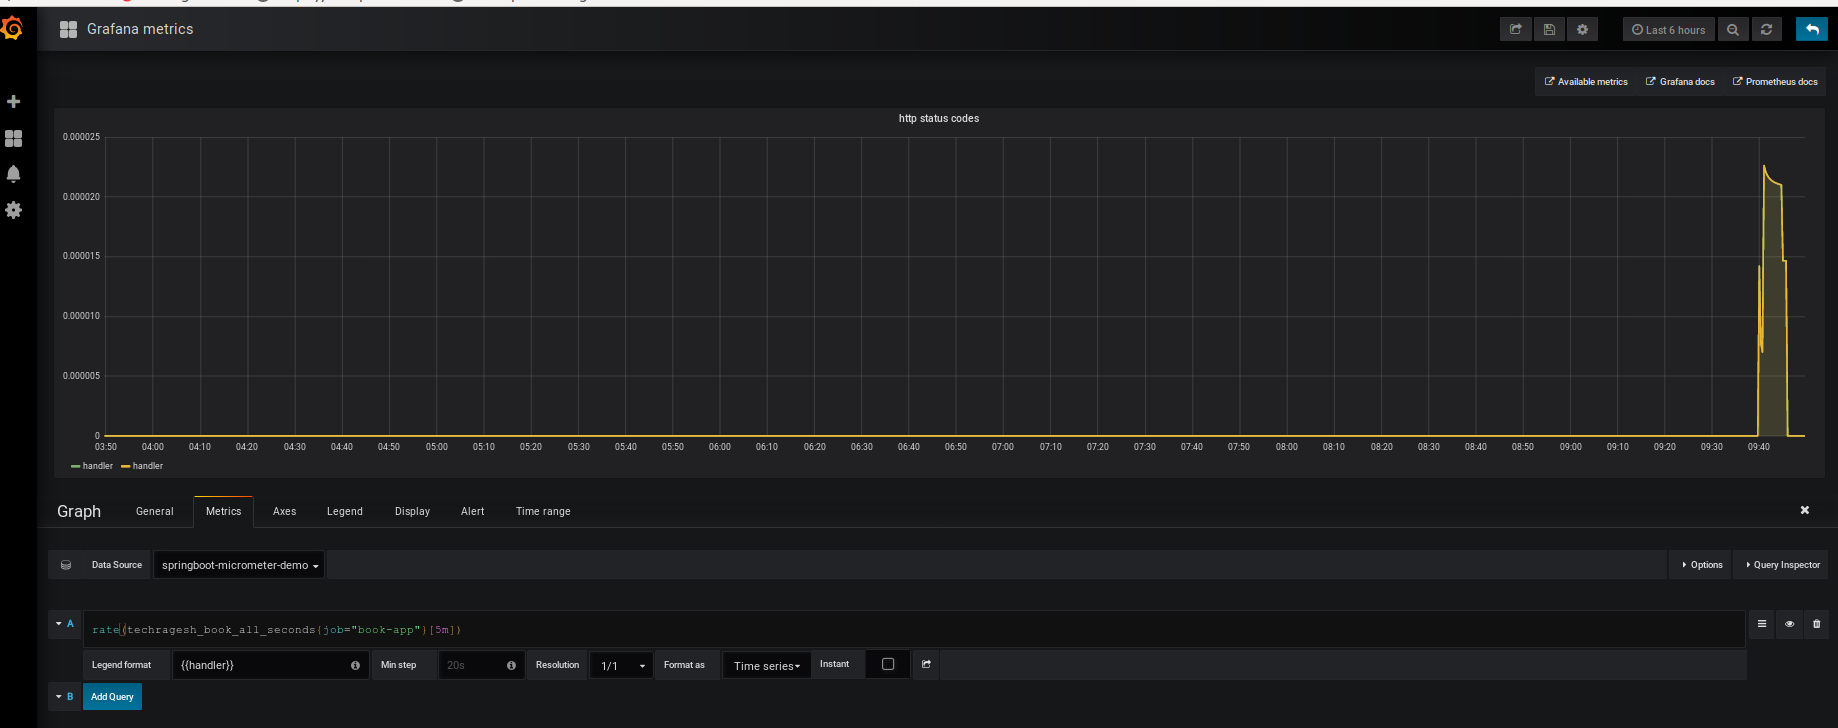
- Add the query under metrics tab
rate(techragesh_book_all_seconds{job="book-app"}[5m])
